This is a short guide to exploring the Imago image viewing tools in a web browser. There are no obligations or costs involved in using the demo.
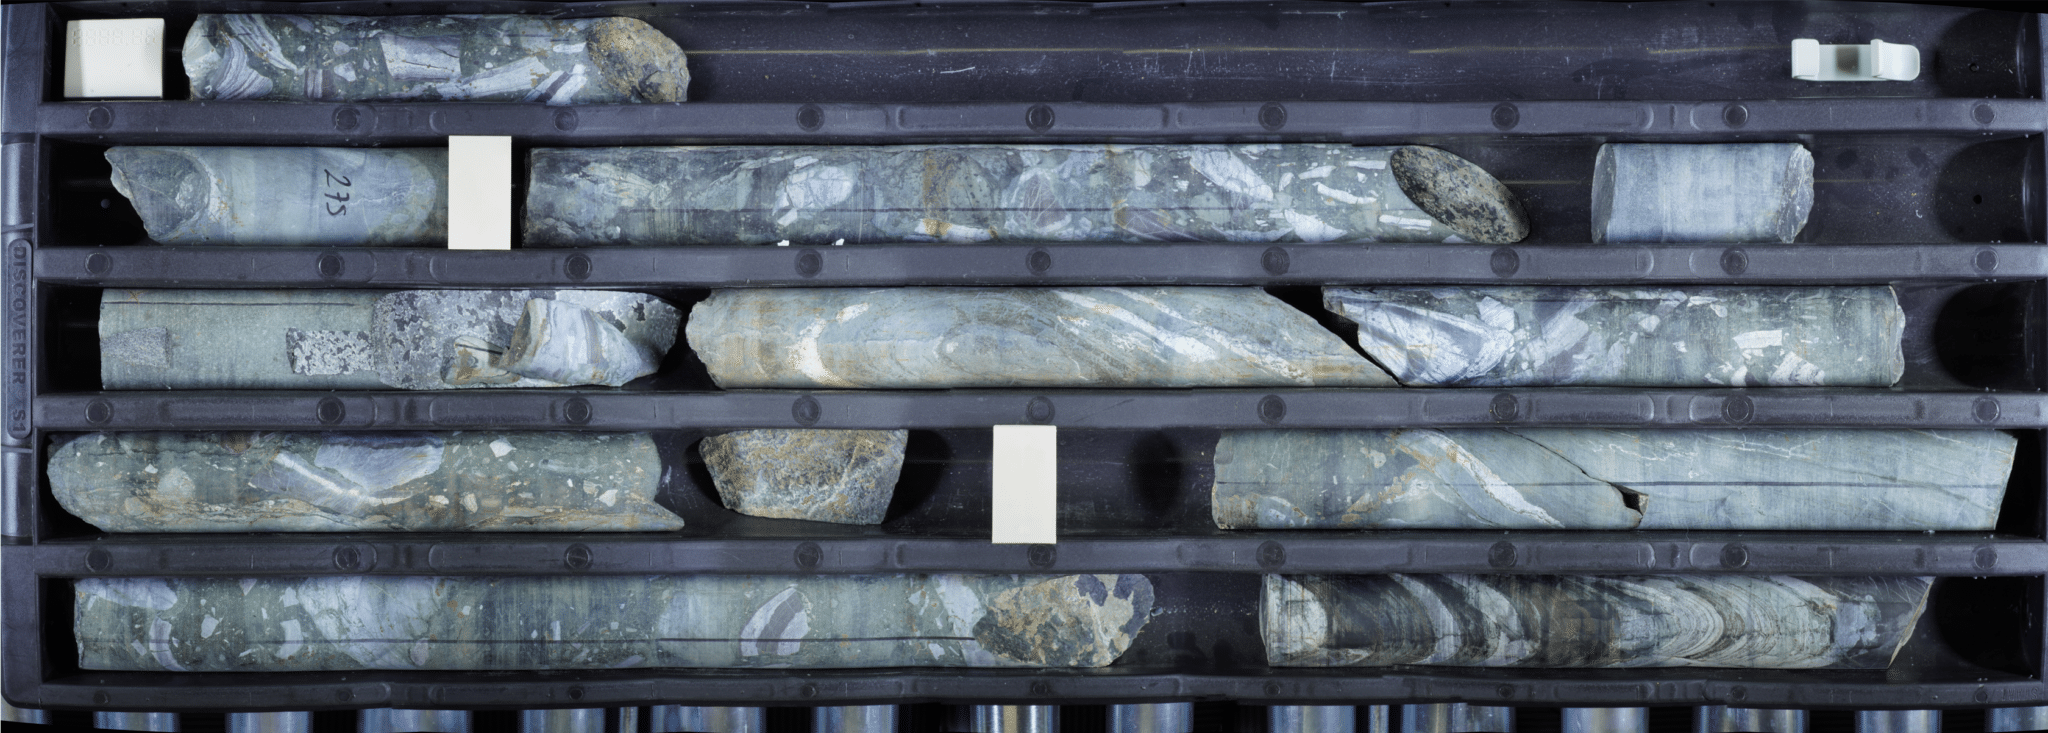
The Imago viewer is designed for geological core tray and chip images. It uses intelligent logic, optimization techniques and the performance of the Microsoft Cloud to provide instant, high performance viewing. Geologists are able to study the mineralogy and rock quality, monitor the consistency of logging and use the images to continuously inform their interpretation, drilling and mining decisions.
NB: A username and password may be requested if accessing advanced features:
https://imago.seequent.com/demo/drilling
Username: ImagoDemo2
Password: ImagoDemo2
Viewing the demonstration images
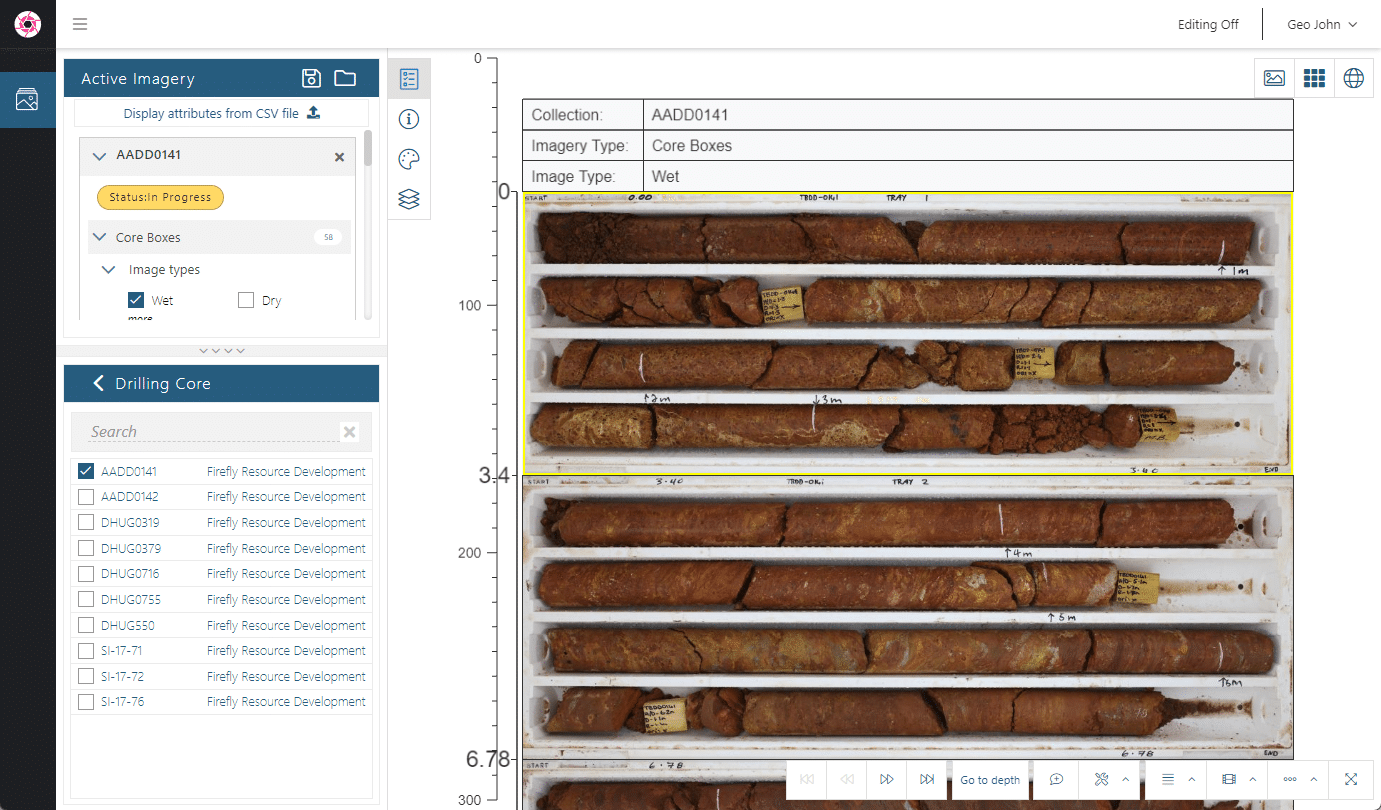
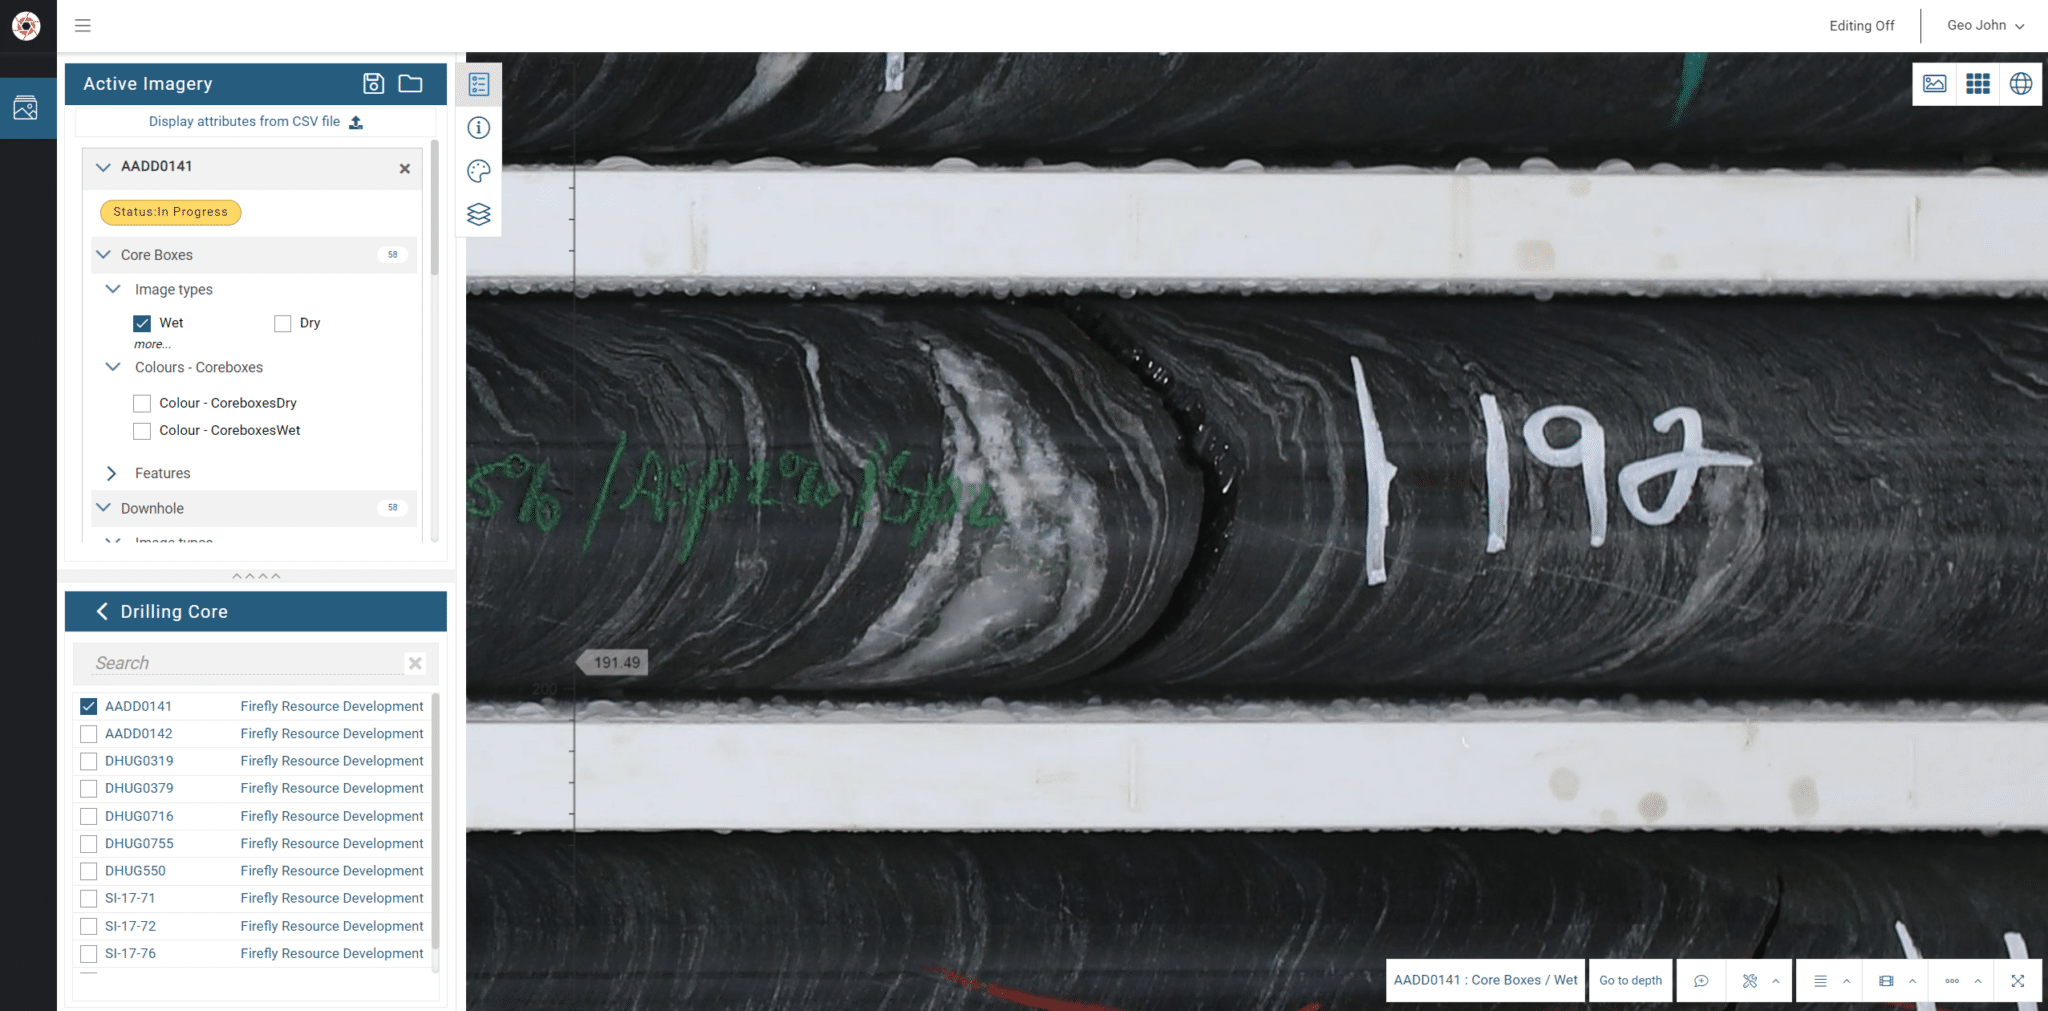
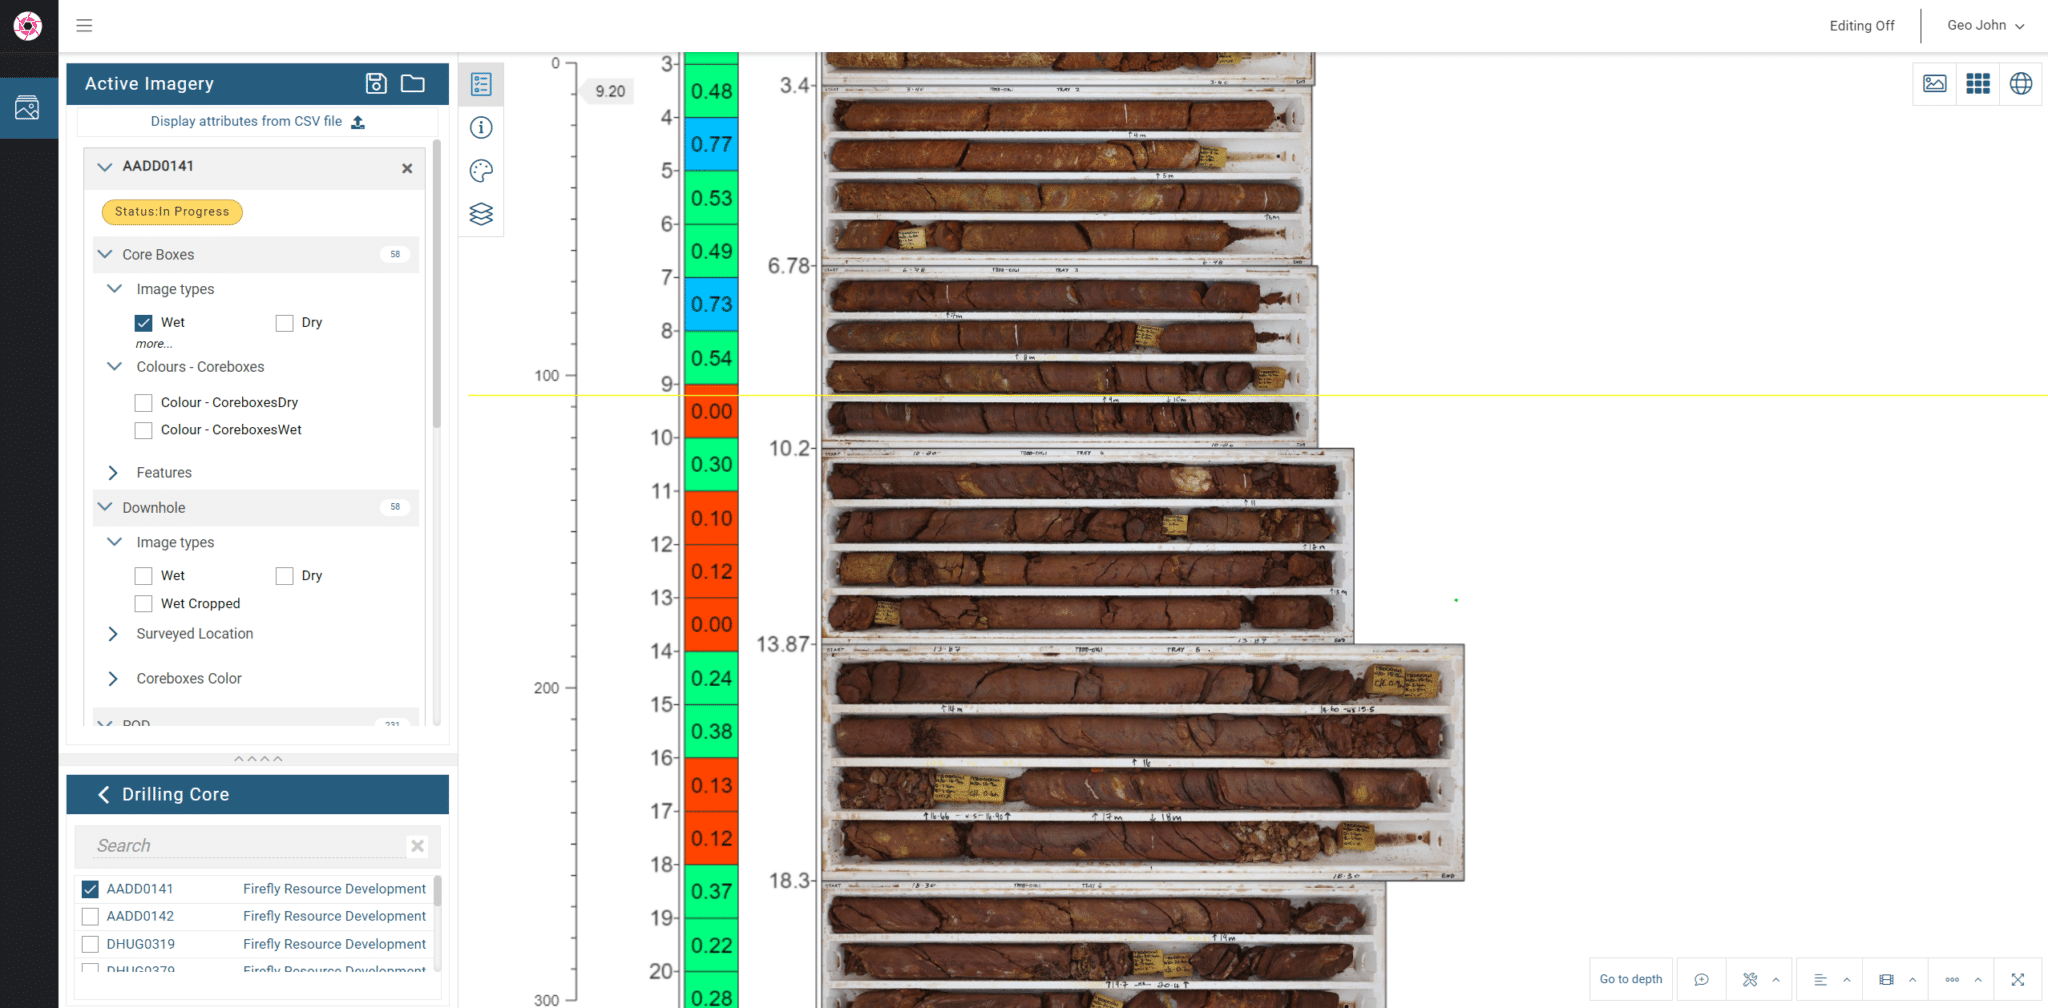
- When you open the viewer, we have set up the demo to display a single drill hole automatically. You will see the core trays are displayed as a drill hole. Scroll up and down the page and Zoom in/out using your mouse wheel.
2. Click the scale option on the lower right to resize the images according to the depth interval covered by the tray. Click the depth bar to move to the depth of interest. For example 190m.
3. Use the mouse wheel to zoom in closely to see the mineral zone of interest.
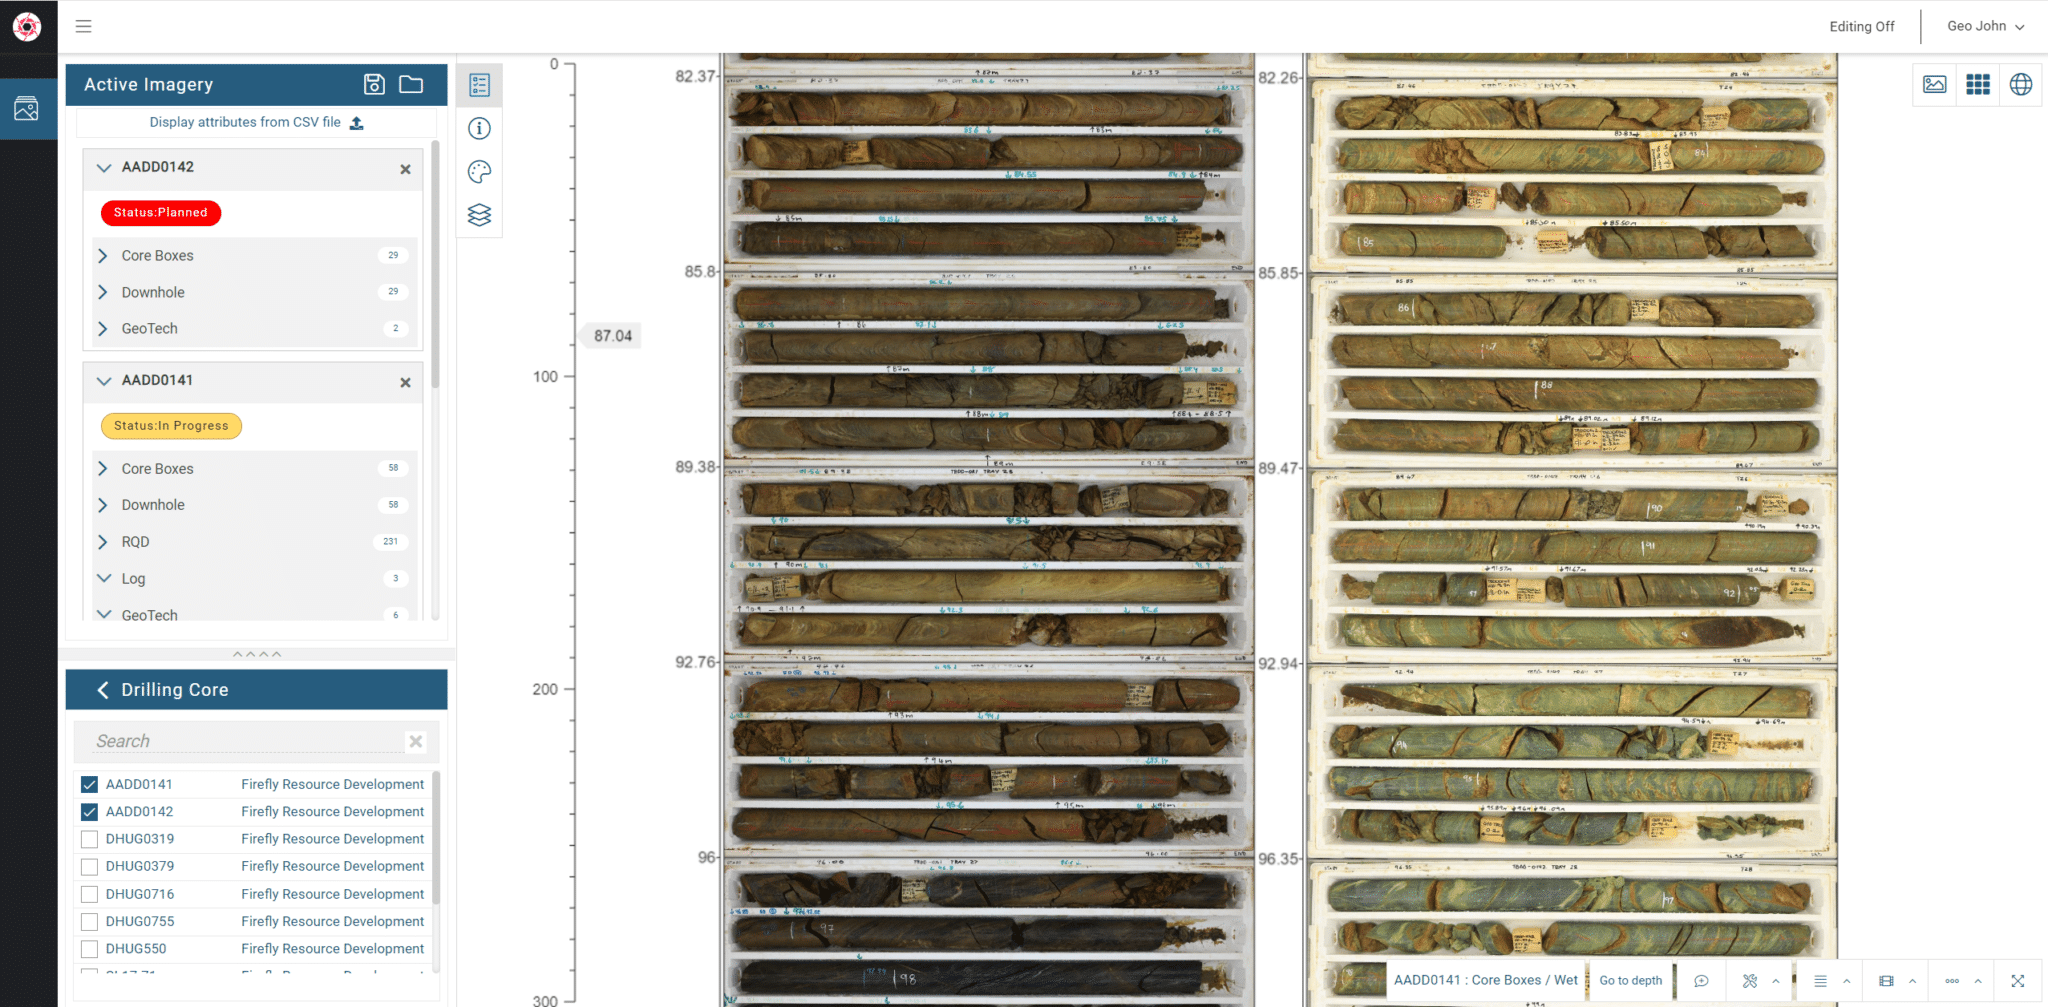
4. In the left navigation menu, tick drill hole AADD0142 to add it to the display. Zoom and pan to adjust the display. Ctrl + Pan to move a hole up and down to adjust for ‘in-tray’ depths. Tick Dry checkbox in the top navigation panel to display the dry version of the hole. Zoom out to view.
5. Click on the folder icon to see a list of saved views.
Exploring the saved views
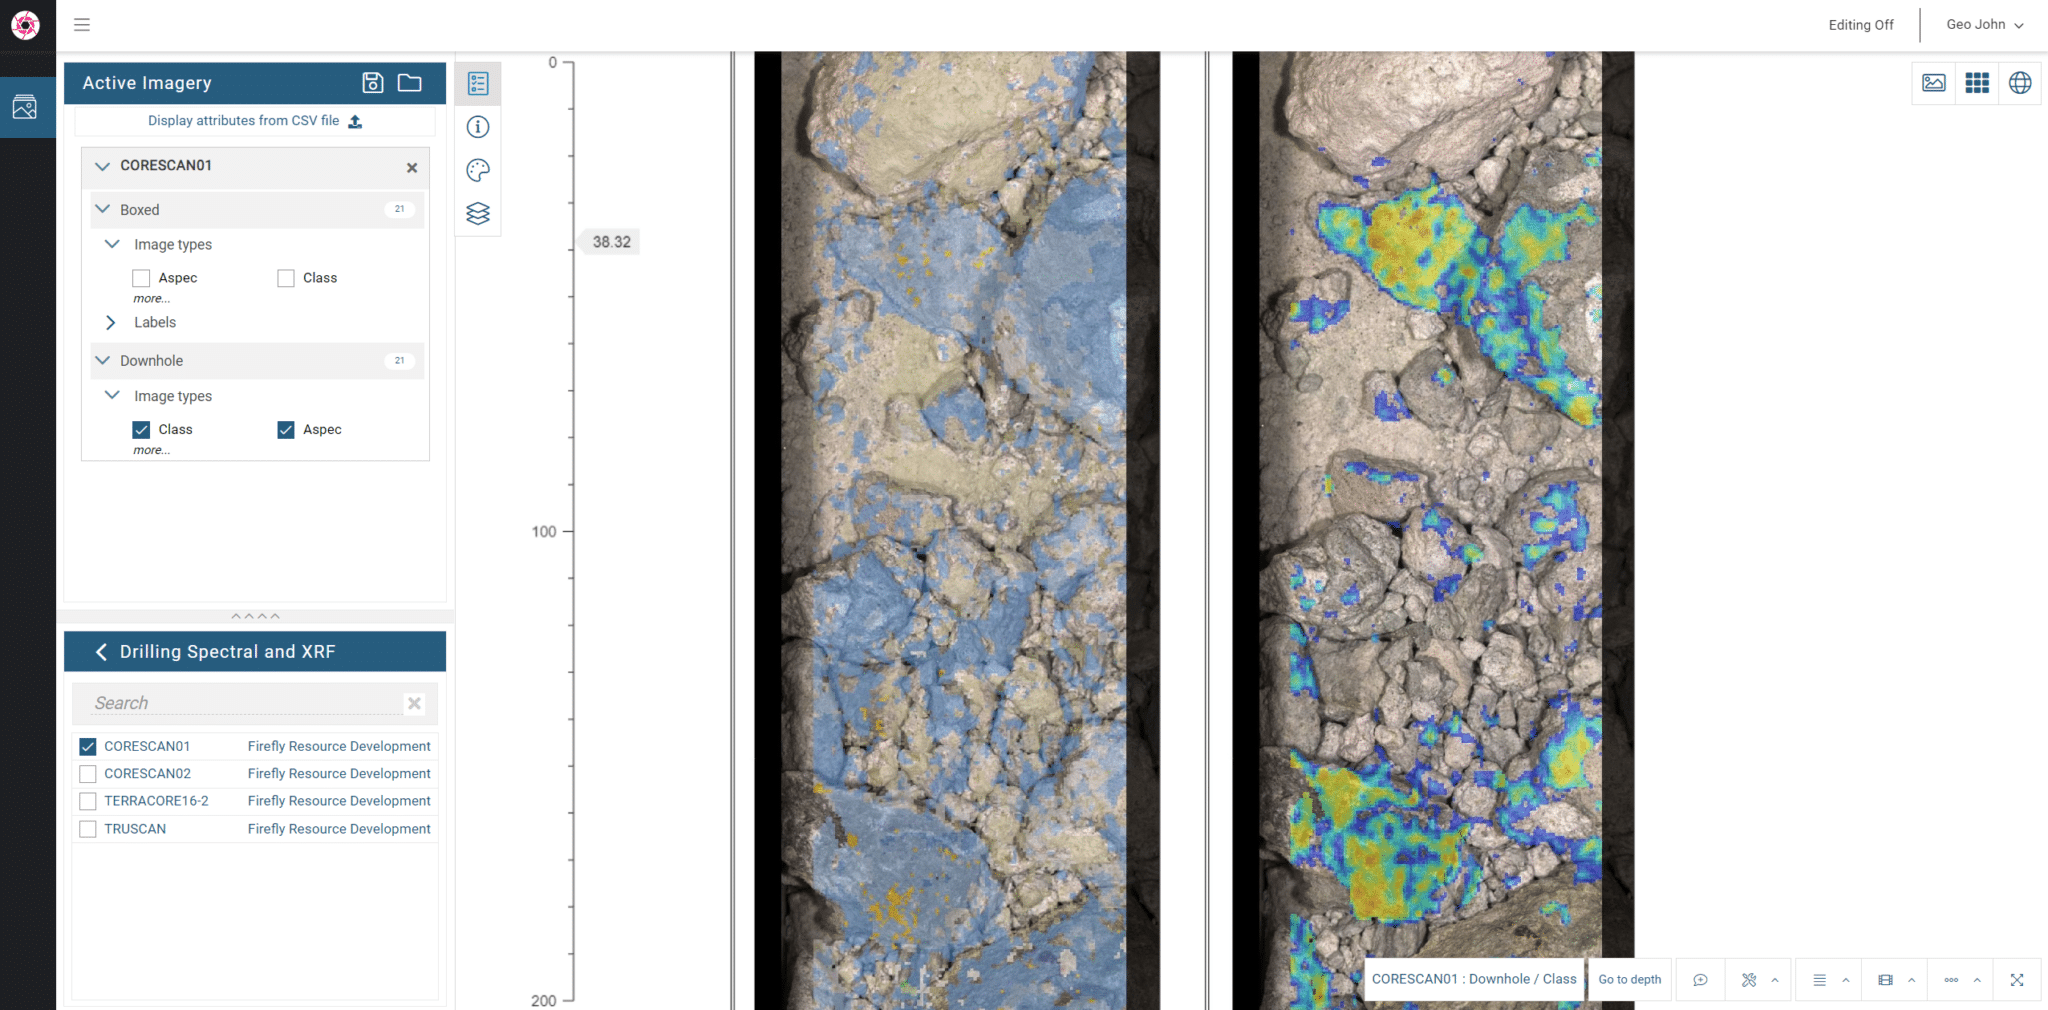
6. Hyperspectral. (You may need to toggle the scale view setting for this one).
Scale Bar reminder:
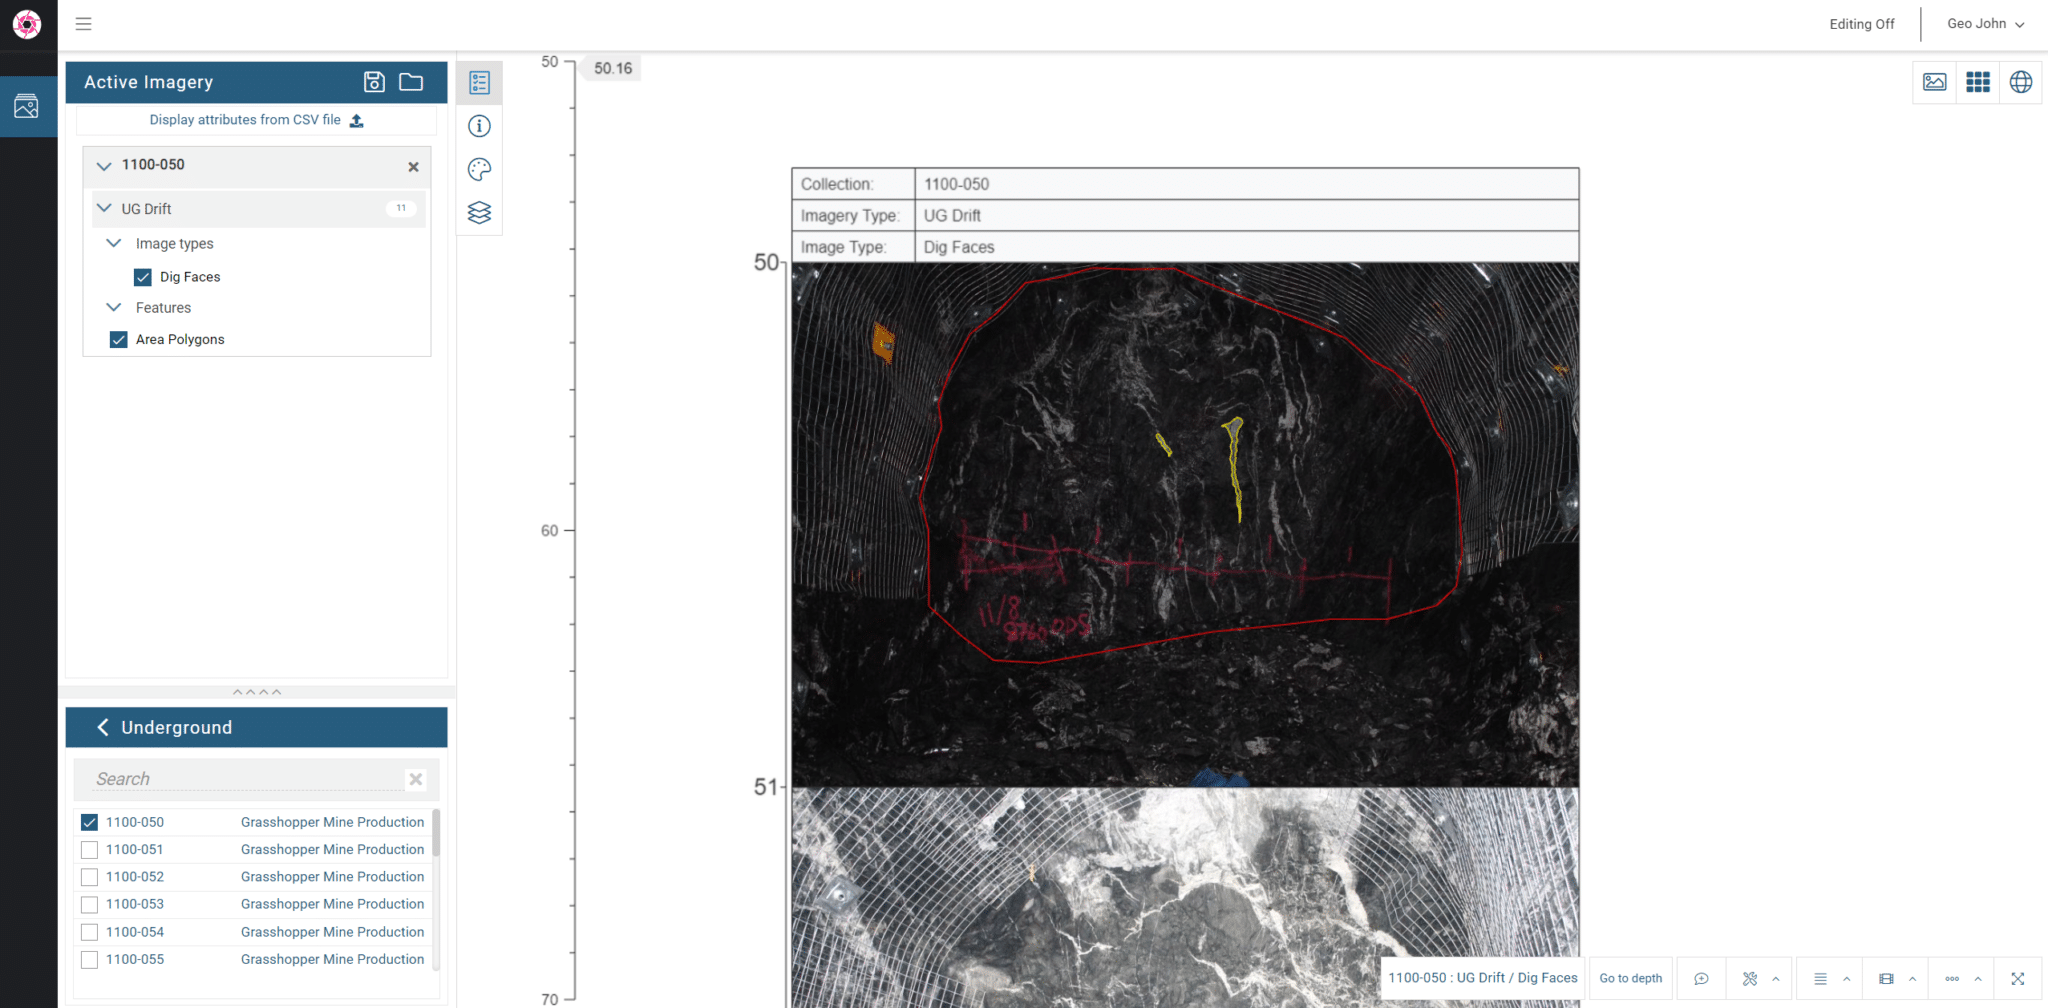
7. This view shows underground faces photographed using the Imago Mobile app where the geologist maps the lithology on screen. The face image and lithology polygon are synced to the Imago Portal when the device is online.
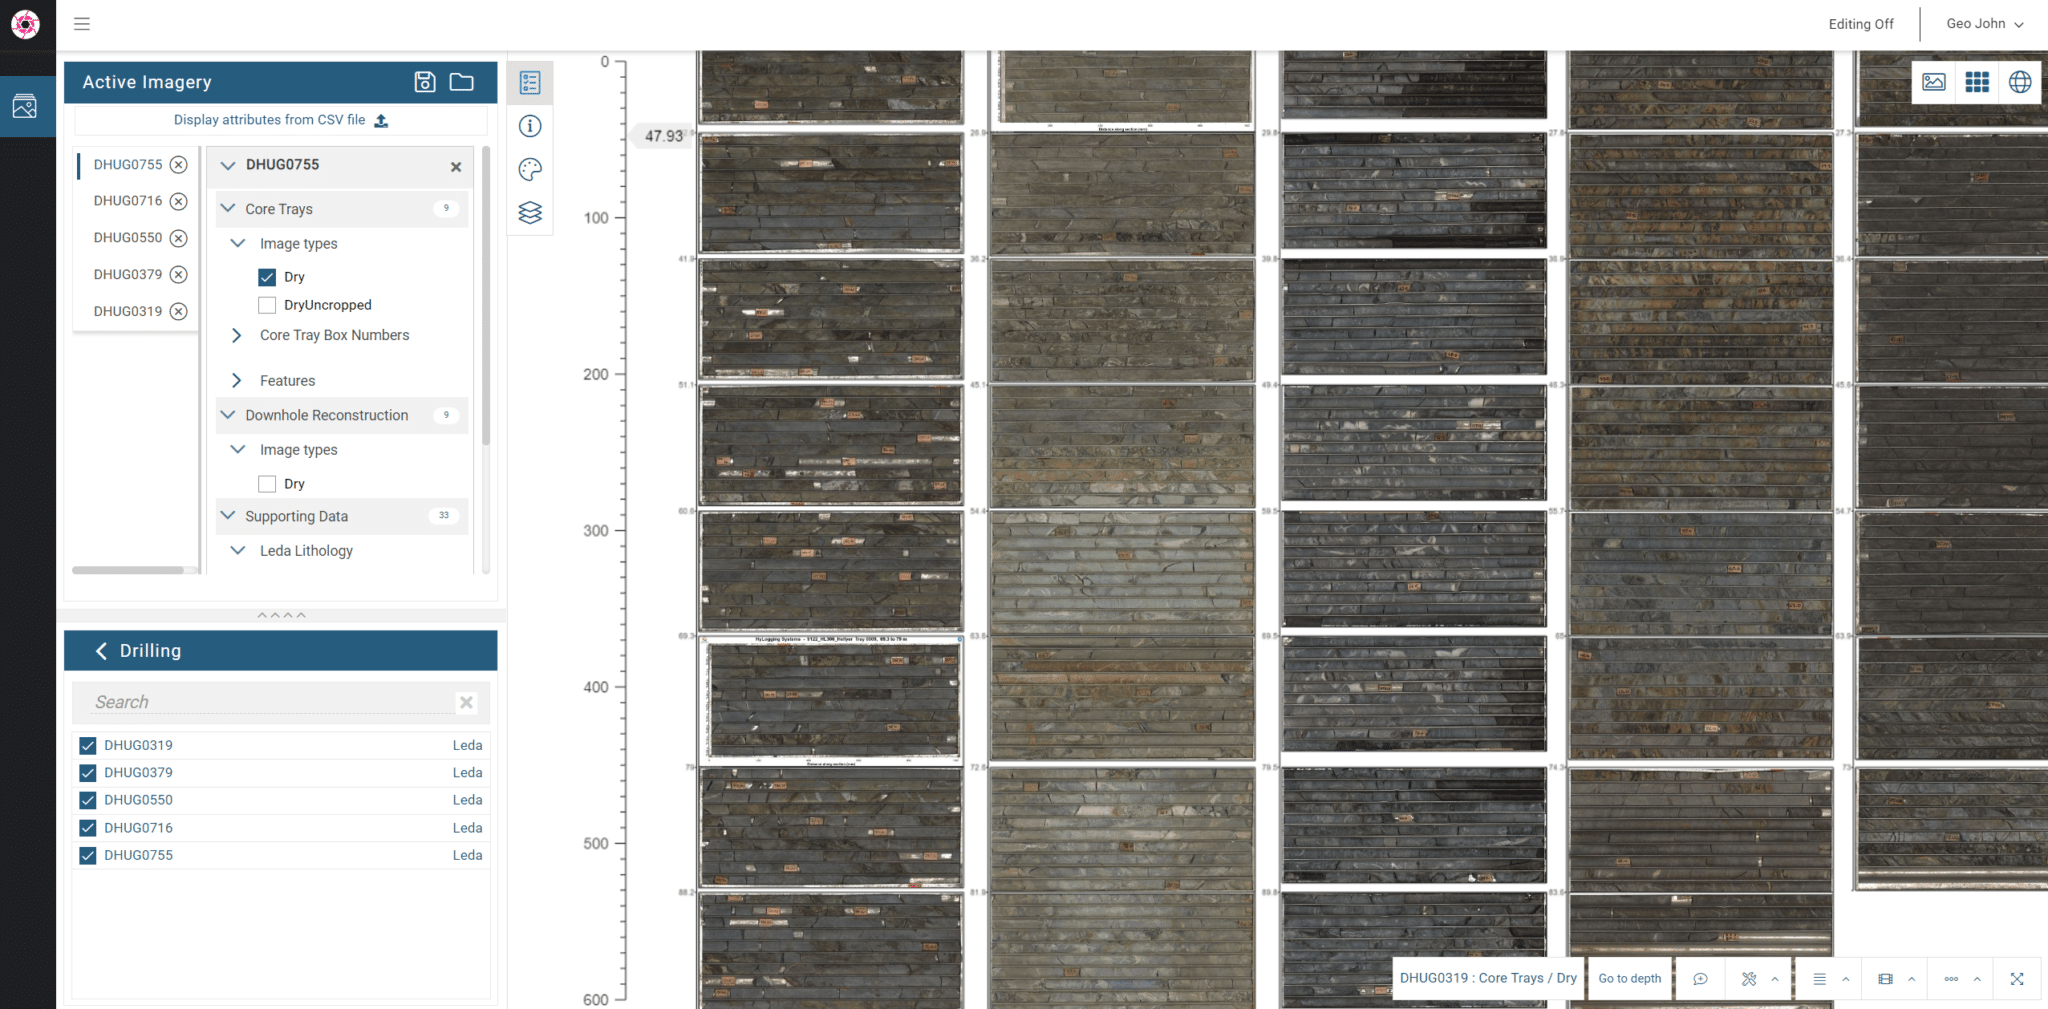
8. View multiple holes in a single view. This example displays core tray images.
9. Update your assays and rock codes using Imago Connect. Display along side your drilling core and chip images.
Using the data navigation and display tools
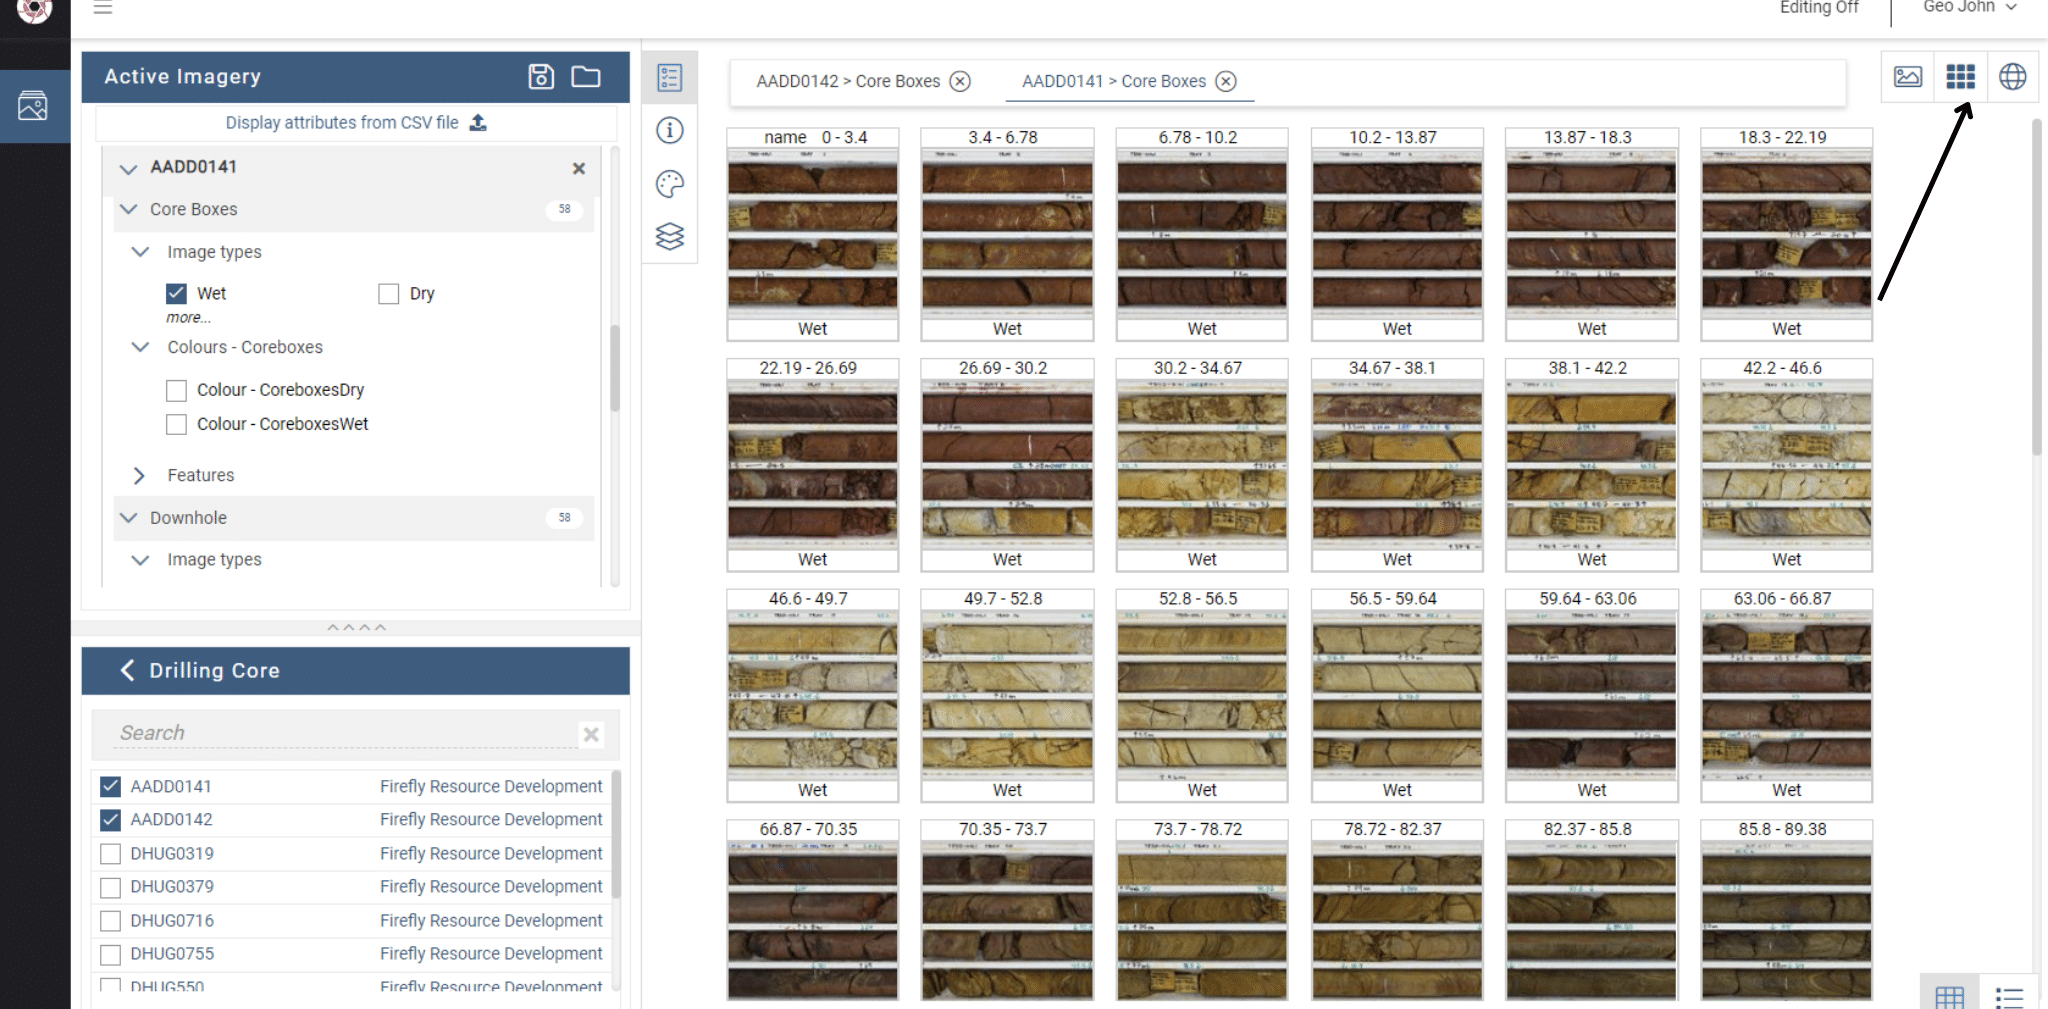
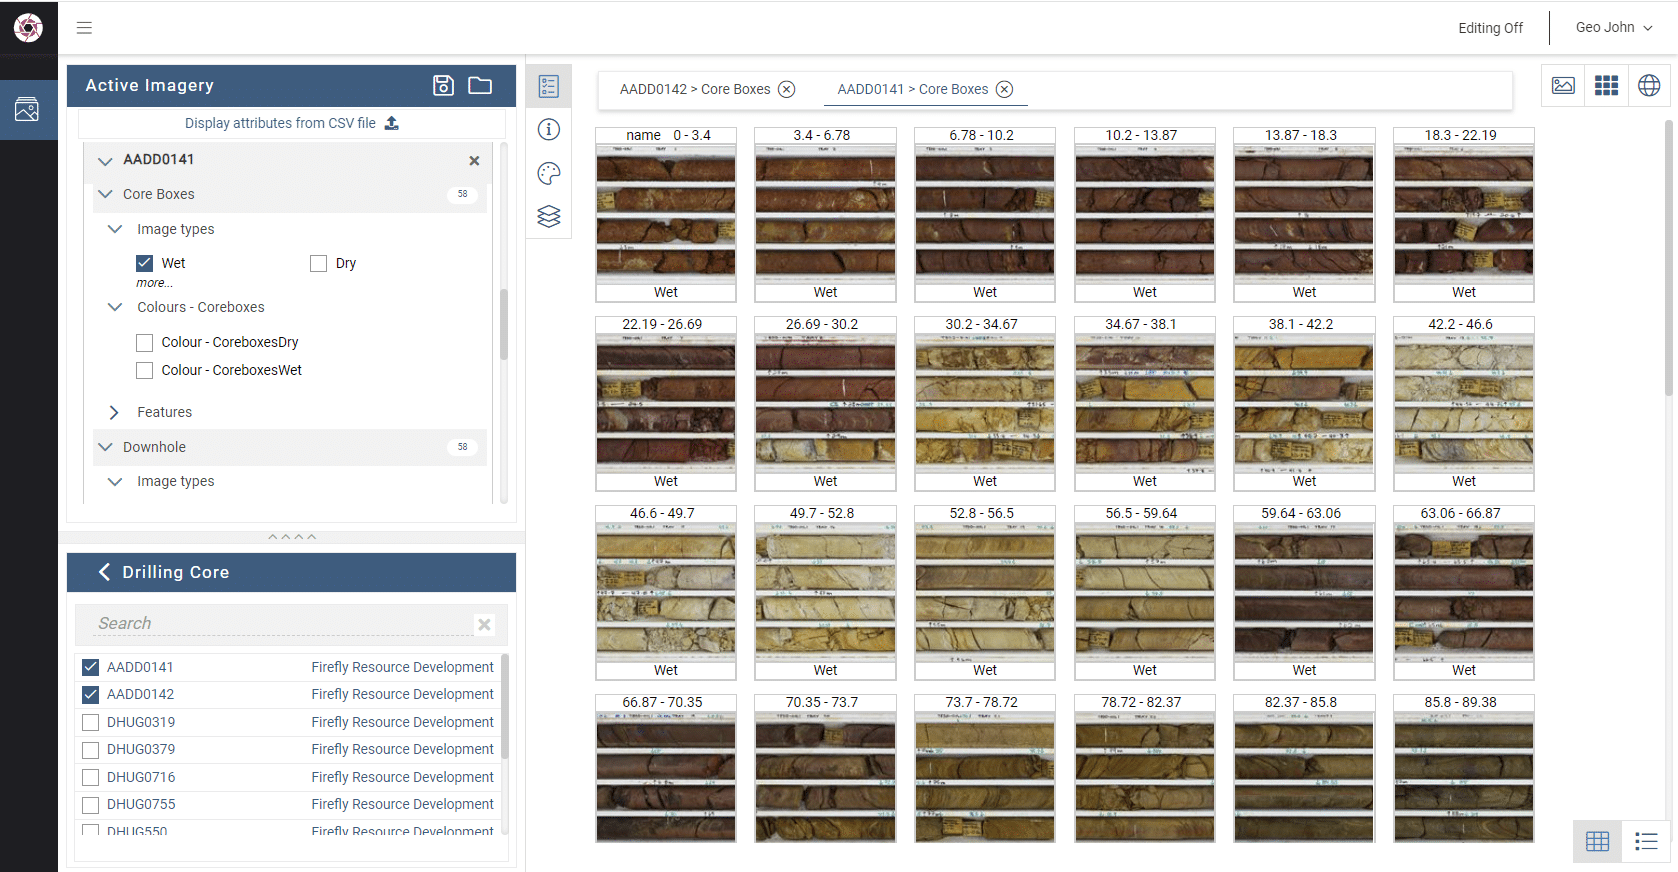
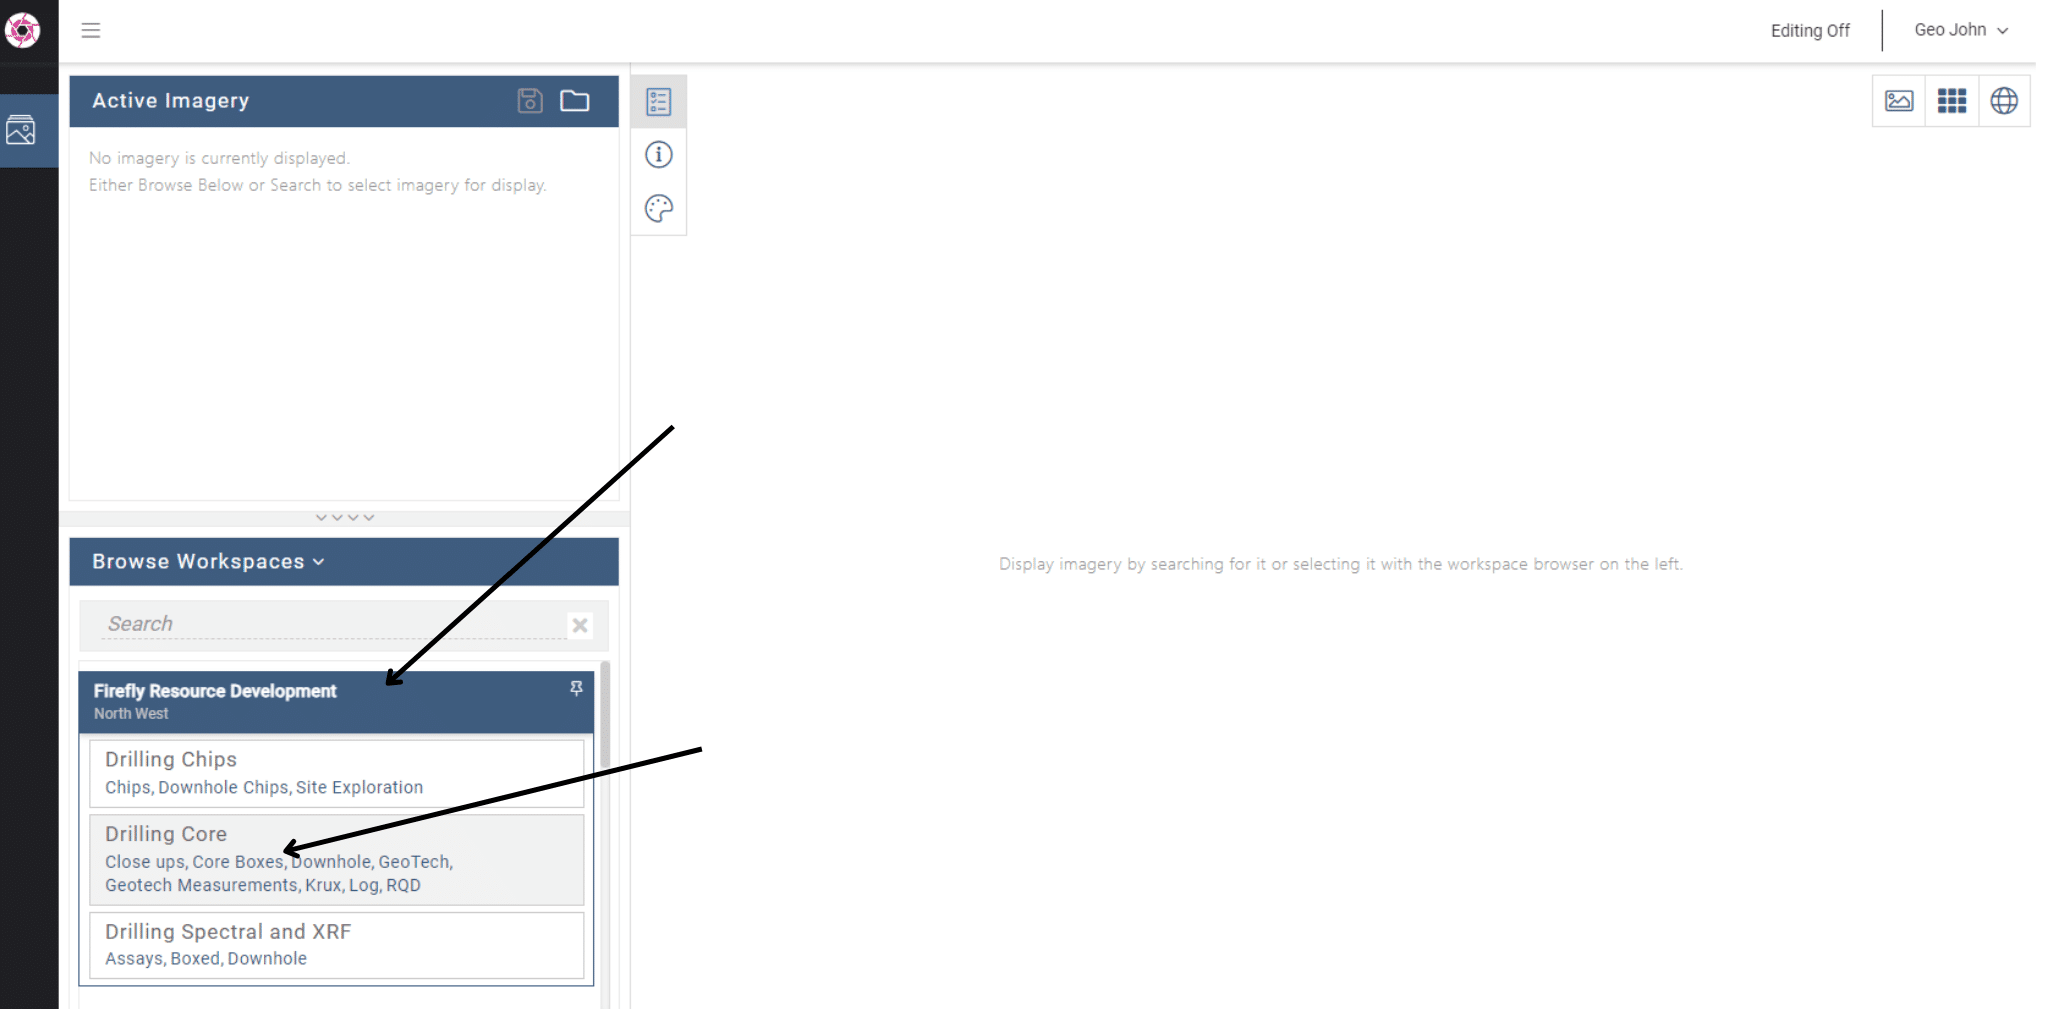
Using the navigation panel on the left, locate ‘Firefly Resource Development’ and click ‘Core Boxes’ in the ‘Drilling Core’ imagery type. This will display a list of drill-holes with Core Tray images available.
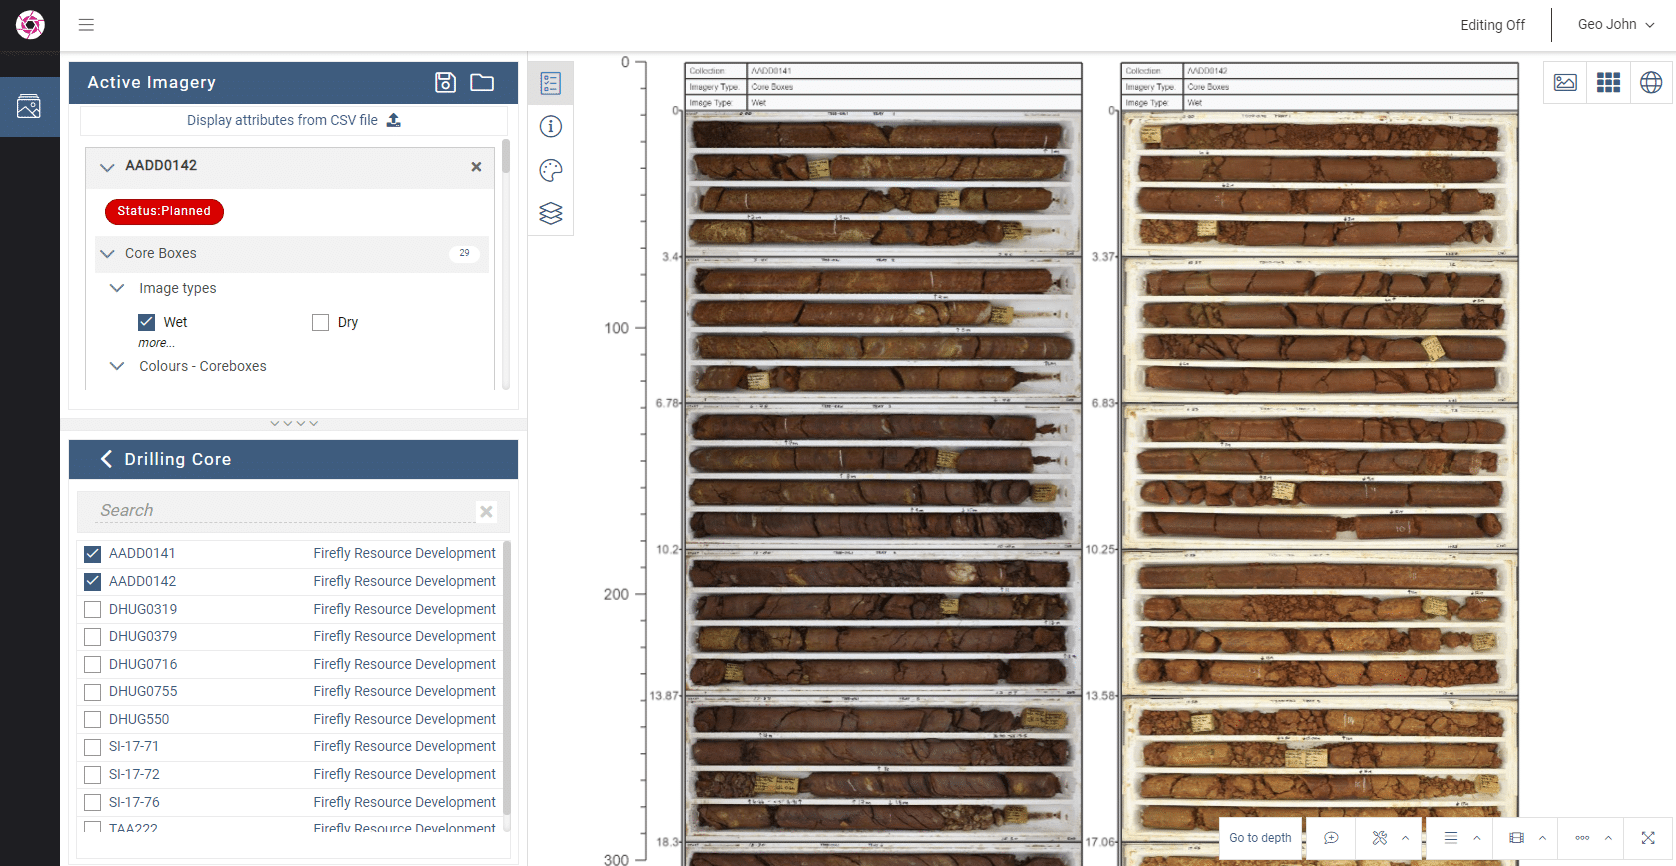
Tick the checkbox for AADD0141 and for AADD0142.The core box images for those drill-holes will display.
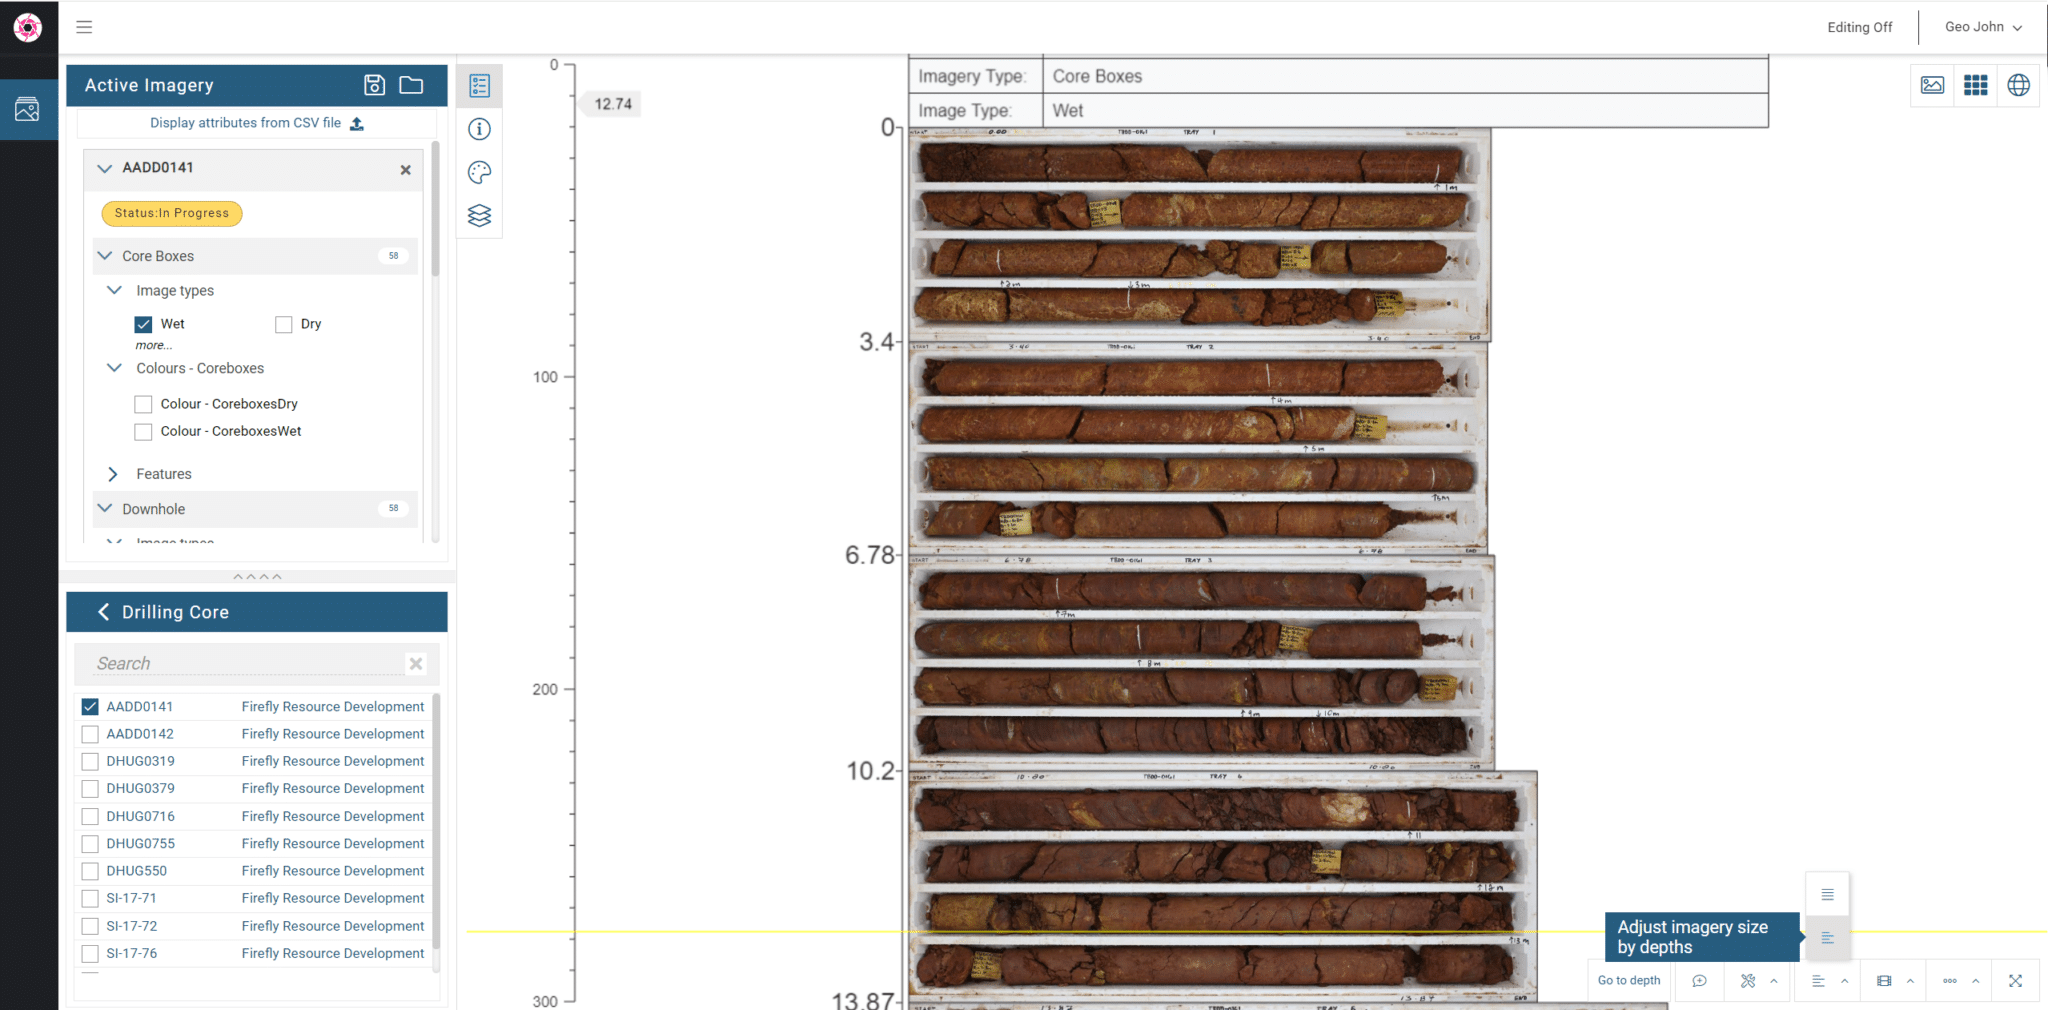
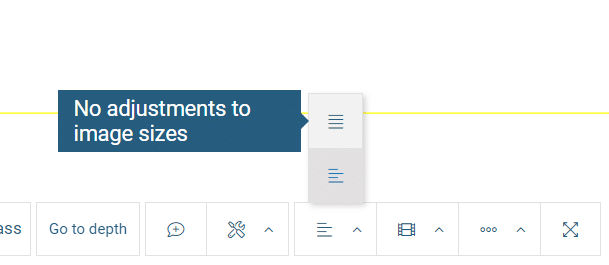
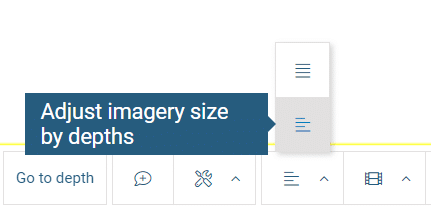
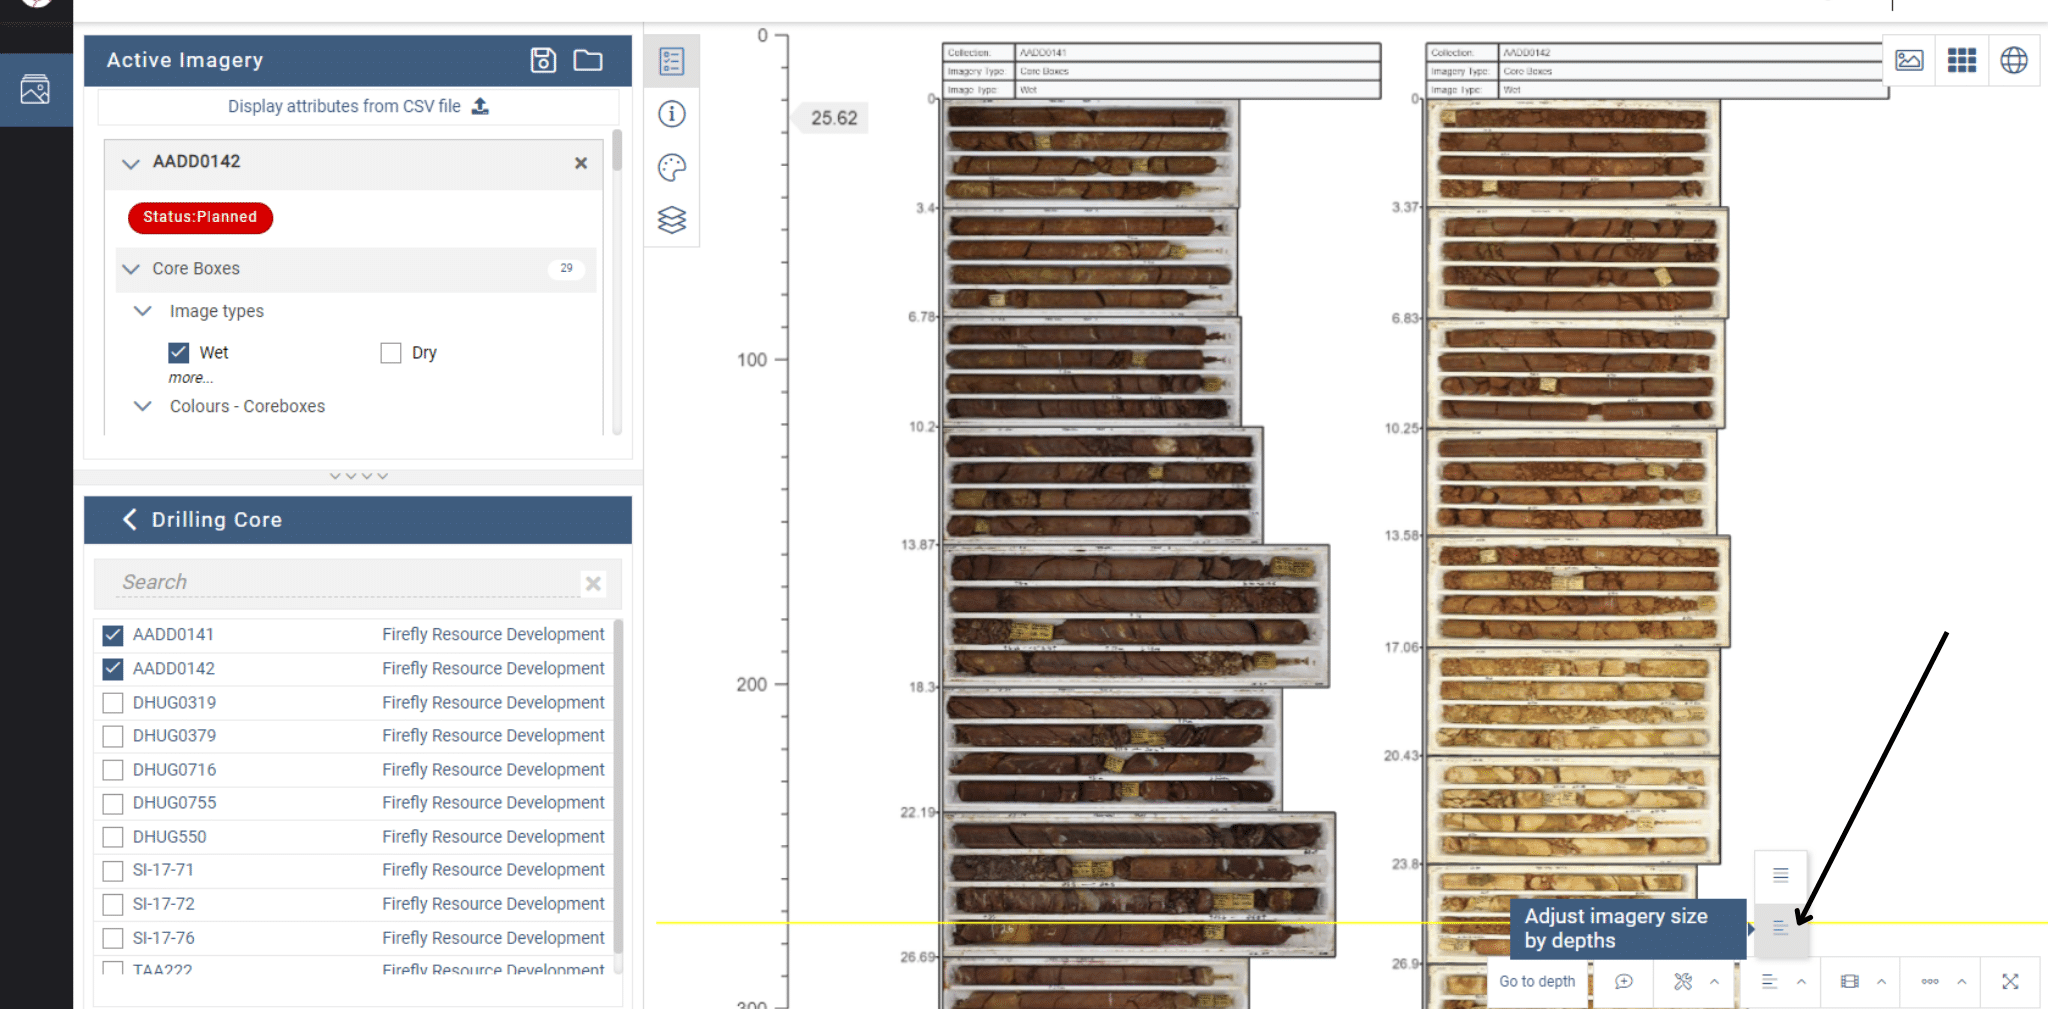
Often Core Trays represent different intervals. E.g. 1 to 5 metres vs 1 to 7 meters. To view the images to scale, down the drillhole trace, the images need to be resized in the display. Click the ‘Adjust Imagery size by depth’ button on the bottom right of the screen as shown. You will see the images resize to scale. Pan and Zoom to adjust the view. You can click the vertical depth ruler to snap to a desired depth.
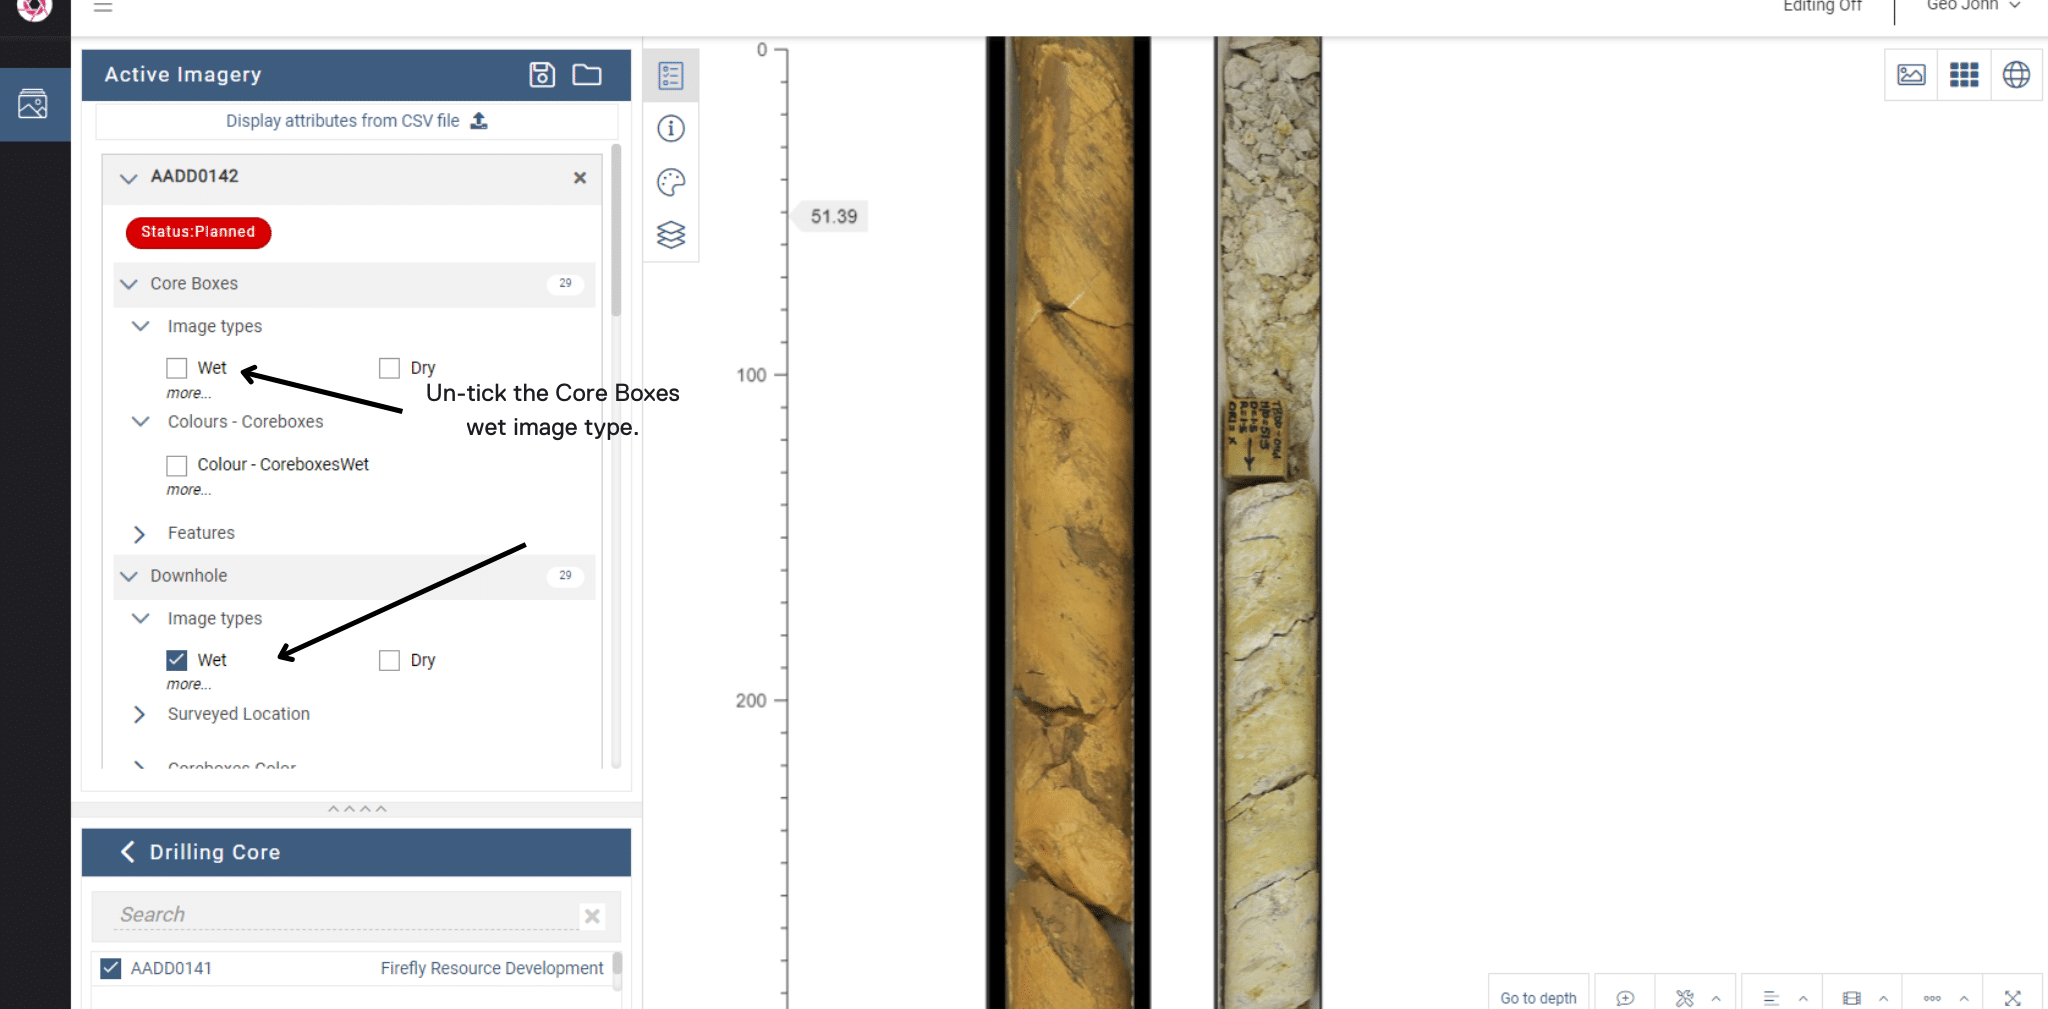
Next we may wish to view the images as downhole, linear images instead of the core trays. Unselect the checkboxes under the core trays imagery type, and select the checkboxes for Downhole. Usually the wet images will be the best to view.
Change back to viewing the core trays, then switch to the library view using the buttons at the top right.