


This guide will explain the objective of each report and provide some guidelines for interpreting the results.
Reports
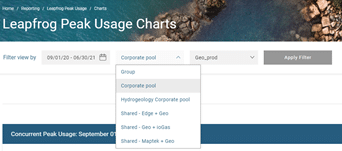
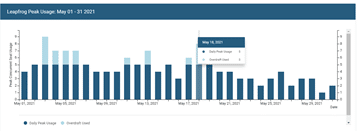
Concurrent Peak Seat Usage
The report provides peak concurrent usage data per day. We recommend that a single product and single group are selected. If multiple products and groups are selected the group total will be aggregated.
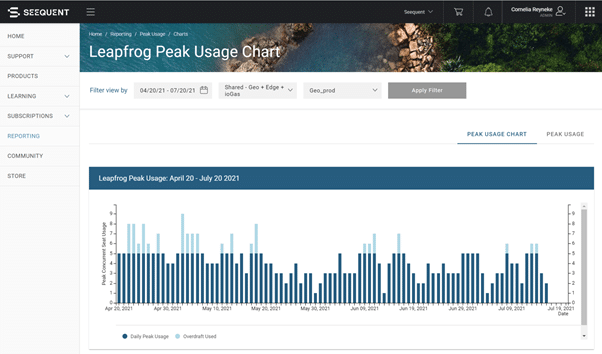
The table below documents how the results for this report are calculated:
| Field | Calculation Details |
| Peak Usage |
|
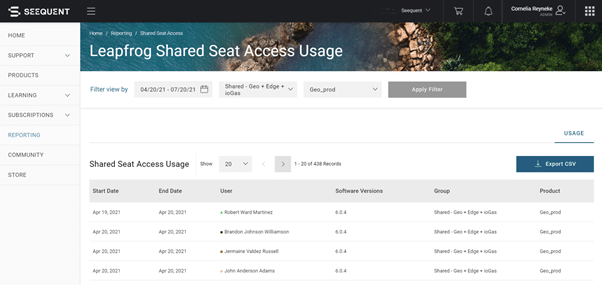
Shared Seat Access
The report provides details of user sessions for the period selected. The data can be exported as an Excel .csv file for further analysis. We recommend that a single product and single group are selected. If multiple products and groups are selected the usage will be listed as one line per product. For example, if a base product and an extension was checked out for the same period of time, the usage details will be displayed across two lines with the same start and end date.
There are no results calculated for this report. It consists only of sessions detail.
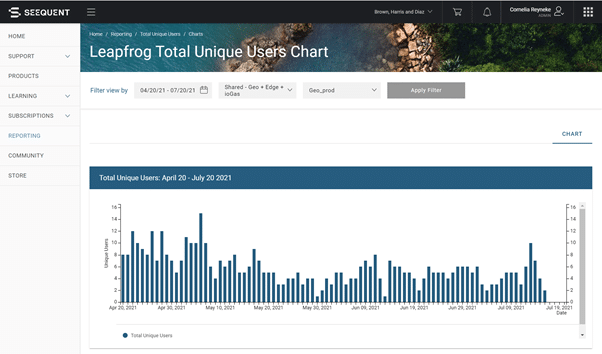
Total Unique Users
The report displays the total number of unique users, for a selected product, per day. On a flexible shared seat subscription, multiple users can access a limited number of shared seats, by checking a seat back in after a session. It is therefore possible to have a higher number of user sessions compared to the number of seats purchased.
The table below documents how the results for this report are calculated:
| Field | Calculation Details |
| Purchased Seats | “Purchased Seats” is a referenced quantity. Tthe seat capacity purchased as per the license agreement is simply looked up. |
| Unique Users | Unique Users is determined by counting how many unique individual user sessions took place during a 24-hour period |
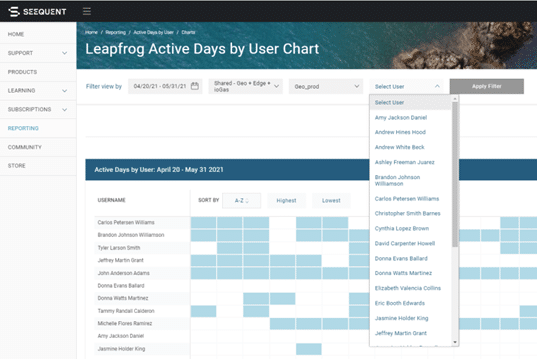
Active days by User
The reports shows whether a user was actively using the selected product during a day and therefore shows user behavior over a period. Some of the useful information you can gather from this report are:
- Users who use the product every day and can possibly benefit from a different subscription model.
- Identify users who use the product infrequently or only need access infrequently but at a larger cadence.
- Identify users who rarely use a seat and should be removed from the group.
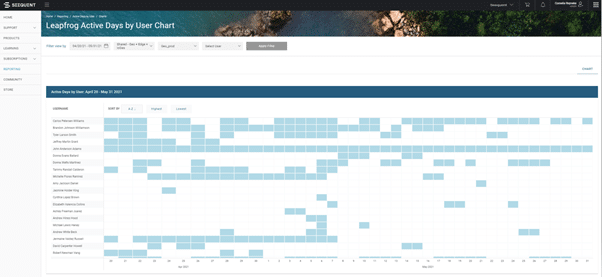
There is a helpful filter option where you can select a single user to analyse over a period.
The table below documents how the results for this report are calculated:
| Field | Calculation Details |
| Active Days | An “Active Day” is defined for a user, if they have a successful checkout for the selected product that falls within the start and end time for each day (UTC). |
Glossary
The following features are common to all the reports and function in the same way. A few more details on using each of these features can be found below:
Organisation Filter
You will be able to view organisations for whom you are the registered administration user. If you have access to more than one organisation you can select the value from the drop-down box.
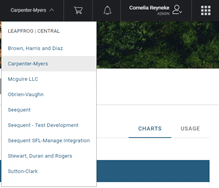
Group Filter
You will be able to view all the groups in your organisation. You can then select one entry from the list. Only a single group can be selected at a time. By selecting the ‘Group’ option all the available group results are aggregated. The group visualisation is considered the default visualisation.
Apply Filter
At any time, you change your selection, the data will only be refreshed once the ‘Apply Filter’ button are applied. You know that your selection is presented when the ‘Apply Filter’ button is grey.
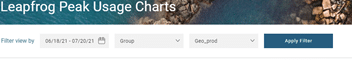
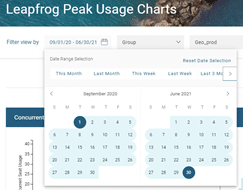
Date Picker
To select a date range either select your start and end dates using the calendar pop up which is accessed when clicking on the date box, or by making use of the easy default time periods.
The date is set up in the standard format of “dd-mm-yyyy”
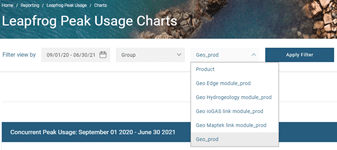
Product Type Filter
You will be able to view all the products that are available in the selected group. Select an entry from the list. Only a single product can be selected at a time. By selecting the ‘Product’ option usage for all the available products are aggregated. The product visualisation is considered the default visualisation.
Tool Tip
Tool tips are available on all report data and are especially useful when generating a report with many data points. They are context sensitive and can be accessed by hovering over a particular data point or bar. This will cause the tool tip to pop up and provide the relevant info for selected data point.
Date and time guidelines
Please note that all date and time information is calibrated to UTC (Universal Time Coordinated) and is not transformed or visualised in any different time zones.
When selecting a date range for a report, all activity occurring between 0:00 and 23:59 (UTC), inclusive, are included in summary statistics unless otherwise stated.
Frequently Asked Questions
Can the number of unique users be higher than the number of seats available?
Yes, on a flexible shared seat subscription, multiple users can access a limited number of shared seats, by checking a seat back in after a session. It is therefore possible to have a higher number of user sessions compared to the number of seats purchased.
My organisation has more than one shared group. Can I view usage for more than one group?
You will be able to view usage for all the groups in your organisation. You can select one entry from the group list. Only a single group can be selected at a time.
I need to find out if my extensions are being used?
You will be able to view all the products that is available in the selected group. Select an entry from the list. Only a single product can be selected at a time.
I have team members in different countries, are the session detail displayed in the user’s time zone?
All date and time information are calibrated to UTC (Universal Time Coordinated) and is not transformed or visualised in any different time zones. When selecting a date range for a report, all activity occurring between 0:00 and 23:59 (UTC), inclusive, are included in summary statistics unless otherwise stated.
The report is not displaying any information, did I do something wrong?
At any time, if you need to make or change your filter selection, the date that you want to review needs to be specified first. You can then select the group and product. The data will only be refreshed once the Apply Filter button are applied. You know that your selection is presented when the button is grey.
Are the tool tips available on all reports?
Tool tips are available on all report data except for the Shared Seat session detail. They are especially useful when generating a report with many data points. They are context sensitive and can be accessed by hovering over a particular data point or bar. This will cause the tool tip to pop up and provide the relevant info for selected data point.
Can I export my users’ session data for further analyses?
Yes, the data can be exported as an Excel .csv file for further analysis by using the Export CSV button that is available in the report.
I see two lines for my user displayed in the session detail, one for Geo and one for Edge. Is the usage duplicated?
When multiple products and groups are selected the usage will be listed as one line per product. For example, if an extension seat was checked out for the same period of time as a base product, the usage details will be displayed across two lines, with the same start and end date.