


The Project
SolGold plc (SolGold) is a leading exploration company focused on the discovery, definition and development of world class copper-gold deposits. In 2018, SolGold’s management team was recognised by the “Mines and Money” Forum as an example of excellence in the industry and continues to strive to deliver objectives efficiently and in the interests of shareholders. SolGold is the largest and most active concession holder in Ecuador and is aggressively exploring the length and breadth of this highly prospective and gold-rich section of the Andean Copper Belt. SolGold holds an 85% registered, and beneficial interest in ENSA. The Cascabel license is 100% owned by ENSA. SolGold is listed on the Toronto Stock Exchange (TSX) and the London Stock Exchange (LSE).
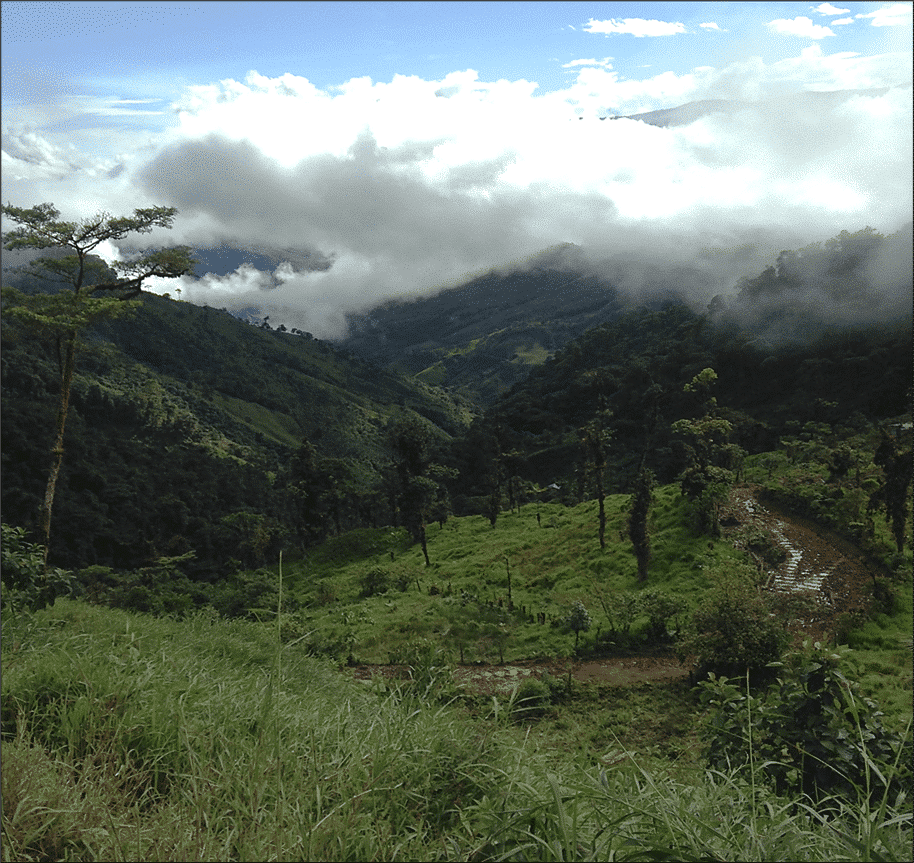
The Cascabel Property is located within the Imbabura province of northern Ecuador, approximately 100 km north of the capital Quito and 50 km north-northwest of the provincial capital, Ibarra.
The site team is continuously engaged in advancing the understanding of the porphyry systems at Cascabel and a combination of Seequent solutions, Leapfrog Geo, Leapfrog Edge and Seequent Central are in use. A key component has been Leapfrog Edge, the resource estimation extension to Leapfrog Geo. Edge links directly and dynamically with the Leapfrog Geo project which means it can be rapidly updated with new information, enabling the team to produce live resource estimates. Using Seequent Central for model management also means that projects are shared. This single source of truth allows the Head Office in Brisbane and the team on the ground in Ecuador to collaborate in real time.
The integration of Leapfrog Edge estimation software with Leapfrog Geo has allowed close to full automation of the company’s internal resource estimation checks. In a nutshell, Leapfrog Edge gives us the power to run our own internal resource estimates which empowers us to be able to internally audit the work performed by independent consultants and ensure they are being realistic. It also gives us the advantage of having a good idea of the potential outcomes of a given resource estimate which in turn helps the Company gauge appropriate expectations.
Benn Whistler, Technical Services Manager, SolGold PLC, Brisbane
Response
Leapfrog Geo 3D model
SolGold used Leapfrog Geo to undertake the 3D geological modelling of the Alpala Deposit. This work was based on:
- Hand-drawn cross sectional and level plan interpretations.
- Lithological modelling of intrusive phases and host rocks, as well as stratigraphic modelling of volcanic host rocks.
- Vein abundance modelling of “B-type” quartz veins.
- Mineralisation models for copper and gold at high, medium and low grade guidance envelopes.
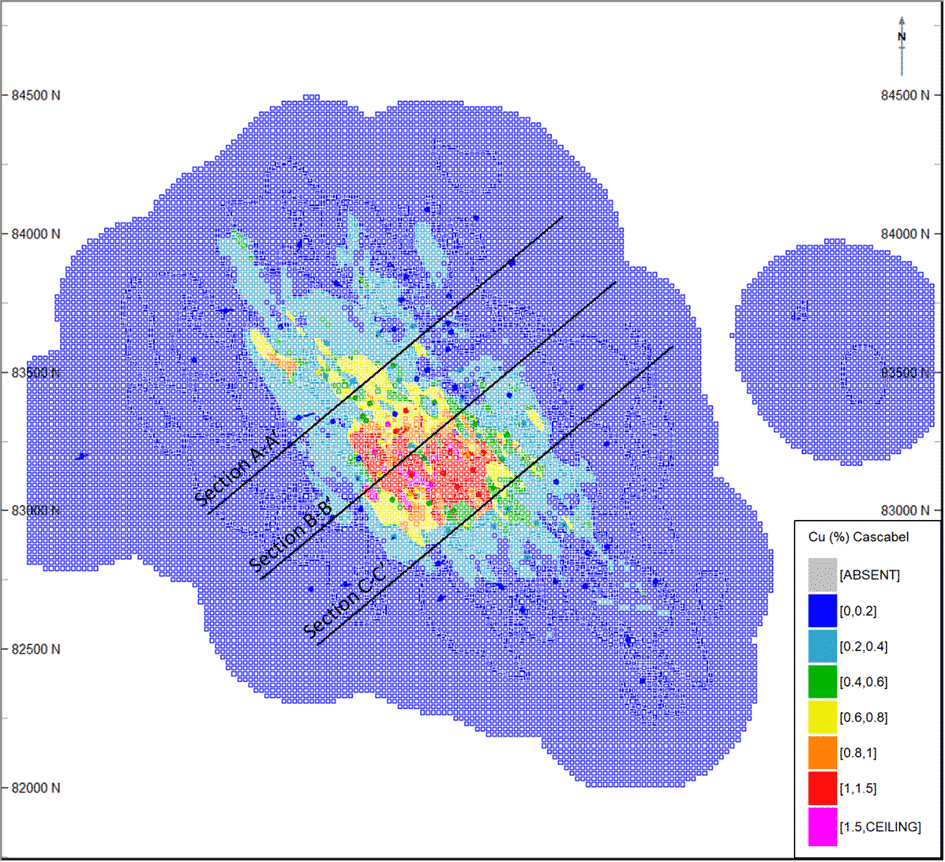
Hand drawn cross-section and level plan interpretation: The geometrical understanding of the deposit and its internal timing relationships between rock phases, veins, and Cu-Au grades was advanced by completion of hand drawn cross-sections and level-plans for each dataset throughout the deposit (Figure 7 40). Hand-drawn cross-section interpretations of geology and B-vein abundance was performed at approximately 70 m (70.711m) spacings across the deposit, with a window of approximately 35 m (±35.356m) from section 82,650N to section 83,450N, and are orientated northeast and centred upon a northwest trending baseline.
Hand-drawn level-plan interpretations of geology and B-vein abundance was performed at 200 m levels throughout the deposit, with a window of ±100 m from surface to -300 mRL.
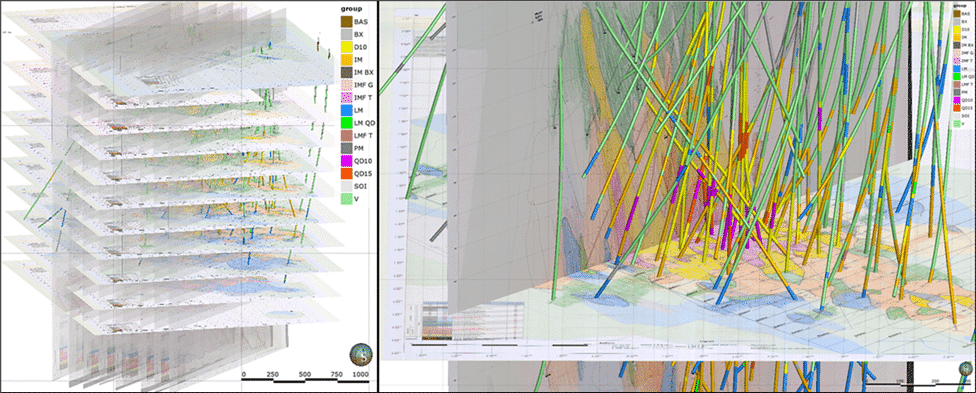
The geological modelling of rock groups was completed within the 3D software program Leapfrog Geo, which forms the foundation of the vein and grade modelling in the Mineral Resource estimation, and compares well with hand-drawn level plans and sections.
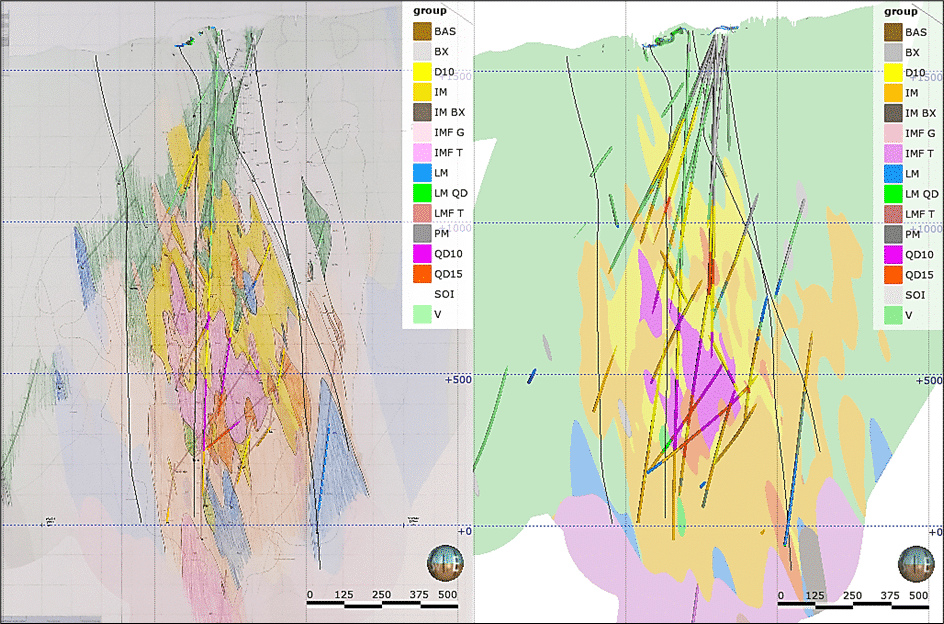
Lithology model
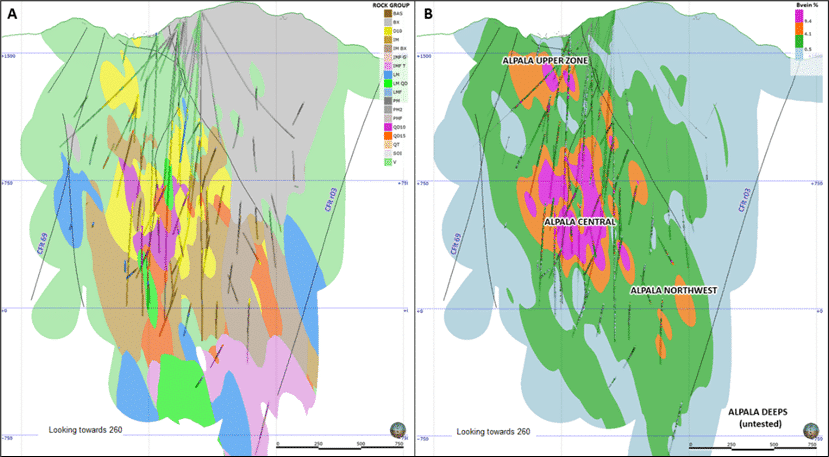
The major rock types of the Cascabel tenement consist of Cretaceous siltstones and minor sandstones which are unconformably overlain by a Tertiary sequence of andesitic lavas and volcano-sedimentary rocks. A series of hornblende-bearing diorites, quartz diorites and tonalities intruded the volcano-sedimentary sequence as plutons, stocks and dykes.
Drilling has defined a northwest trending, steeply northeast dipping corridor known as the Greater Alpala Trend. This trend is centred upon a syn-mineralisation causal quartz-diorite intrusion (QD10) cut by a series of intra-mineralisation, late-mineralisation, and post-mineralisation stocks, dykes and breccias of diorite, hornblende diorite, quartz diorite, tonalite and granodiorite. Intrusions have been emplaced episodically such that each subsequent intrusion has introduced mineralising fluids (notably as porphyry-type quartz and quartz-sulphide veins) into the Alpala system, and/or remobilised existing mineralisation or contributed to localised overprinting and destruction of the pre-existing mineralisation.
Intrusions are typically emplaced with a stock-like geometry that is moderately elongate in a northwest direction. Intrusions often hold typically vertically and laterally extensive northwest trending, steeply dipping dyke extensions beyond their stock margins.
Due to the multi-episodic nature of the complex, several dykes appear rootless or ‘hanging’ in section view, however, these are seen to connect to the main stock or stocks in three dimensions, or have been intruded and truncated by younger stocks.
The geometry of the various lithologies and intrusive bodies at Alpala is now well understood and has been modelled from the completed drilling, demonstrating extensive sub-vertical continuity and highly complex intrusive relationships.
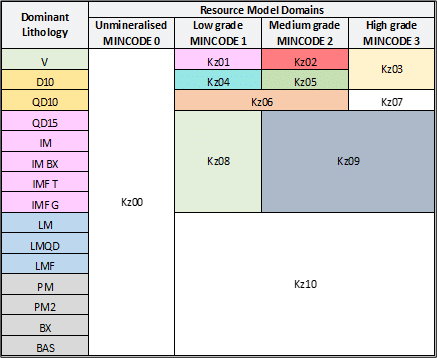
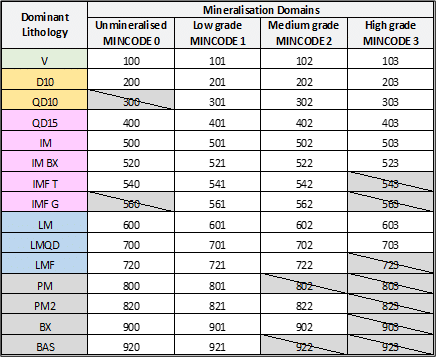
The application of the Anaconda method to geological mapping and drill core logging has identified a total of 31 likely intrusion phases. These intrusions have been grouped into 18 major rock groups which have been delineated based on their mineralisation phase and resource group. All the major rock groups have been incorporated into the three-dimensional geological models created of the Alpala Deposit.
A total of 20 major phases of mineralisation have been delineated on composition, relative timing relationships and porphyry related vein stages. These rock phases are simplified into 11 major rock groups for three-dimensional modelling of the deposit and form the major low-grade, medium-grade and high-grade stages of mineralisation at Alpala.
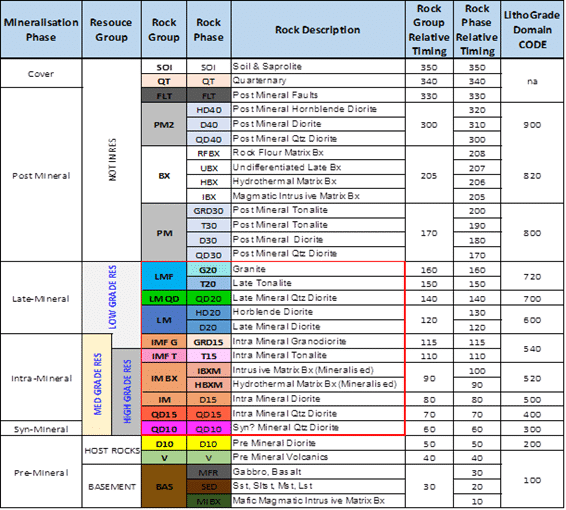
The majority of the Cu and Au mineralisation at Alpala was added to the system by the QD10 intrusion with supplementary additions through time with the injection of the intra-mineralisation QD15, IM, IM BX, IMF T intrusive phases, with only very minor metal addition from late-mineralisation and post-mineralisation intrusions as the system waned.
Vein abundance model
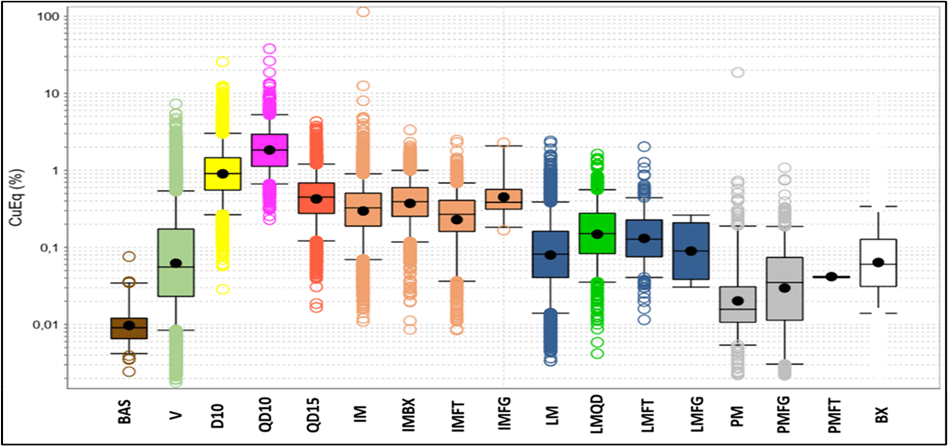
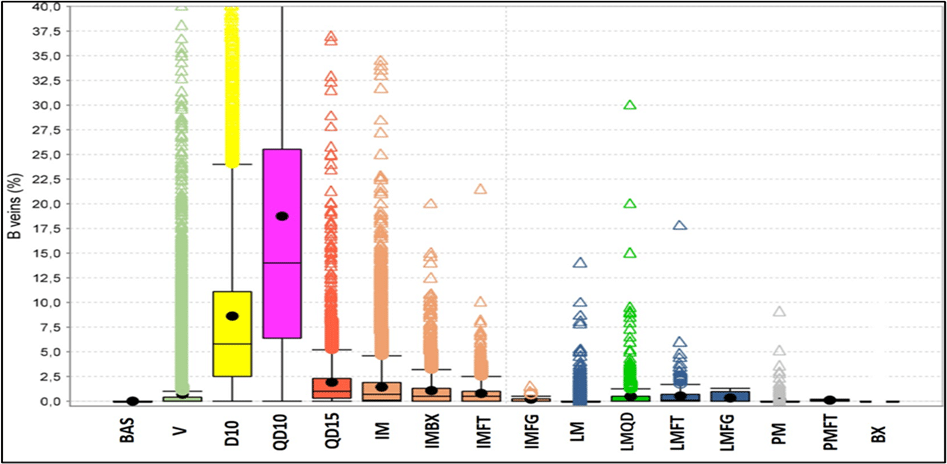
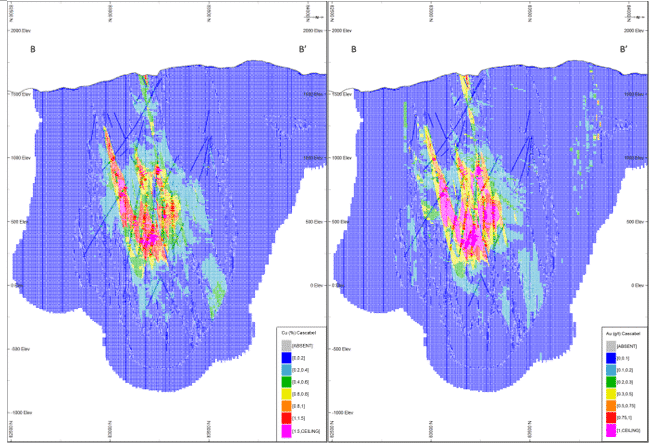
The relationship between B-type quartz vein (B-vein) abundance and Cu, Au and CuEq grades throughout the deposit show a linear relationship between grade and vein abundance, and has been defined with selected examples of 0.15% CuEq, 0.70% CuEq and 1.50% CuEq equating to 0.55% B-veins, 4.1% B-veins and 9.4% B-veins respectively.
The most important indicators of high-grade mineralisation include the presence of an early stage Quartz Diorite intrusion (QD10) containing all early stage porphyry style vein types with elevated vein abundance with an increased ratio of chalcopyrite to pyrite. These relationships are clearly evident when representing B-type quartz vein abundance and CuEq grades against each rock group in box and whisker plots.
Mineralisation model
Mineralisation at Alpala took place intermittently over approximately 800,000 years. Garwin et al. (2017) produced an accurate duration of the Alpala porphyry system of 800,000 years +/- 800,000 years at the 95th percentile confidence interval (2-sigma), which represents the difference in age from the early-mineralisation QD10 quartz diorite (39.4 ±0.6 Ma, SHRIMP U-Pb) to the emplacement of the late-mineralisation QD20 (38. 7 +0.6 Ma, SHRIMP U-Pb) and formation of molybdenite in a D-type porphyry vein hosted within late-mineralisation D20 diorite (38.6 ±0.2 Ma, Re-Os).
Each of the 11 rock groups recognized (from QD10 to BX) sequentially added its own stage of porphyry-related veining and mineralisation to the Alpala Intrusive Complex and hence have been modelled sequentially, with later phases excising pre-existing phases. Interpretations of the deposit are built episodically by utilising Rock Group Relative Timing in the same manner that each subsequent intrusion has introduced mineralising fluids into the Alpala system, and/or remobilised existing mineralisation, or contributed to localised overprinting and destruction of the pre-existing mineralisation.
The key point in understanding the Alpala Deposit relates to the manner in which the geometric framework of various lithologies and intrusive bodies subsequently controlled the successive geometries and zonation of the porphyry-style quartz vein abundance at Alpala, which in turn correlates exceedingly well with distribution of Cu and Au.
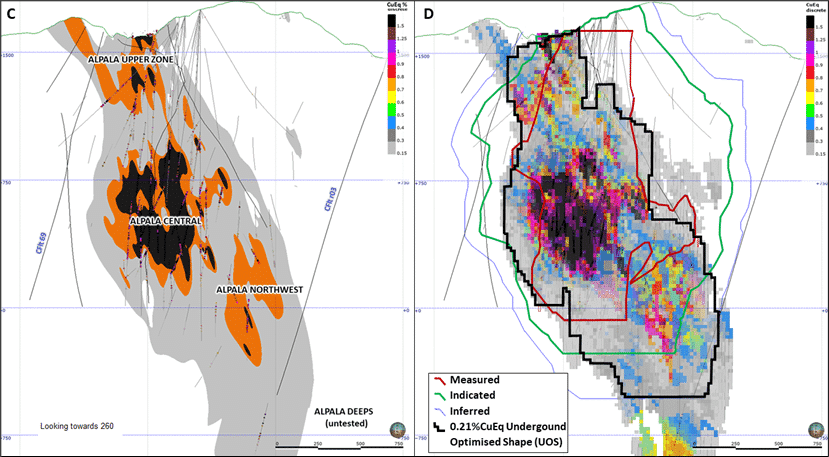
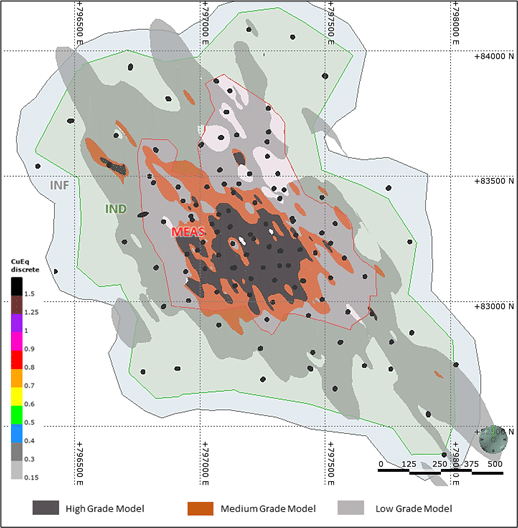
Estimation domains have been defined by combining the modelled features in a manner which demonstrates the relationship between grade and the geological history of the deposit. These domains are be determined based on geologic knowledge and supported by statistical analysis. Estimates are improved by geological constraints that can be confidently correlated between drill holes. The definition of estimation domains that are geologically and statistically self-similar is referred to as the definition of stationary zones within the deposit, or stationarity.
Outcome
Leapfrog Edge and Seequent Central
Leapfrog Edge, Seequent’s resource estimation solution, has enabled the team to combine modelling and resource estimation into one workflow. This is particularly useful in situations like this where updates are regularly required. Changes made to the model, such as with new interpretations or with the addition of new data, flow through to the resource estimate, saving huge amounts of work. Presented in streamlined, easy to follow workflows, Edge includes the standard tools for estimation – Domaining, Geostatistical Evaluation, Estimation and Reporting while applying the highly dynamic, intuitive and visual capabilities that have made Leapfrog Geo the leader in geological modelling. Seequent’s Senior Project Geologist Stephen Law who provided Project Assistance to the Brisbane based Head Office comments:
We first set up the Edge model in Sept 2018, both the Edge and Leapfrog Geo models are held within Central. It’s quite a simple Central set up, with basically two branches, one for the geology model with all of the geology models held within the one project and the timeline continues to progress as the geology is updated. This means they can return to an earlier model at any point in time. The other branch is a completely separate Block model project which again is very simple, as it is changed there is a new iteration on the branch. The solids from the geological model are linked via Central to the block model, so if there is a change to the geology model you just have to press reload and it automatically updates the Block model.
Geologists are able to simply publish an updated Leapfrog Geo project to Central then open the automated Estimation Leapfrog EDGE project and just right click on all the domain shells to upload the latest geology model from that branch. This will automatically run a live resource estimate for us. The remaining quality control required thereafter is to review the variographic analysis and estimation search parameters to finalise model validation and you have a quality outcome for internal reviews. Obviously If you’re a Mid-tier company that’s made a discovery, for example, then the quality and results of a MRE, especially the first one you announce to the market, is absolutely critical. So being able to have an early idea of MRE results is hugely beneficial.
Benn Whistler, Technical Services Manager SolGold PLC, Brisbane
The dynamic linking functionality of Leapfrog Geo to Leapfrog Edge provides a significant benefit in terms of the time taken to update a resource estimate. Combining with Seequent Central allows even further productivity and collaboration opportunities. This setup can be used from the preliminary economic assessment right through to (and during) production.
Seequent’s Senior Project Geologist, Stephen Law
A Mineral Resource Estimate (MRE) for the Alpala Porphyry Copper-Gold-Silver Deposit was released in December 2017 and a Preliminary Economic Assessment (PFS) based on the December 2017 MRE was completed in May 2019.
A Preliminary Feasibility Study is planned for release October 2020 and will be based on MRE#3 which delivered the conversion of considerable tonnages into the Measured Resource category, plus the addition of 1.6 Mt Cu, 2.5 Moz Au, and 92.2 Moz Ag (not previously estimated) to Measured plus Indicated Mineral Resources. Revised Metallurgical Recovery data , a more refined development and mining plan, and increased gold price assumptions will also be embodied in the forthcoming PFS.