


Leapfrog has useful tools to enable you to apply structural trends to your modelling. Applying a structural trend can be great in helping to reflect highly complex geological settings. This blog outlines the structural trends Leapfrog has, when to use them, and how to avoid problems, ensuring a better modelling performance.
Structural trends provide a method of stretching surfaces in different directions to reflect the underlying shape. They allow you more flexibility as you can control the ellipsoid ratio’s strength and direction in different points in space based on different trend directions. These can either be planar or curved which lets you create complex trends which can overlap each other.
Caveat
It is important at all times to be aware that calculations should be ran only after an appropriate setting of parameters, by applying context, geological judgment and experience. Surfaces created independently may intersect each other in geologically impossible situations, thus careful review and editing of all surfaces is recommended.
Defining the structural trend
Unlike a Global trend, where you define the ellipsoid ratios, the structural trend is based on a surface. The surface can be any shape or orientation, usually defined by geological constraints, such as faulting, or foliation etc. The surface is then effectively down-sampled to determine the local trend at each point on the mesh to give you an anisotropy that varies throughout the defined space. The structural trend does not determine the final surface; this is done by the interpolant and the data points used.
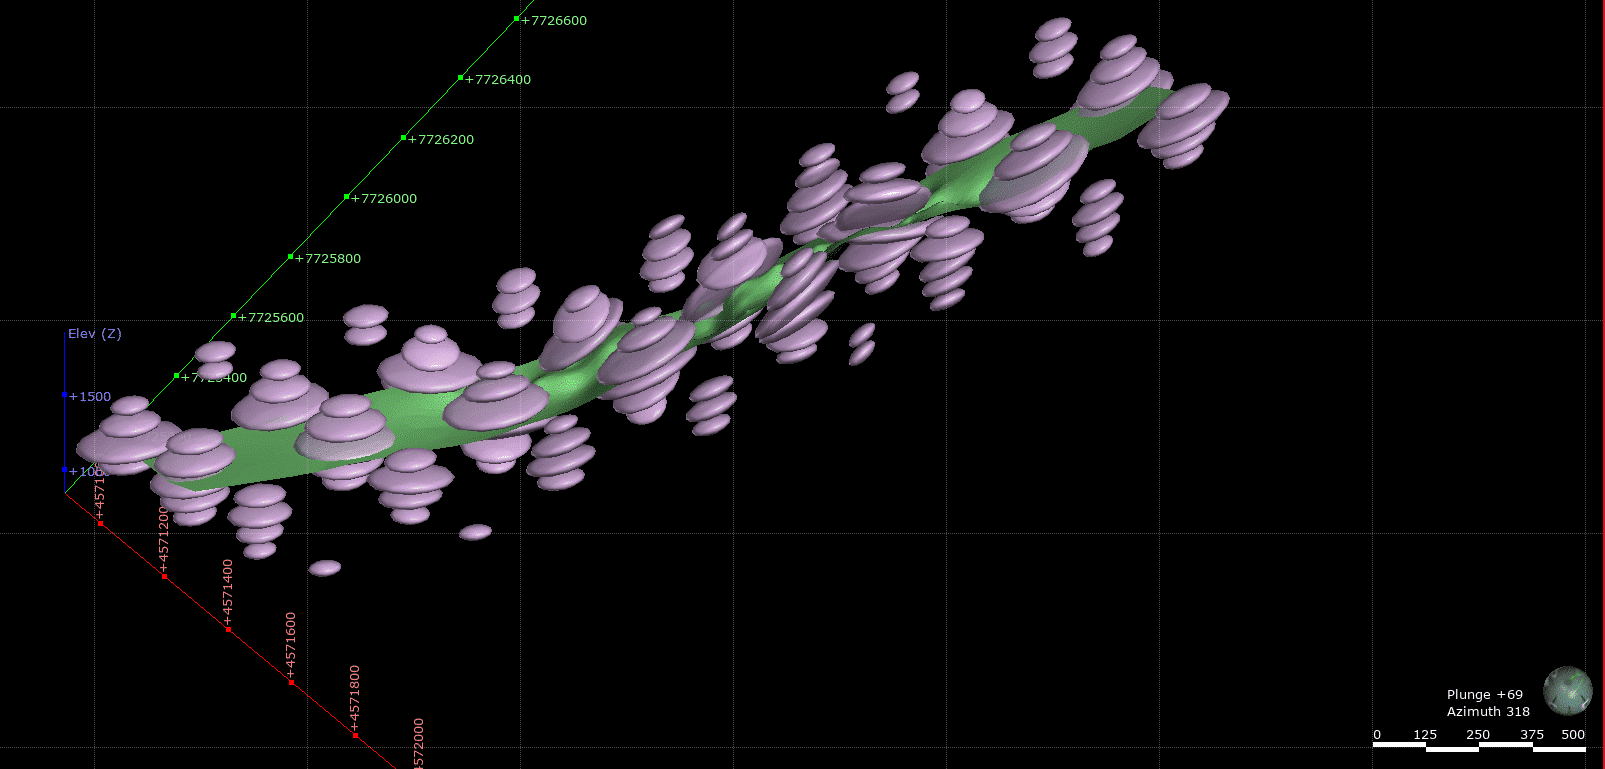
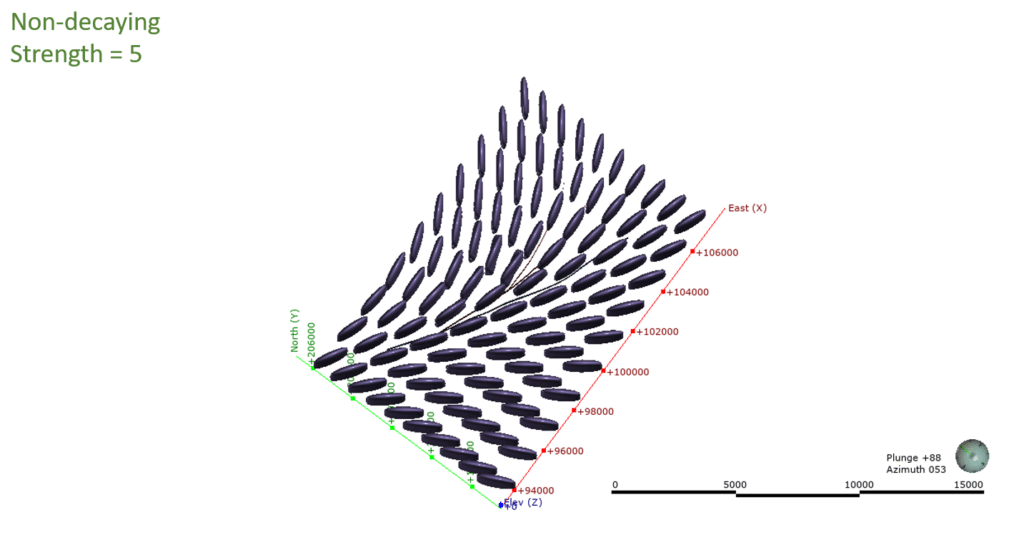
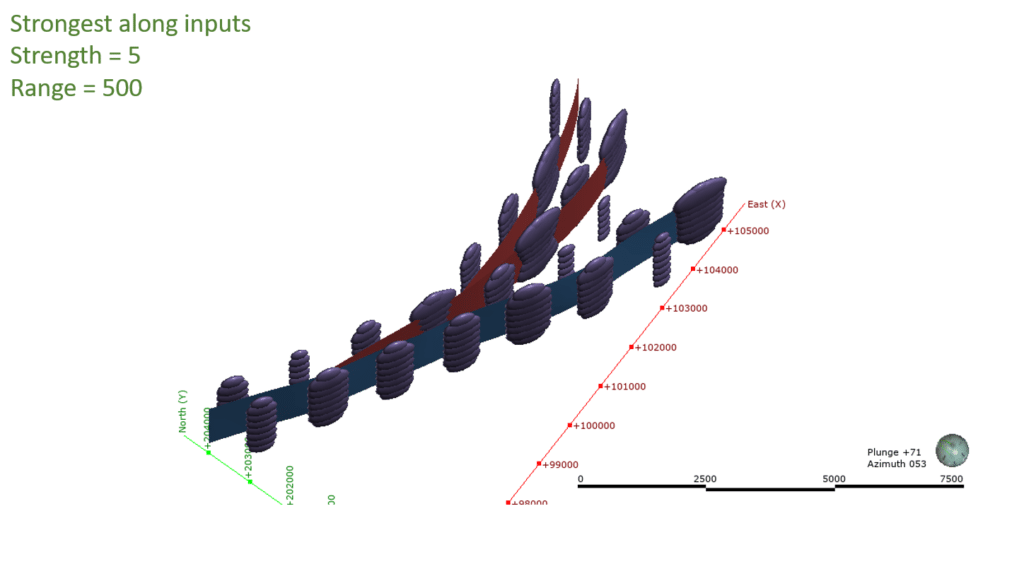
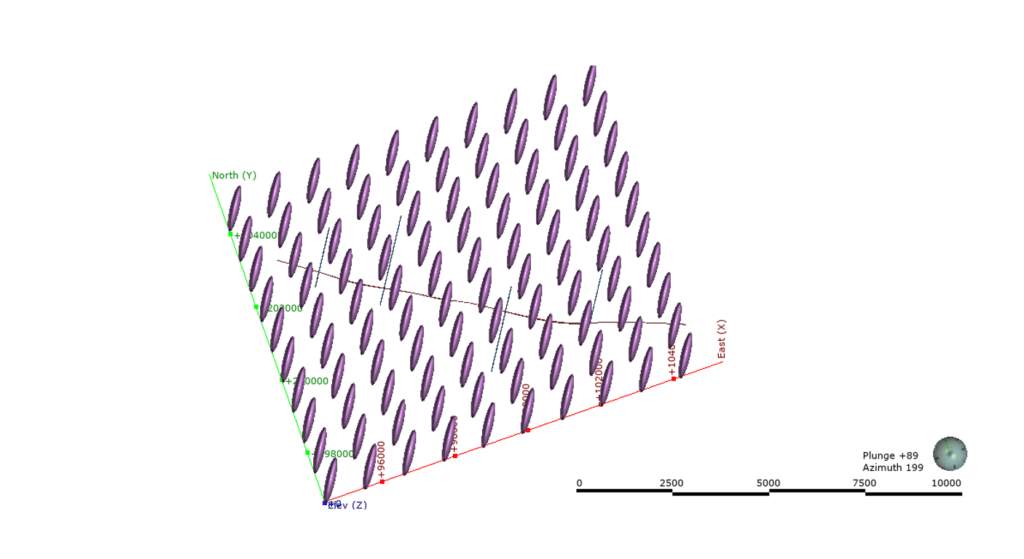
Leapfrog’s structural trends all behave slightly differently but have in common strength and range. The strength is similar to the ellipsoid ratio and dictates how much elongation or stretch you have in a certain direction. The range is the distance from the mesh in which the trend has effect. To visualise the trend more easily, discs are displayed along the mesh, the size and shape of these discs represents the strength and orientation of the trend, from circular to cigar shapes depending on the type of trend used.
Building a structural trend
Structural trends can, in theory, be built using any number of meshes. They can be imported in or created using almost any combination of data types including polylines, points, GIS lines and structural observations etc. However, caution needs to be exercised, the user needs to be observant of the reasonableness of the shapes created. This important checking stage will ensure Leapfrog performs at an optimum when producing your structural trend and associated models.
Types of Structural trends and when to use them
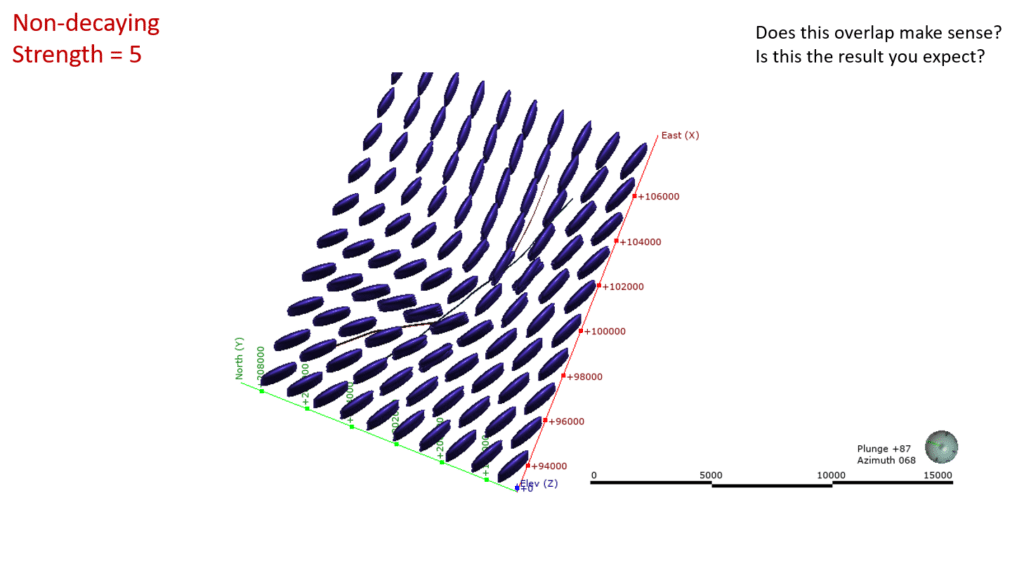
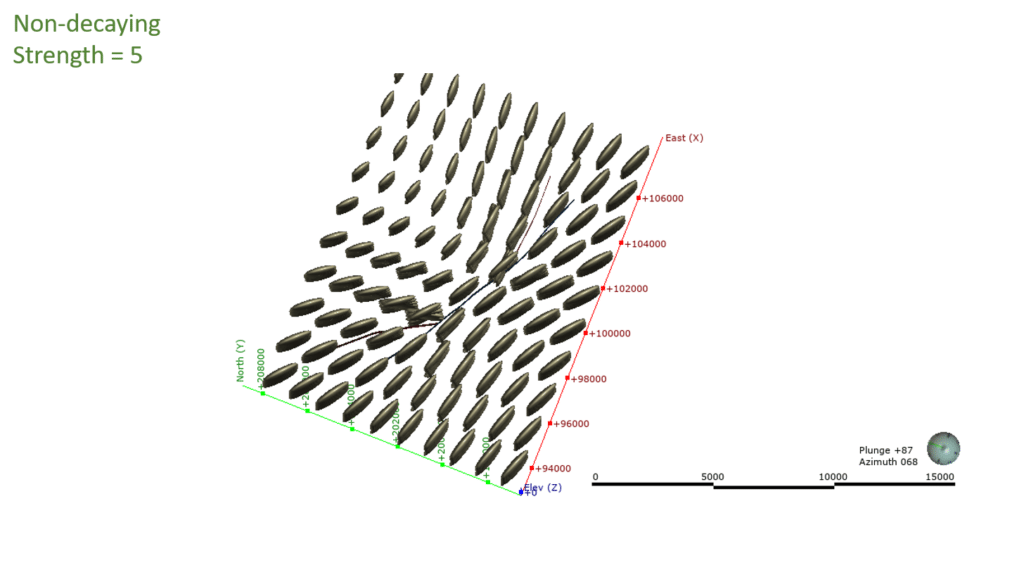
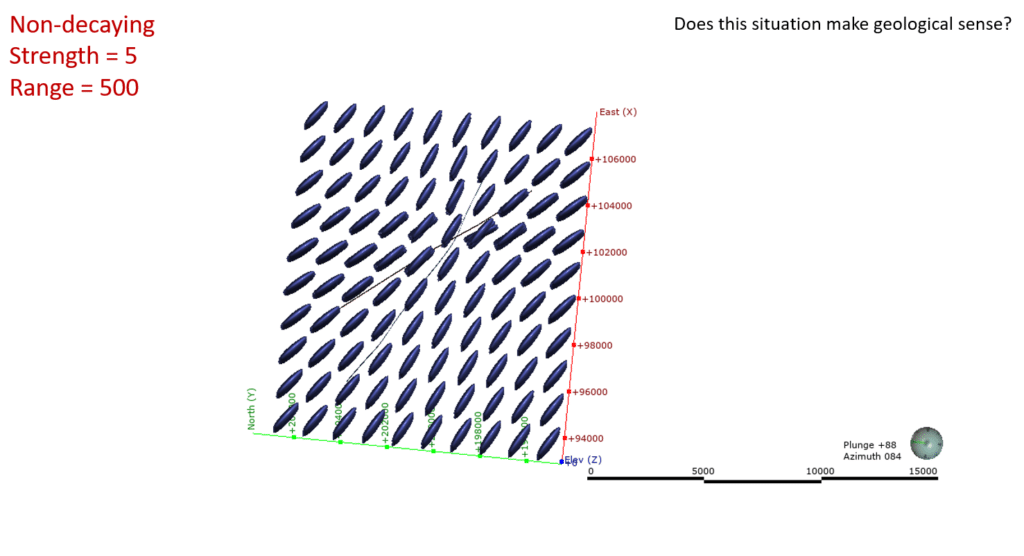
| Non-decaying | Assumes the strength of the trend doesn’t decay from the mesh. This is useful for defining a more or less constant trend that has influence across your model. |
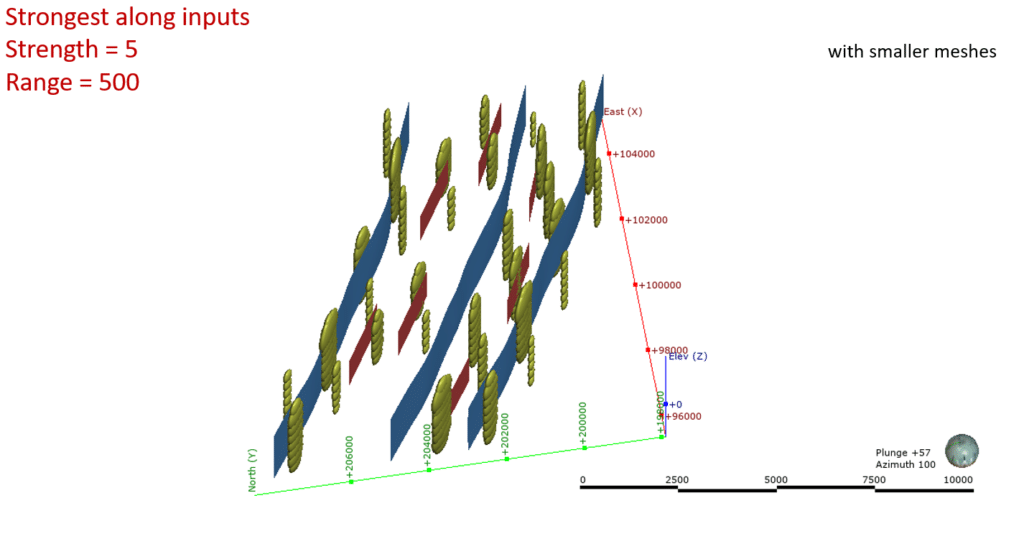
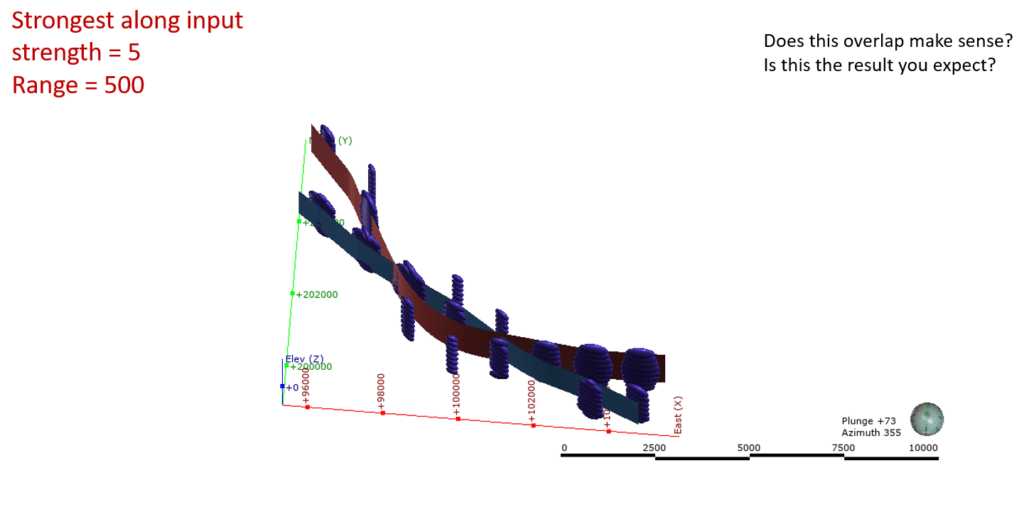
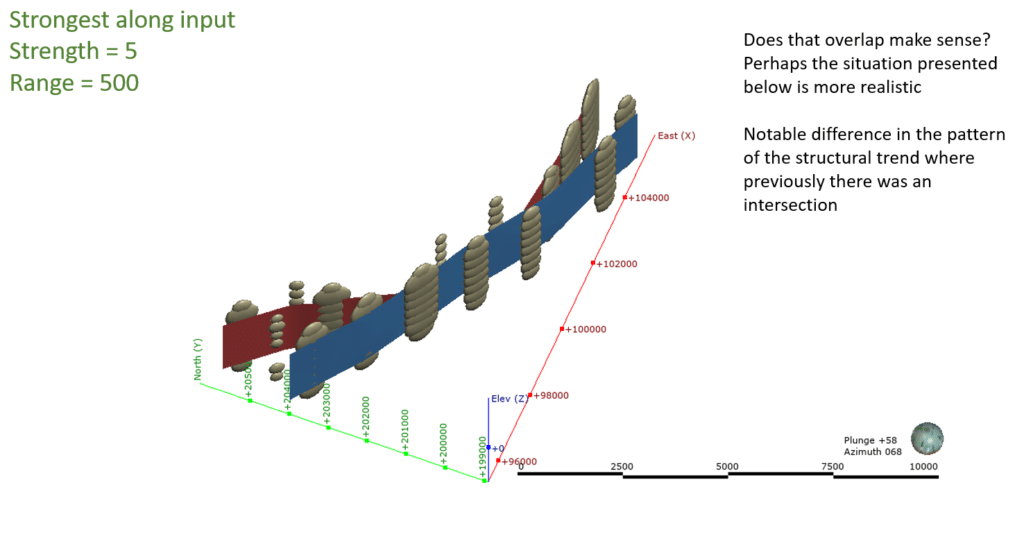
| Strongest along inputs | Creates a trend that decreases in strength away from the mesh to a certain range. After the certain range there is no effect. This is useful in defining a strong localised trend that essentially fades away from that point in space. |
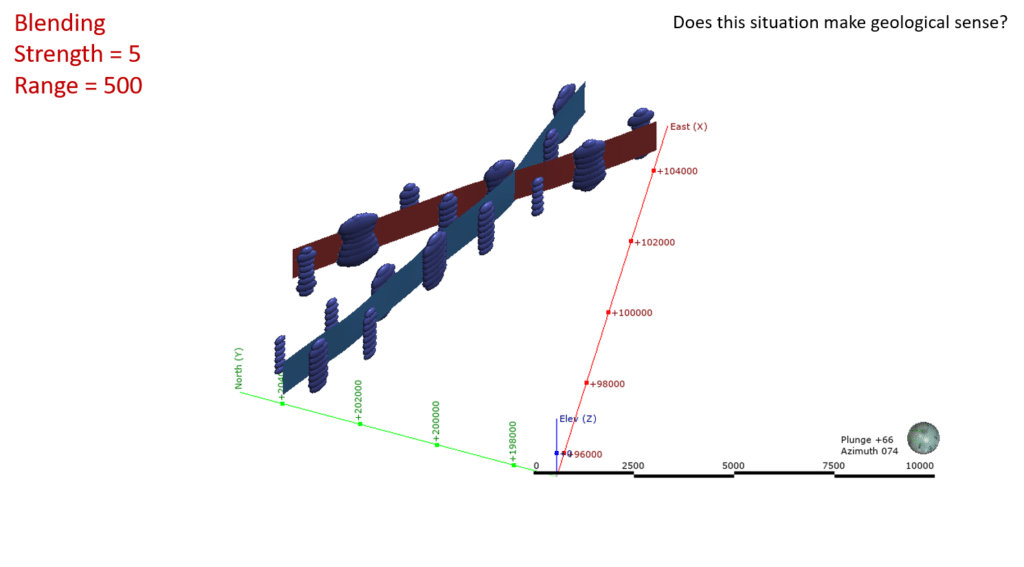
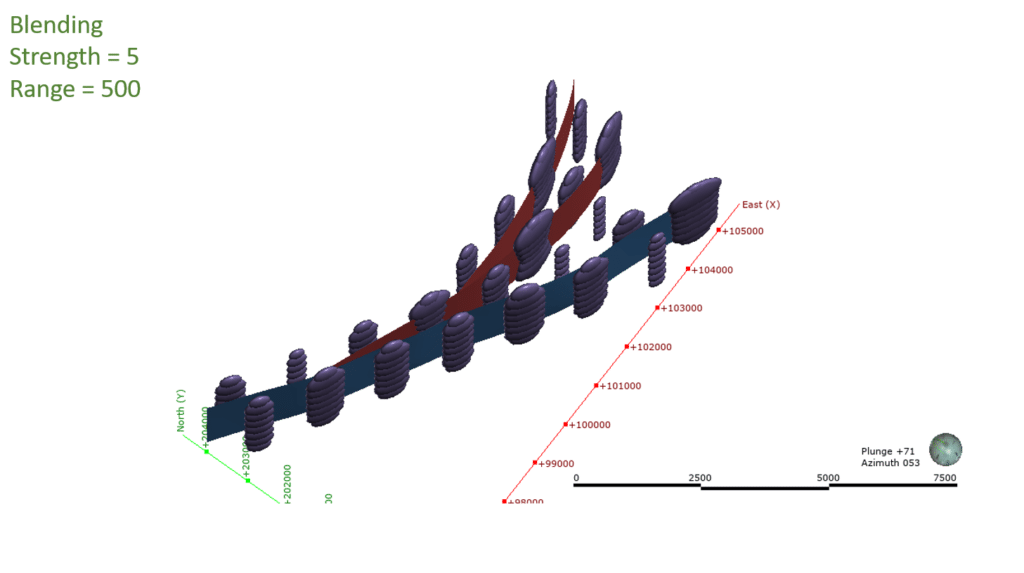
| Blending | Blending will allow you to build a trend from multiple meshes. Where you can specify a range and strength for each mesh. This is perfect for situations where two or more trends merge and you want to smooth transition from one to the other or show the combined effect. |
Troubleshooting with Structural trends
Have you used the wrong structural trend?
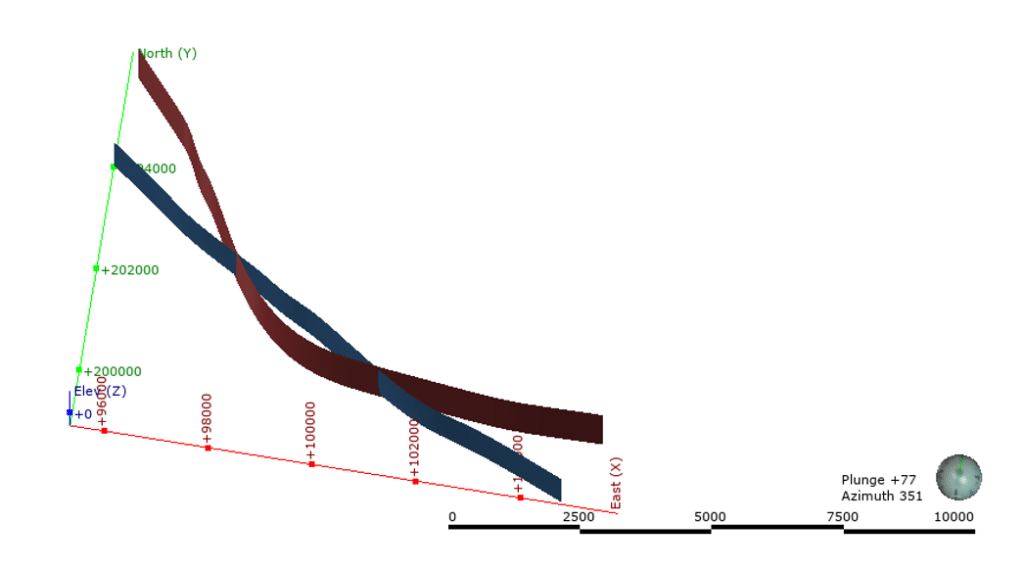
When you clearly understand the purposes of the different structural trends you’re able to make the best choice of trend to use in the situation you’re facing. For instance, if the angle between the surfaces is wide, you’d use Blending. Or if the surfaces are of a similar orientation you’d use Non-decaying. If you have multiple surfaces with truncated angles between them, you would not choose to use Non-decaying.
Have you brought in too many surfaces?
Perhaps you have access to geotechnical mapping and you’ve included these and other detailed information? Leapfrog will try to take into account all of these different surfaces and will try to work with what could be multiple overlaps. This can cause Leapfrog to work very slowly as it is trying to compute these intersections and curve around surfaces. This could also lead to inconsistencies in your structural model and corrupt triangulations.
Parallel meshes. For blending and strongest along meshes, take into consideration the distances between meshes. The distance of influence of the trend has be related to the distance between meshes. It may be redundant to use detailed meshes between meshes if you are using a very large range of influence, with values greater than or similar to the spacing between main structures.
Seequent’s Solutions Director, Geostatistics, Ignacio Torresi comments, “It’s best to remove odd truncations where surfaces merge as they will create unreasonable structural shapes that will absorb processing time for little gain in geometry and quality. Use your structural geology knowledge and experience of the local geology to only include those surface that look geologically reasonable and remove intersections and thereby, redundant data.”
How to fix intersecting mesh issues for both non-decaying and strongest along meshes situations.
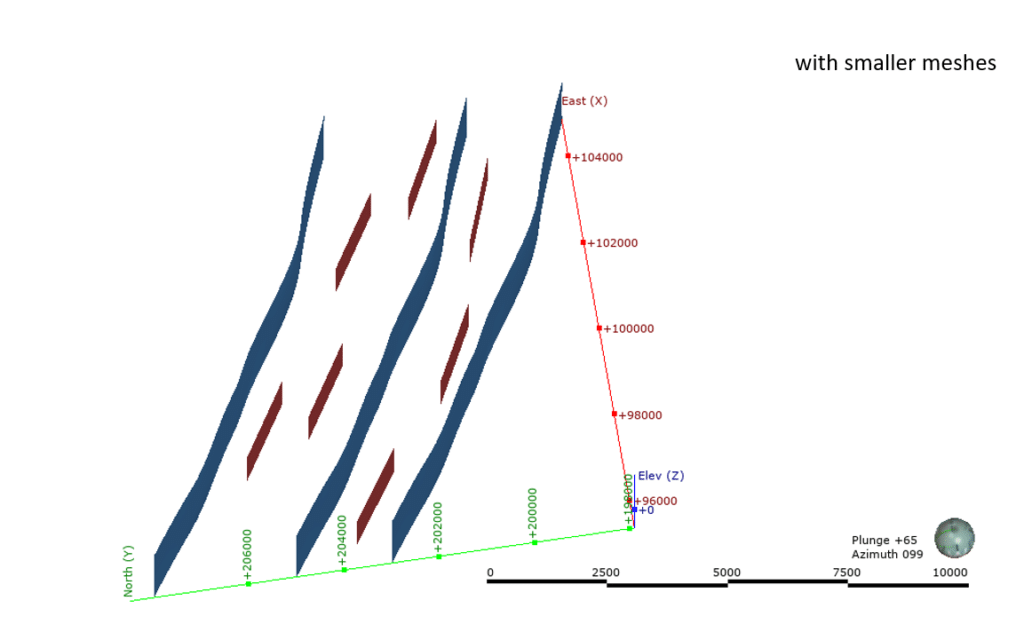
Here you can see how non-decaying, blending and strongest along meshes behave.
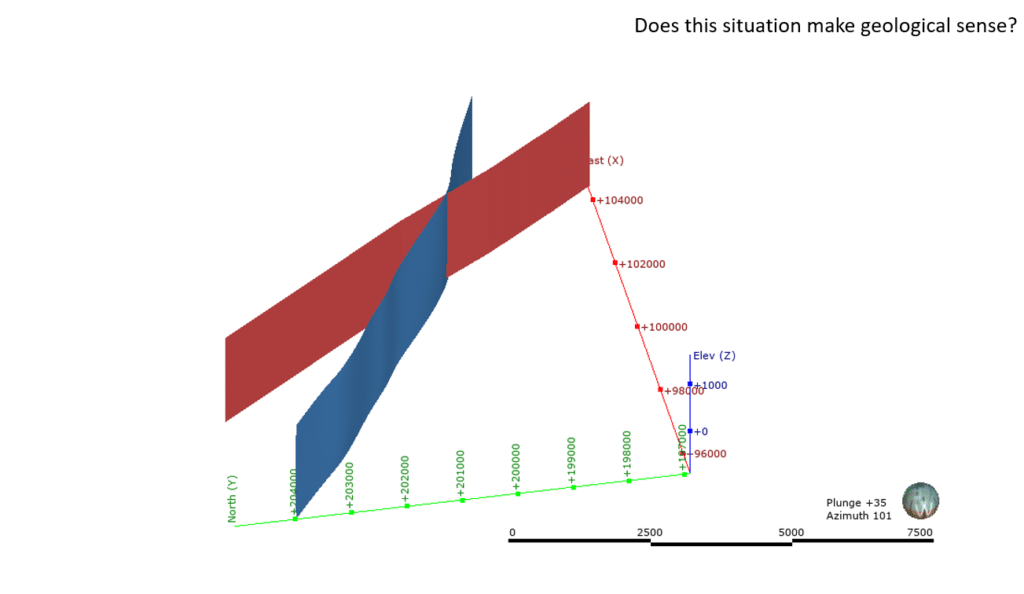
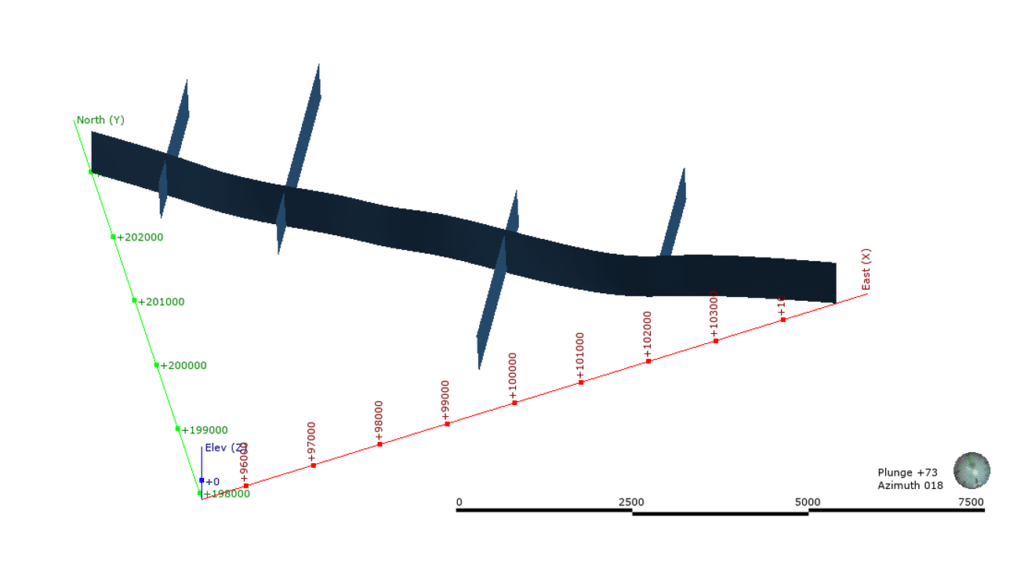
Fault Splays
It is normal to receive your information on fault splays like this. Multiple splays are a particularly common phenomenon in structurally controlled deposits. But before you use the structural trend make sure that you remove any unnecessary edges and create a clean geologically reasonable shape. Doing this will ensure that Leapfrog will work at optimum performance.
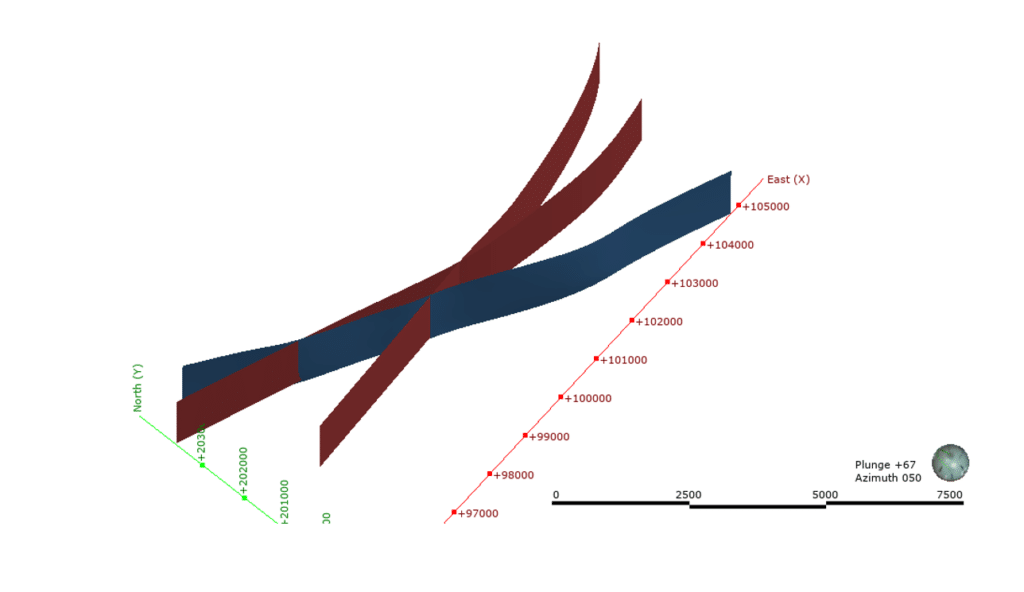
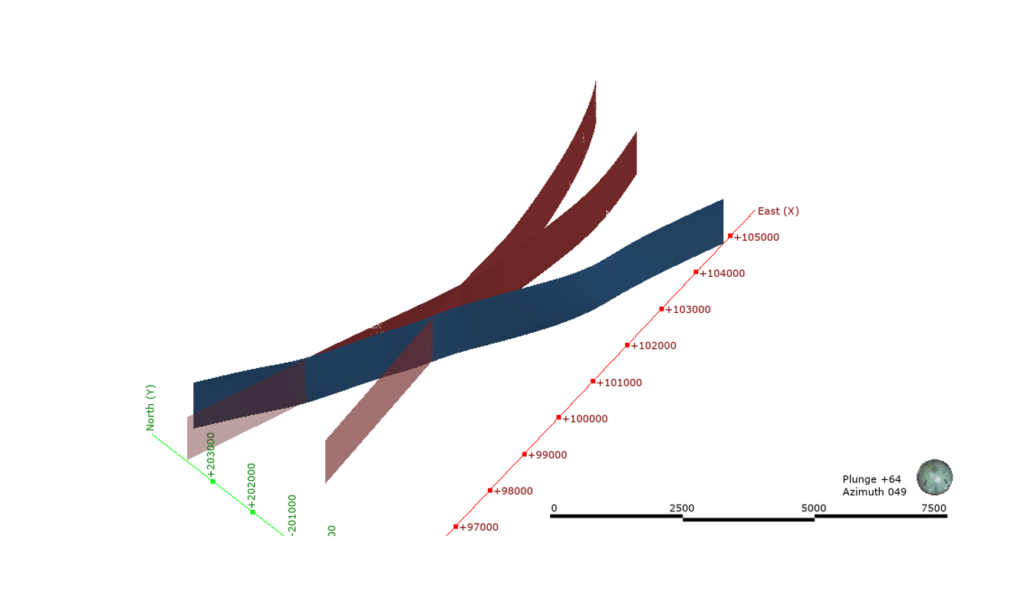
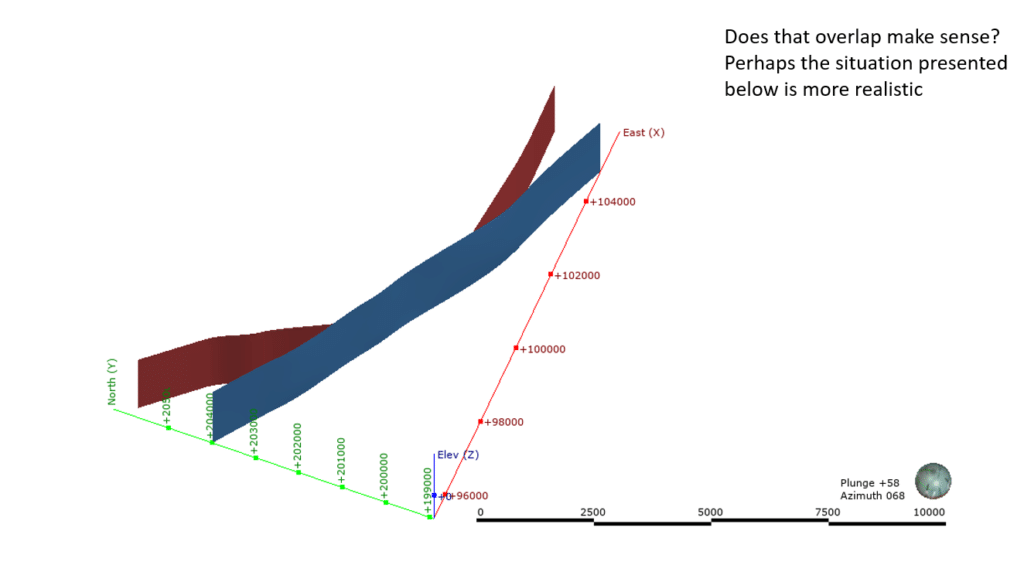
These slides demonstrate how to fix a fault splay, so that it makes structural geology sense and shows how the different trends behave appropriately once the structure is clean.
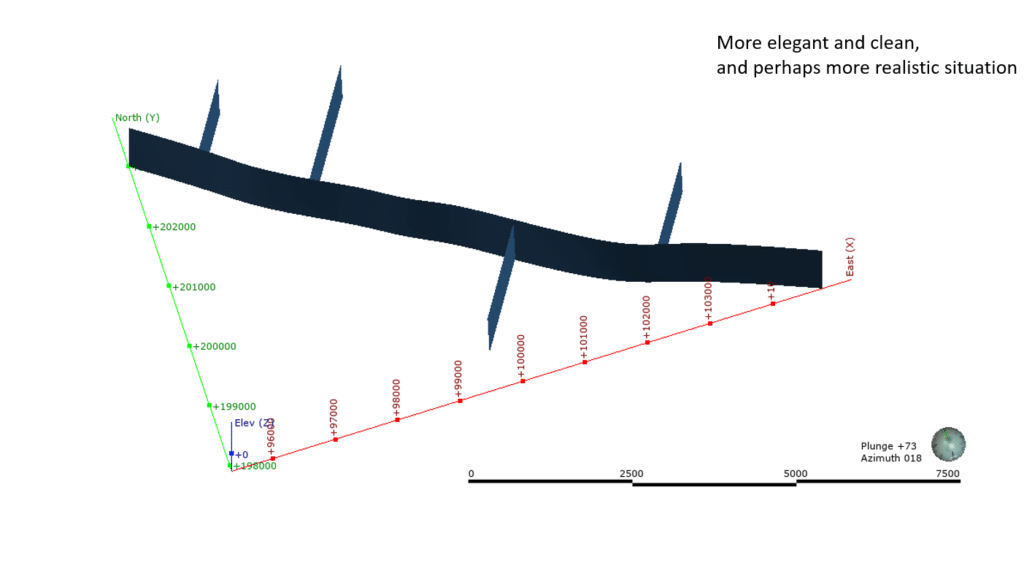
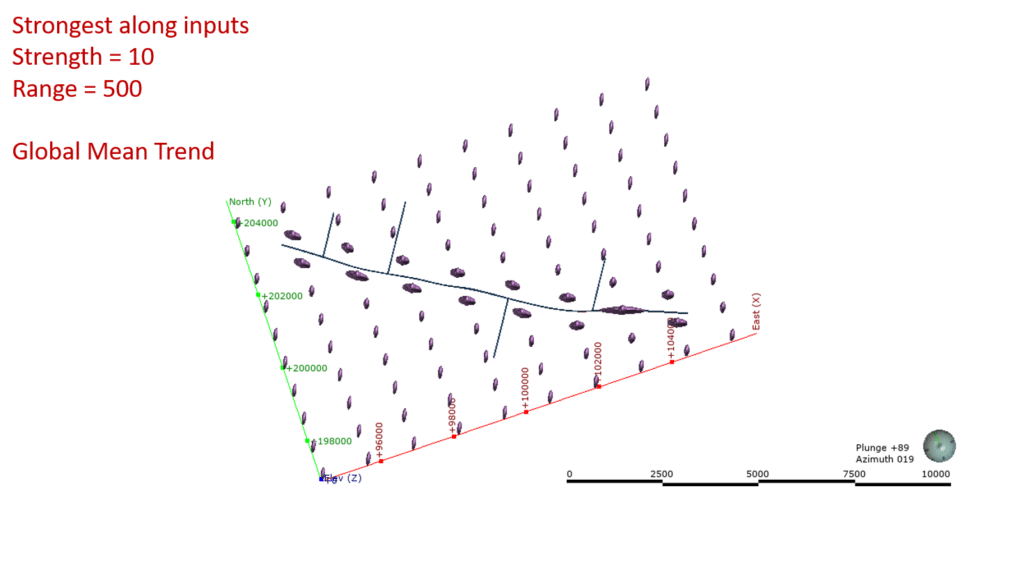
For fractures and joints – this demonstrates effective cleaning up of the structure between Figure 17 and 18. Figure 19 denotes odd behaviour in a non-decaying trend, compared to appropriate behaviour in Figure 20. Figure 20 illustrates where a Global Mean Trend was used to compose the structural trend, together with Strongest along inputs, to represent a more realistic situation.
Unstable triangulation
Are you experiencing unstable triangulation or unstable mesh, and getting the CSG error?
Can you see that your resulting model has openings? This means you can’t use it to select samples or to code a block model. Is your resulting model non-manifold?
- Consider what known geological structure has the underlying shape. What exists in nature?
- Remove unnecessary edges and create a more reasonable shape.
By taking this critical intervention Leapfrog will perform at optimum when creating your structural trend.
In summary, when you’re using Leapfrog’s structural trend, it’s important that you follow some simple steps:
Step 1 – make sure that you remove any unnecessary edges.
Step 2 – select the right structural trend for the job.
If you’d like to learn more, watch this video on how to get started with structural trends:
https://www.seequent.com/introducing-structural-trends-in-leapfrog-geo/