


Our drillhole database has always been far more than just an organised collection of data, stored and accessed through Leapfrog. From the beginning, the database was linked to the implicit modelling engine, enabling our unique dynamic modelling feature; reload the database with new data and it flows through and updates the geological model. And now, after a major investment in the redevelopment of Leapfrog’s underlying code, it’s much faster!
The major redevelopment project that we undertook has ensured Leapfrog is future-focused for the decade to come. These advances to your modelling experience are just the start, now we have the architecture in place you can expect an acceleration in the rate of improvements we can bring you.
Product Manager Geological Modelling, Byron Taylor, comments, “This has been a massive investment and has taken Leapfrog up another gear and has also allowed us to resolve some outstanding issues such as deleting and renaming columns. What’s more, we’re going to be able to do much more with this new foundation. This is only the start.”
Drillhole Performance – 40 - 70% reductions in drillhole loading
During development, benchmark testing of the new Leapfrog showed huge improvements in load time. The degree of improvement depends on many factors and will vary from project to project, with large or complex drillhole sets benefitting the most. Since the release, our customers have reported improvements that are consistently greater than 40% and up to 70% in loading time.
You’ll also notice a huge reduction in non-productive wait time – realised through restructuring of the underlying code and parallelisation of processing. You can also include points in drilling data loading, so you can specify and load points data at the same time as interval tables in one smooth step.
Drillholes - Calculations on interval tables
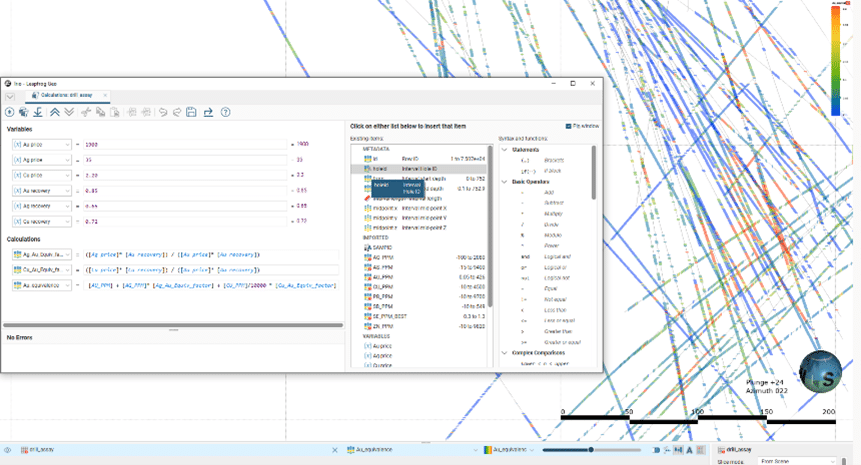
With the introduction of calculations on all drillhole interval tables, you can now develop new efficiency boosting workflows. Create numeric and category variables and access meta data including hole ID, from, to, interval length and interval mid-point coordinates. Possible workflows that this opens up include:
- Creating ‘top-capped’ grade variables for statistical analysis, input to compositing etc.
- Creating calculated density values, for example, based on stochastic multi-element assay suites.
- Use of coordinate meta-data in scatter plots for analysis of grade trends.
- Calculation of grade*thickness (or gram-metre) values for vein intersections
- Calculating metal equivalency values.
- Generating ore type classifications via categorical and numerical calculations.
- Assigning recoveries to drillhole intervals based on ore type classification.
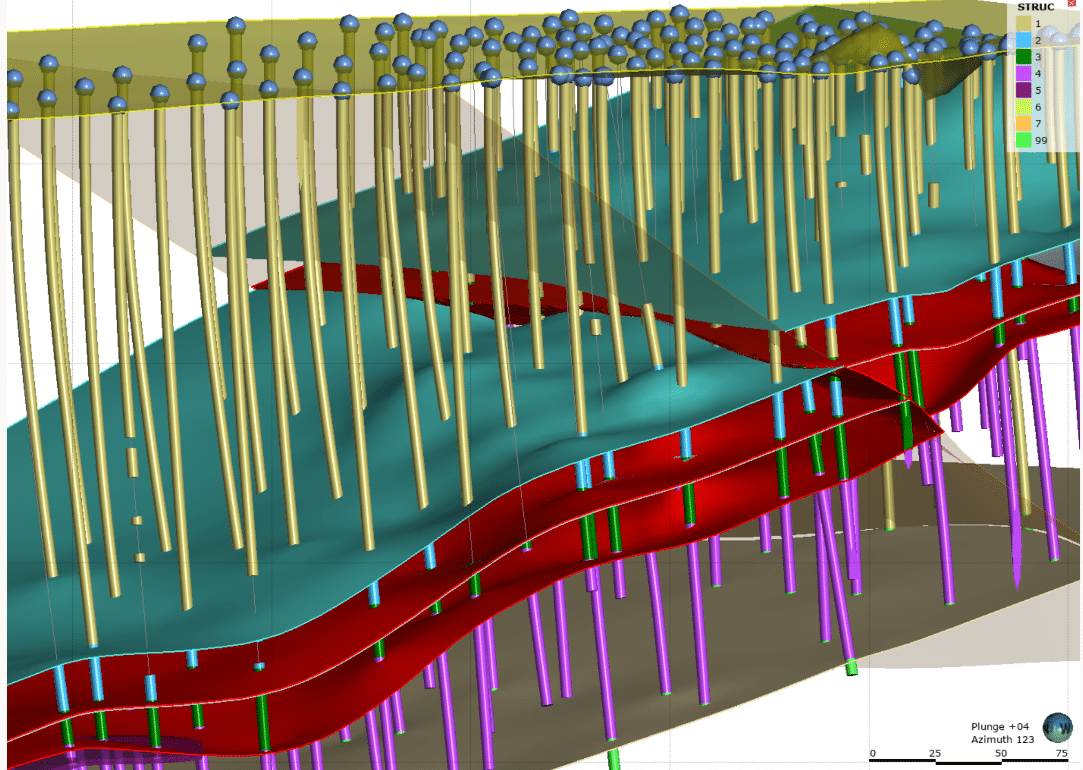
Example: calculation of grade*thickness values for vein intersections.
As an example, we describe here a workflow for calculating grade* thickness values (often called gram-metre values) for a narrow mineralised vein structure. Previously these calculations would have required using an external application such as Excel – but now the workflow remains within Leapfrog, with all the benefits that dynamic updating brings.
- From interval selections, create a model of the vein.
- Create a merged table of Lithology and Assay values, with a query filter to isolate the vein intersections.
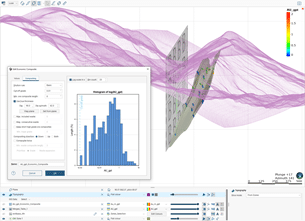
- Use the Economic Composite tool to create a single ‘Ore’ Composite per vein intersection.
a. Select the merged table with query filter applied as the input.
b. Use a low cut-off grade and minimum ore composite length to generate a single composite per continuous intersection.
c. Tick ‘Use true thickness’ to calculate intersection true length relative to the chosen reference plane (in this case projection onto a strike parallel, vertical plane).
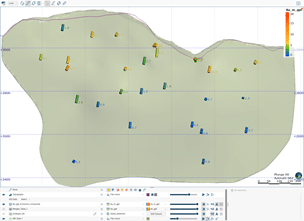
Resultant ‘grade*thickness’ values can be shown in long-section views, used to generate contours for plotting, or used as inputs to a ‘psuedo-2D’ grade estimation.
The existing functionality of query filters on drilling tables remains the same, with the advantage that output columns from calculations are now also available to filters.
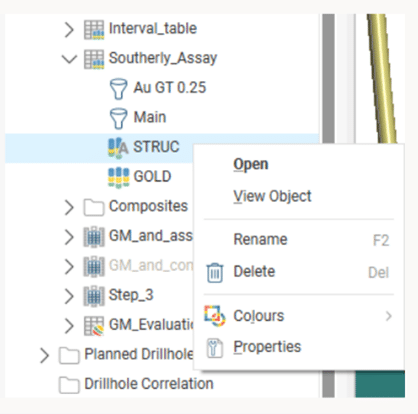
Drillhole Interval Tables – Rename or Delete columns
You can now rename or delete columns on drillhole interval tables. This applies to all drillhole collars and interval tables, as well as screens, downhole points, downhole structures, lineations, planar structures and GIS data. Changes that you make will flow down the project tree, while any downstream filters and calculations that require adjustment will be flagged for your attention.
We sincerely hope you enjoy the new Leapfrog! Behind the scenes, seven teams and a total of 47 developers and testers worked concurrently over nine months to deliver it. This massive investment ensures Leapfrog remains future-focused, behaves in much the same way you love and alleviates many of the workflow irritations you’ve experienced in the past.