


The 2D Section Viewer is a powerful new tool developed for analysing 2D geophysical data in Oasis montaj 2022.2. It offers geoscientists a range of features to help them more accurately interpret and analyse their data, including the ability to plot measured data as profiles and any other data as sections. This is an invaluable resource for geoscientists looking to gain a deeper understanding of their data. It is an essential step for analysing time domain electromagnetic (TDEM) data and complementary to potential field data.
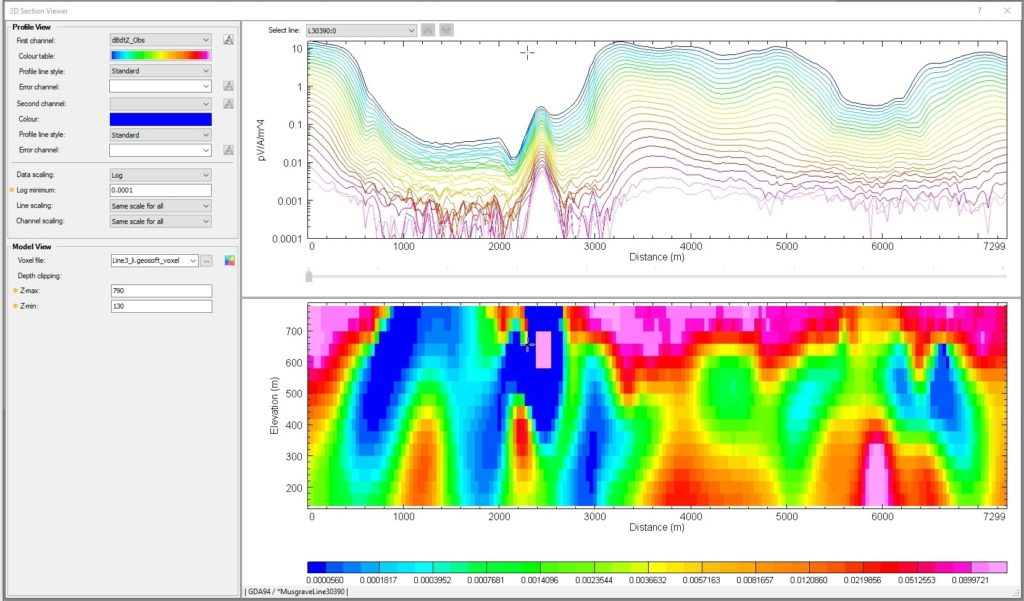
2D Section Viewer with a TDEM voxel slice and the geophysical data profile plotted.
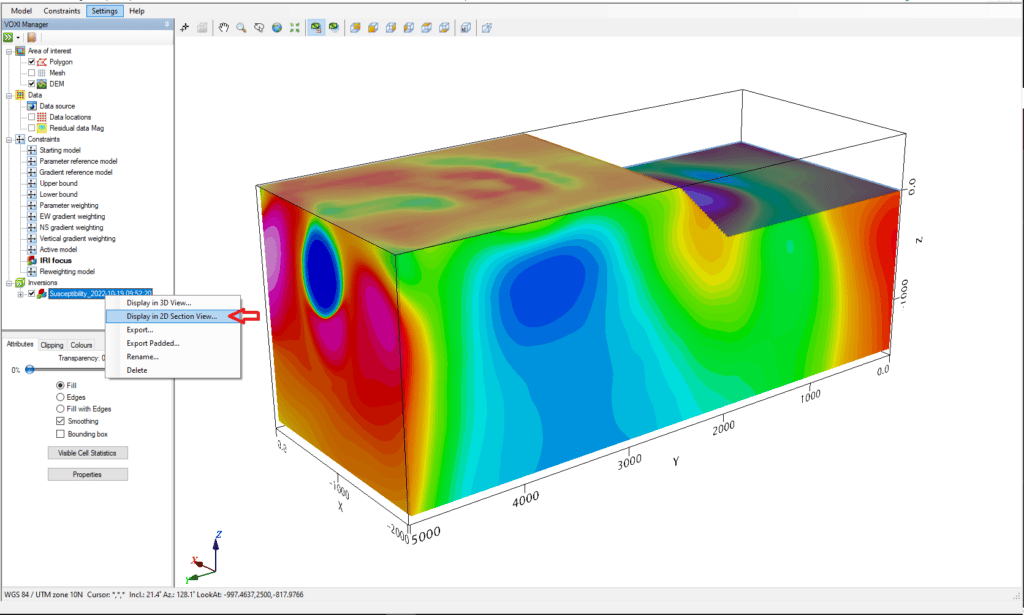
To use the 2D Section Viewer, simply enable it through the EM Utilities and Geophysics extensions in Oasis montaj or the VOXI Manager (Display in 2D Section View) under the Inversions node. The tool will automatically open the predicted response database if accessed from the VOXI Viewer context menu and automatically load the inversion model result in the Model view.
Locating the 2D Section Viewer window
In the 2D Section Viewer window, you’ll find the Profile View fields on the left, where you can select the profiles you want to compare with the voxel. You can also customize the colour (colour table) and line style (profile line style) for each profile, and choose to view data using a linear, logarithmic, or log/linear scale. There’s even a button available to the right of the fields for the first and second channels, which allows you to choose the error channel if applicable.
The Data Scaling field allows you to set the scaling of the vertical axis, with the default setting being ‘linear’. This is particularly useful when working with array data that span multiple orders of magnitude, as you can view it using a logarithmic scale or a log/linear scale. You can also manually adjust the Log minimum if needed. The Line Scaling option lets you set the Y-axis plotted on the profile view when changing the lines selection, either separately, with the same scale for all, or with the same dynamic range centred.
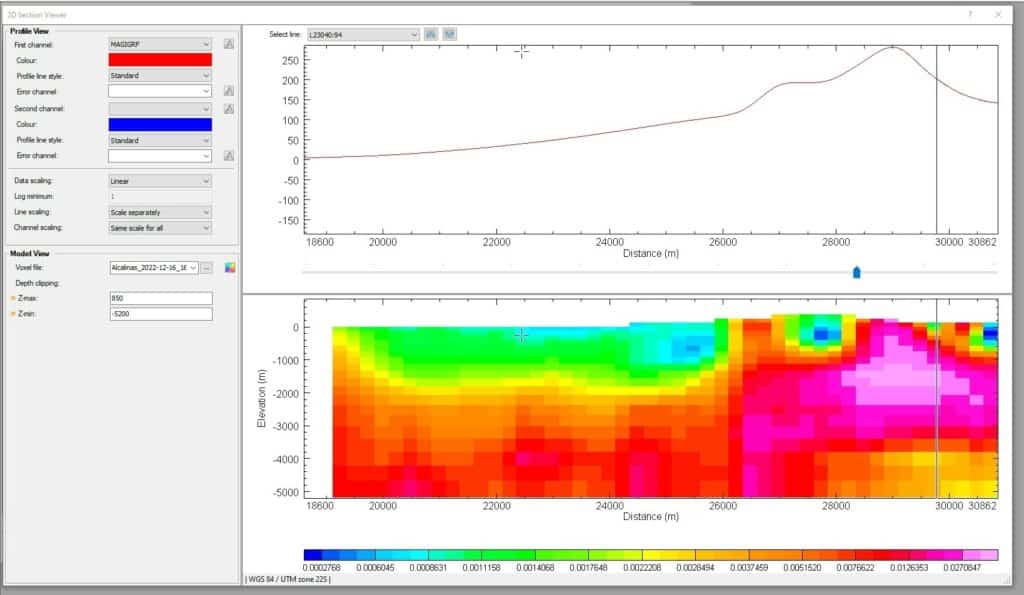
2D Section Viewer with a susceptibility voxel slice and the geophysical data profile plotted. The Profile View fields require the profile options.
The Channel scaling option in the 2D Section Viewer allows users to set the Y-axis plotted on the profile view when changing the Channel selection. Users can display the Y-axis separately for each channel, with the same scale or dynamic range centred for all channels. This option helps compare the dynamic range of two or more channels, regardless of their mean value.
In the Model View, you can select a voxel from the drop-down menu (these are the voxels added to your current project) or browse to choose a different file (*.geosoft_voxel or *.geosoft_vector voxel). A slice of the selected voxel at the line specified in the Select line field will be displayed in the Model view, which is located on the right side of the 2D Section Viewer. If you select a vector voxel, the amplitude of the vector voxel will be displayed instead. You can also use the colour tool to change the voxel’s colour and adjust the Depth Clipping to better visualise the top or lower layers.
The Profile and Model Views on the right side of the 2D Section Viewer allow you to view the data distribution based on your channel and scaling options and view slices of voxel data. The X-axis units are converted from the database into distance units, while the Y-axis represents the amplitudes of the measured data. You can display the Y-axis on the left side of the graph for the first channel selected and on the right side for the second channel chosen.
The 2D Section Viewer has a robust Dynamic Data Linking feature, enabling users to link their profile and voxel data seamlessly. This feature can be accessed by clicking anywhere within the Profile and Model Views and can be used in conjunction with other georeferenced Geosoft files such as maps, 3D views, and databases (gdb).
Dynamic Data Linking allows users to easily switch between different views and data sets, allowing for a more comprehensive understanding of the data being analysed. This feature is particularly useful for geoscientists working with a variety of data sources, as it enables them to easily link and analyse their data in a single, cohesive platform.
Dynamic Data Linking between the 2D Section Viewer and the GDB and Map View.
The 2D Section Viewer includes a Zoom feature that allows you to focus on specific anomalies in your data. To access this feature, simply right-click in your Profile window and select Zoom. You can also right-click and choose the Rescale all option to adjust the scaling of your data.
In addition to these features, the 2D Section Viewer window can be manually adjusted by the user to fit their needs. Simply click on the edges or sides of the window and drag to resize it. The plotted data will be rendered according to the size of the 2D Section Viewer window so you can customise the view to best suit your needs.
The 2D Section Viewer is an essential tool for those analysing geophysical data, as it allows you to visualise data distribution and compare it to slices of voxel data. It is also helpful when analysing susceptibility data, as it will enable you to compare the dynamic range of different channels.
If you have any questions, please, send questions or requests to [email protected], consult the help available in the 2D Section Viewer, and visit my.seequent.com.