


During this demo, we will show you how you can easily visualize your geoscience data in Target for ArcGIS Pro.
We will show you how to import and refresh from MX Deposit. Integrate your exploration data in 2D and 3D. Come check out what’s included in the latest release of Target for ArcGIS Pro.
Overview
Speakers
Kanita Khaled
Geophysicist – Seequent
Duration
29 min

See more on demand videos
VideosFind out more about Seequent's mining solution
Learn moreVideo Transcript
[00:00:00.000]
(piano music)
[00:00:02.616]
(piano music)
[00:00:05.315]
(piano music)
[00:00:09.680]
<v Kanita>Welcome everyone.</v>
[00:00:10.513]
My name is Kanita Khaled,
[00:00:12.200]
and thank you for joining in today.
[00:00:13.860]
Hope you’re making the most out of the first ever
[00:00:17.140]
virtual PDAC experience so far.
[00:00:20.270]
Today, we’ll be talking about how to import
[00:00:22.520]
and visualize your drill hole and subsurface data
[00:00:26.400]
in Target for ArcGIS Pro,
[00:00:27.980]
with a focus on connecting to MX Deposit.
[00:00:32.780]
A bit of demo logistics, I’m joined today by my colleague,
[00:00:36.260]
Geoffrey Plastow, who will be helping moderate
[00:00:38.280]
if there are any questions.
[00:00:40.690]
Okay, so, my name is Kanita Khaled, and I’m a Geophysicist
[00:00:44.460]
here at Seequent, and I’m based in our North America branch,
[00:00:49.010]
and today I’m joining in from Toronto.
[00:00:52.320]
And here at Seequent, I work primarily within
[00:00:54.690]
the technical team, collaborating often with our
[00:00:57.470]
other business units.
[00:01:01.490]
Statements of confidentiality and disclaimers,
[00:01:04.330]
and with introductions and disclaimers now out of the way,
[00:01:08.280]
let’s dive right into the demo.
[00:01:11.060]
And I’ve gone and opened up a blank map
[00:01:14.240]
of our ArcGIS Pro to get started.
[00:01:17.680]
And I’ve got the Target ribbon up here at the top,
[00:01:21.000]
and I’m signed in with both my Seequent ID and my Esri ID.
[00:01:25.270]
And I need to be signed in with my Seequent ID
[00:01:27.470]
to access the functions in this Target ribbon.
[00:01:31.100]
And on the left-hand side of the Target ribbon here,
[00:01:33.580]
I can see the import group, and this import group is what
[00:01:37.790]
allows me to import a variety of data types into my project.
[00:01:41.650]
I can import in things like Geosoft grids,
[00:01:45.150]
convert them into raster files, subsurface mesh data,
[00:01:51.050]
and also bring in drill hole data.
[00:01:54.440]
So this last category here,
[00:01:56.740]
drill hole data, is what we’ll be getting started with.
[00:02:02.160]
The first way to import drill hole data is to,
[00:02:05.730]
or is as an Excel or Access file.
[00:02:08.880]
A fairly common format.
[00:02:11.810]
You can also import in your data with an ODBC connection.
[00:02:16.410]
If you’re hooked up to an ODBC connection,
[00:02:18.470]
either locally or on your network,
[00:02:21.700]
and fairly commonly, you can also use a text,
[00:02:25.680]
a CSB, or an ASCII file format.
[00:02:29.860]
If your organization logs your drill hole data
[00:02:32.580]
with programs like acQuire or MX Deposit,
[00:02:36.310]
you can import data directly from those programs as well.
[00:02:40.210]
And finally, if you have a pre-existing
[00:02:42.450]
Geosoft Target project, that entire project
[00:02:45.480]
can be directly imported into ArcGIS Pro.
[00:02:48.640]
So today let’s focus on the import process from this program
[00:02:53.290]
right here, and that is MX Deposit.
[00:02:58.010]
So I’m going to flip over to my browser.
[00:03:02.820]
And
[00:03:04.090]
so here I am,
[00:03:07.040]
logged into the MX Deposit application on my browser,
[00:03:11.420]
and we’ll sidestep just a little bit here to talk about
[00:03:14.200]
MX Deposit very briefly.
[00:03:16.860]
If you’re unfamiliar with MX Deposit,
[00:03:19.200]
it’s a completely cloud-based logging application
[00:03:22.740]
that’s really designed to help mining
[00:03:24.810]
and exploration companies simplify and modernize
[00:03:28.880]
their drilling programs.
[00:03:31.250]
So MX Deposit essentially allows you to log your
[00:03:35.020]
drill hole data from anywhere in the world,
[00:03:37.650]
as long as you have internet,
[00:03:39.740]
but it also has remote capture options, as well,
[00:03:43.580]
for those who do not have internet access.
[00:03:46.890]
And MX Deposit is also supported as a mobile application.
[00:03:51.060]
So today we’ll take a look at the integration of MX Deposit
[00:03:56.160]
with Target for ArcGIS Pro, which allows you to
[00:03:58.790]
quickly import in drill hole projects from this
[00:04:02.450]
cloud-based environment
[00:04:04.520]
directly into the ArcGIS Pro environment.
[00:04:08.020]
And for that to work,
[00:04:09.640]
you have to make sure that you’re logged in with your
[00:04:11.510]
Seequent ID, that contains your subscription for both
[00:04:15.920]
MX Deposit and Target for ArcGIS Pro.
[00:04:19.790]
So here, is the home screen for MX Deposit,
[00:04:23.790]
and I’m going to head over to my project summary here,
[00:04:26.500]
the project summary page, and from here,
[00:04:29.240]
I can see a list of all of the drill hole projects
[00:04:32.390]
that I have been given access to by my organization.
[00:04:36.430]
So Foxfire, LITA, New Zealand, Phoenix, and Wolf Pass.
[00:04:41.860]
And this project is the one that I want to import in today,
[00:04:45.180]
this Wolf Pass datasets.
[00:04:48.020]
Once I select Wolf Pass, I can also see the types of data
[00:04:52.460]
that are logged within this project.
[00:04:55.440]
I can see the active drill holes,
[00:04:58.940]
and once I select the drill holes, I can select,
[00:05:01.290]
I can visualize
[00:05:03.240]
the list of drill holes that are associated
[00:05:06.210]
with this project.
[00:05:08.750]
And from here, I can select a drill hole.
[00:05:11.340]
I can take a look at its header
[00:05:13.130]
so I can see, okay, this is a diamond drill hole,
[00:05:16.760]
the depth of this hole,
[00:05:18.510]
who it was logged by,
[00:05:21.020]
when it got started,
[00:05:22.580]
and also the coordinate information.
[00:05:26.730]
Heading over to the survey tab.
[00:05:28.380]
I can see the down-hole survey information,
[00:05:31.710]
and along here, I can see all of the different
[00:05:34.881]
data attributes associated with this particular hole.
[00:05:38.180]
So my lithology data,
[00:05:40.310]
if you have alteration, mineralization data
[00:05:44.060]
and also sample results,
[00:05:46.410]
if you have those available from the lab.
[00:05:48.660]
So here, I have things like my copper, my gold, my silver
[00:05:53.176]
assay results for this particular hole.
[00:06:00.120]
If you like, there’s one really helpful feature.
[00:06:03.900]
You can start to visualize this down-hole data
[00:06:06.330]
as strip logs.
[00:06:08.480]
So here, at visualized the whole WP048 as a strip log,
[00:06:13.320]
this column here with my lithology data,
[00:06:16.030]
and here on the right in red and orange,
[00:06:18.800]
I’ve actually visualized my gold and copper data
[00:06:22.415]
as area plots.
[00:06:25.380]
So if I wanted to, I could then go in and start to
[00:06:28.760]
really customize this strip log.
[00:06:31.730]
I can start adding things like mineralization or alteration
[00:06:37.510]
and really customize the strip log.
[00:06:40.870]
Okay, so let’s come out of this.
[00:06:43.532]
So, I have all of these drill holes that are currently
[00:06:46.550]
ongoing or already completed.
[00:06:48.680]
Now that that has been logged in Capture,
[00:06:51.160]
let’s bring it into Target for ArcGIS Pro.
[00:06:54.500]
All right, I’m going to switch over.
[00:06:58.150]
So here, I have my blank map for this particular project,
[00:07:02.600]
and I want to import in the Wolf Pass dataset
[00:07:06.310]
from MX Deposit to ArcGIS Pro.
[00:07:09.270]
So to do that from this import group in the Target ribbon,
[00:07:13.750]
let’s go ahead and select drill hole data,
[00:07:17.090]
and then MX Deposit.
[00:07:21.250]
And this would then bring up the import drill hole
[00:07:25.290]
from MX Deposit toolbar.
[00:07:27.400]
And I can rename the project that I want to import,
[00:07:30.200]
let’s say, as Wolf Pass,
[00:07:34.180]
and because I’m connected,
[00:07:37.760]
or because I’m logged in with my Seequent ID,
[00:07:41.070]
which is also connected to MX Deposit,
[00:07:43.400]
Target will now show me the list of projects available
[00:07:47.260]
directly from MX Deposit.
[00:07:49.080]
Just the ones that we just saw.
[00:07:51.040]
So today we’ll pick Wolf Pass,
[00:07:53.360]
and from here we can also select the activity.
[00:07:57.320]
That would be core logging.
[00:07:58.790]
And you also have the option of selecting
[00:08:00.460]
the coordinate system.
[00:08:01.460]
For our case, WGS 84,
[00:08:04.270]
Zone 18N.
[00:08:06.220]
So once I click on this run,
[00:08:10.040]
run button, this starts the import process,
[00:08:14.450]
and this will then go ahead and import in
[00:08:17.850]
the Wolf Pass dataset from MX Deposit
[00:08:21.810]
from the cloud directly into Target for ArcGIS Pro.
[00:08:26.320]
So let’s take a look at what that looks like.
[00:08:31.360]
So here, I have my colors done,
[00:08:33.810]
and also my traces associated with
[00:08:37.750]
the Wolf Pass drill hole dataset.
[00:08:41.829]
So once your program, or once your drilling program
[00:08:45.850]
continues to progress each day,
[00:08:48.870]
you can always update your data in ArcGIS Pro
[00:08:52.800]
using this Refresh Drill Hole Import option.
[00:08:56.820]
And this will connect to MX Deposit,
[00:08:58.537]
and with just one click, you’re ready to update your data.
[00:09:02.490]
So this connection between MX Deposit
[00:09:04.757]
and Target for ArcGIS Pro allows you to log your data,
[00:09:08.700]
connect to it instantly,
[00:09:10.340]
and then visualize your results without losing any time
[00:09:13.950]
between the logging and the final visualization.
[00:09:17.240]
So this makes it a really effortless and efficient workflow.
[00:09:23.230]
So once the data is added in here to Target for Arc Pro,
[00:09:27.260]
I can start to visualize other attributes
[00:09:30.650]
using this Drill Hole Data button.
[00:09:34.480]
And from here, I could start to visualize
[00:09:36.650]
my down-hole data, like my lithology or my assay data.
[00:09:41.380]
So let’s say I would like to visualize my copper data.
[00:09:43.680]
I would simply toggle that on,
[00:09:45.470]
and that would then be plotted in Plan View.
[00:09:48.592]
Using the Symbology option here,
[00:09:51.270]
I can change the size and the coloring of these,
[00:09:54.332]
of this particular attribute.
[00:09:58.190]
I can also offset it away from the trace.
[00:10:01.110]
So let me show you how to do that.
[00:10:04.570]
So here, I have my lithology data visualized,
[00:10:07.750]
but I’ve set it at an offset away from my trace
[00:10:11.472]
so that I can view both my trace and the lithology data.
[00:10:16.470]
So let’s now add in another assay attribute.
[00:10:20.530]
In this case, copper.
[00:10:22.370]
So now I’ve visualized both my lithology
[00:10:26.582]
and my assay data
[00:10:29.140]
simultaneously.
[00:10:31.040]
Another really interesting way of visualizing
[00:10:33.280]
your assay data is using this histogram-style look.
[00:10:38.580]
So here, I visualized my gold,
[00:10:42.480]
and I’ve customized the symbology
[00:10:44.883]
so that it’s visualized by color and size.
[00:10:48.560]
So it gives me a little bit of an easier look into where my
[00:10:51.910]
higher grade showings are.
[00:10:54.200]
So in this Plan View, you can visualize
[00:10:57.520]
multiple drill hole data types, lithology, mineralogy,
[00:11:00.170]
assay, all concurrently,
[00:11:02.910]
allowing you to really easily interpret my down-hole data.
[00:11:08.900]
Once I have my data in this 2D space,
[00:11:11.030]
I can go ahead and click on the New Drill Hole Scene button,
[00:11:14.520]
and that would take me to a new 3D scene.
[00:11:18.510]
And from here, I could start to visualize
[00:11:20.870]
that same dataset, but now I’m doing it in a 3D manner.
[00:11:24.500]
So let’s just rotate our scene here and position ourselves
[00:11:28.160]
so we could see a little bit better.
[00:11:33.150]
Whoops.
[00:11:36.915]
Let me go to a specific view.
[00:11:40.480]
So here, I have my drill hole dataset now visualized in 3D.
[00:11:45.500]
And similarly, I could start adding in things like
[00:11:50.816]
my copper or my lithology data right here onto the scene.
[00:11:56.980]
Wait a second for that to load.
[00:12:05.860]
And so there, I have my copper data, now visualized in 3D.
[00:12:10.000]
I could spin that around and take that,
[00:12:12.880]
just really start to inspect my data.
[00:12:15.310]
And I could also start to visualize things like
[00:12:17.780]
my lithology data
[00:12:25.350]
and so on.
[00:12:26.260]
You also have quick options here to view this data
[00:12:29.130]
from a variety of angles for ease of use,
[00:12:33.720]
but other than drilling data, what else can I bring in?
[00:12:36.360]
I’m also able to visualize raster data I mentioned before
[00:12:40.540]
by importing in Geosoft grids.
[00:12:43.470]
So I can import in a Geosoft grid,
[00:12:46.000]
like this topography file here,
[00:12:48.580]
and running that would then put that into my
[00:12:51.850]
geodatabase, which I could then visualize on my EDC.
[00:12:55.620]
So here, I have a LIDAR topography dataset that was
[00:12:59.845]
collected over this project.
[00:13:02.400]
It was graded in Oasis Montaj and then brought into
[00:13:07.100]
ArcGIS Pro as a raster image.
[00:13:09.970]
And so with this grid import option,
[00:13:12.010]
you can bring in other relevant data like geophysics
[00:13:14.830]
or geochemistry directly from Oasis Montaj.
[00:13:19.720]
Another key feature that I wanted to talk about today
[00:13:22.280]
is the subsurface mesh data option.
[00:13:25.360]
So that that’s this option right here,
[00:13:29.060]
and using the subsurface mesh data tool,
[00:13:31.610]
I can import in geological or other subsurface data
[00:13:36.380]
directly into my drill hole scene and project.
[00:13:39.990]
So for example,
[00:13:41.800]
let’s say I bring in data using an OMF format,
[00:13:44.900]
which is the open mining format.
[00:13:49.436]
And once I import that in,
[00:13:55.328]
I’m going to turn off my lithology
[00:13:56.580]
so you can get a better view.
[00:13:59.340]
So here’s that open mining format that is supported across
[00:14:03.790]
many of our Seequent products.
[00:14:06.460]
I’ve imported, I’ve created this in Oasis Montaj
[00:14:09.630]
and then brought it in to Target for ArcGIS Pro,
[00:14:14.450]
and essentially it’s now converted
[00:14:16.010]
into a multi-patch object.
[00:14:17.840]
And now I can visualize my gold grades
[00:14:21.678]
of 1.5 grams per time
[00:14:24.013]
right here on my scene.
[00:14:26.920]
And similarly, you could also visualize
[00:14:31.600]
geology.
[00:14:32.600]
So here, in maroon here,
[00:14:34.003]
I’ve visualized a gold bearing day site dike unit
[00:14:37.670]
and this was modeled out in Geo and then brought
[00:14:40.860]
into Target for ArcGIS Pro as a multi-patch object.
[00:14:45.700]
So with the subsurface mesh data option,
[00:14:48.760]
that can easily bring in mesh data
[00:14:51.670]
to add context to my drilling program.
[00:14:56.960]
Okay, so we’ve brought in all of this data types
[00:15:00.970]
into Target for ArcGIS Pro.
[00:15:02.910]
What can we do with it?
[00:15:05.080]
Well, one very common data product,
[00:15:08.550]
are cross-sections across the industry,
[00:15:11.660]
and we have a fully functioning
[00:15:13.907]
cross-section creation and managing tool.
[00:15:17.000]
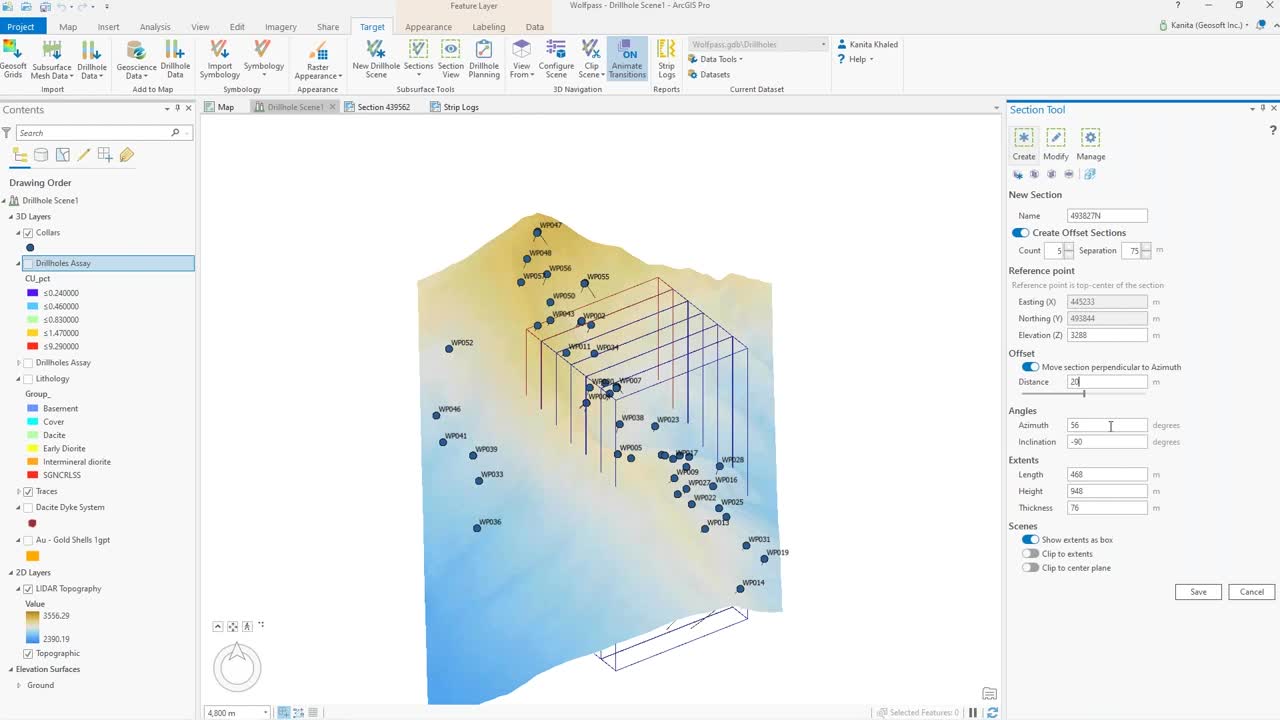
So with the Section Create Tool up here,
[00:15:23.250]
we can interactively create cross-sections
[00:15:27.100]
or a single cross-section,
[00:15:32.510]
or I could create multiple offset cross-sections.
[00:15:37.000]
So here, I’ve created a total of
[00:15:39.990]
five plus one original cross-section,
[00:15:42.990]
separated by 152 meters.
[00:15:45.690]
So I could change this to bring these sections a little bit
[00:15:49.620]
closer together, so those just updated.
[00:15:58.290]
And because this is a fully dynamic, 3D environment,
[00:16:02.600]
I can take this, and spin this around,
[00:16:05.100]
and inspect my cross-sections, or I can commit to them.
[00:16:09.110]
So here, if I didn’t like the location of them,
[00:16:12.160]
I could start to offset
[00:16:14.660]
it in perpendicular to my azimuth,
[00:16:18.550]
or I could even change things like the azimuth of the
[00:16:21.900]
cross-section, the inclination of the cross-section,
[00:16:26.182]
or even the length, the height, and the thickness,
[00:16:29.500]
all while, all before you’ve even saved the section.
[00:16:36.560]
Once you go ahead and save these sections,
[00:16:39.050]
they appear inside your Section Manager.
[00:16:43.340]
And inside the Section Manager, you’ll see a list
[00:16:46.050]
of all of the sections that you’ve created.
[00:16:47.780]
So I have four that are already created,
[00:16:50.930]
and now I can go into, what we call, a Section view.
[00:16:56.040]
And from the Section View, I can visualize my cross-sections
[00:17:00.560]
in a more familiar cross-section view.
[00:17:04.190]
And I can view them from a variety of angles.
[00:17:07.710]
From the front,
[00:17:11.370]
top, all just a variety of preset options
[00:17:15.705]
for your viewing convenience.
[00:17:18.070]
And while I’m here, I could go ahead and modify
[00:17:22.562]
these cross-sections on the fly.
[00:17:25.440]
If I wanted to readjust the scale, the length, the height,
[00:17:29.410]
or any of these other parameters that are present here,
[00:17:32.060]
I could do that.
[00:17:33.420]
And because you’re working inside the 3D view here,
[00:17:37.030]
you can also start adding in things like your assay data
[00:17:41.290]
or your day site dike unit,
[00:17:43.690]
or the gold shells that we brought in earlier.
[00:17:48.670]
So let’s turn on my lithology, actually,
[00:17:54.050]
and now that I’ve loaded it in,
[00:17:56.180]
I could start toggling through each one of these sections
[00:18:00.300]
to take a look at what they look like in this section view.
[00:18:06.190]
And once you’re ready,
[00:18:07.870]
this entire cross-section can be placed in a layout map,
[00:18:14.470]
like the one right here.
[00:18:16.710]
And once you place your section in a layout map,
[00:18:20.600]
any other relevant mapping information
[00:18:23.020]
like your legend,
[00:18:25.080]
your scale bar,
[00:18:27.100]
your north arrow,
[00:18:28.720]
any kind of text, Polyline annotation, mapping information,
[00:18:33.720]
can then be added in.
[00:18:35.090]
You can even add in a second or third or fourth inset map,
[00:18:38.810]
just like the one that I’ve added here.
[00:18:41.376]
So if you have active maps in your project,
[00:18:43.630]
you could then pull them into your layout
[00:18:45.420]
as you see relevant.
[00:18:47.880]
And once you’re ready,
[00:18:49.420]
these can be saved in multiple different formats like this.
[00:18:55.890]
Here, I’ve published it as a PDF.
[00:18:57.760]
You could do so in any of the formats that Esri allows
[00:19:01.190]
you to do like JPEGs and TMG files.
[00:19:04.460]
There’s a host of available formats to publish in.
[00:19:09.890]
And last but not least,
[00:19:11.300]
I’d like to bring your attention to one last functionality
[00:19:14.255]
that was incorporated recently, and that is strip logs.
[00:19:18.640]
So many of you are familiar with strip logs already.
[00:19:21.770]
It’s essentially a downhill plot of geological features
[00:19:25.060]
from a single drill hole.
[00:19:26.020]
We saw something similar in MX Deposit, and this,
[00:19:30.110]
in ArcGIS Pro, can be created using
[00:19:33.470]
the strip log reporting tool here in the Target ribbon.
[00:19:38.280]
Just going to close out the section tool here.
[00:19:41.870]
So here, I have the strip log reporting tool open
[00:19:45.420]
here on the side,
[00:19:46.960]
and I can start creating my strip log by importing
[00:19:50.270]
in a layout.
[00:19:52.390]
And there’s a variety of layouts that are available for
[00:19:56.072]
Target ArcGIS Pro users to start building
[00:19:59.020]
your strip log template.
[00:20:01.920]
And from here, you simply select the hole, the drill hole
[00:20:05.010]
they’d like to visualize, add some of these additional texts
[00:20:10.174]
to give information on your drill hole.
[00:20:13.150]
And from there, you can simply start adding in
[00:20:15.650]
what we call, chart frames for data strips.
[00:20:19.010]
So here, I’ve added
[00:20:21.430]
three charts frames for my gold, my copper,
[00:20:25.080]
and my molybdenum,
[00:20:26.420]
and here, I visualized them as far plots and line plots.
[00:20:31.770]
And here on the far left, I visualized my lithology data,
[00:20:36.160]
simply using my lithology color convention that I’ve
[00:20:40.310]
customized in Target for ArcGIS Pro.
[00:20:44.340]
So the appearance of all of these chart frames can be
[00:20:48.118]
modified and fine tuned.
[00:20:50.640]
I’ve also added in things like legends, and annotations,
[00:20:54.170]
and titles, just to make this plot relevant
[00:20:58.230]
and ready for publishing.
[00:21:00.660]
And just like the section map,
[00:21:02.300]
once you’re happy with your strip log look and feel you,
[00:21:05.070]
could publish it out into a variety of formats,
[00:21:09.038]
and the whole thing is quite customizable.
[00:21:12.860]
So with that, I’d like to conclude the demo portion
[00:21:16.020]
of the presentation, and just switch gears ever so slightly,
[00:21:20.980]
and talk about what’s coming up next.
[00:21:24.730]
So for upcoming release,
[00:21:27.140]
I am pleased to announce that the next release of
[00:21:29.670]
Target for ArcGIS Pro is coming up in April,
[00:21:33.360]
early April 2021.
[00:21:35.350]
So please be on the lookout for that.
[00:21:38.010]
And in this version, we’ll be supporting version,
[00:21:40.510]
ArcGIS Pro version 2.7.
[00:21:43.010]
And we’re hoping from that point onward,
[00:21:45.610]
we’ll be able to match the Target for Arc Pro
[00:21:49.050]
version updates with ArcGIS Pro version updates.
[00:21:52.748]
And in this upcoming version,
[00:21:55.449]
we’re adding multiple section improvements,
[00:21:58.590]
like section extents,
[00:22:01.330]
section scale, an offsetting capability for your symbology.
[00:22:07.270]
And we’re also supporting a new shared installation option,
[00:22:11.770]
which would allow multiple users to,
[00:22:14.830]
who share a single computer or a virtual machine,
[00:22:18.410]
to access Target or ArcGIS Pro.
[00:22:22.200]
So please be on the lookout for that upcoming release.
[00:22:28.290]
And with that,
[00:22:29.400]
I would like to conclude the presentation,
[00:22:32.461]
and I’ll just open up the floor now for any questions
[00:22:35.700]
that you might have.
[00:22:36.533]
Please feel free to type them into
[00:22:38.570]
the go-to webinar chat box, please.
[00:22:45.710]
And I’ll just turn on my video here again.
[00:22:50.190]
<v Geoff>Hi, Kanita, it’s Geoff.</v>
[00:22:51.690]
Thank you very much.
[00:22:52.523]
That was great.
[00:22:54.300]
Just a couple of questions coming into the chat panel
[00:22:57.910]
and the questions.
[00:23:01.450]
First question:
[00:23:03.200]
Can I publish their whole data through ArcGIS online
[00:23:06.560]
or through Esri online?
[00:23:09.730]
<v Kanita>Yes.</v>
[00:23:10.563]
So one of the powerful things that
[00:23:13.443]
ArcGIS Pro is able to do, is connect to Esri online.
[00:23:18.410]
And so you’re importing in your drill hole data using
[00:23:21.505]
Target for ArcGIS Pro, that entire drill hole scene,
[00:23:25.540]
that entire 3D scene with your drill holes,
[00:23:29.300]
with your subsurface mesh data,
[00:23:31.810]
can all be taken into the Esri online environment.
[00:23:36.060]
Let me see if I have an example of that.
[00:23:40.250]
This one.
[00:23:42.170]
So here, I have a dataset published
[00:23:45.360]
to the Esri online environment,
[00:23:47.230]
and here I can see the lithology or, sorry,
[00:23:49.750]
I have the assay here,
[00:23:52.390]
the mesh data, the day site dike unit,
[00:23:55.190]
and this is a really cool feature
[00:23:57.690]
because it operates kind of like ArcGIS Pro on desktop,
[00:24:00.950]
but kind of stripped away functionalities.
[00:24:03.850]
You can start to do some really interesting things here.
[00:24:07.150]
You can start to create sections or slices
[00:24:11.330]
while you’re in this 3D view.
[00:24:13.970]
So really start to investigate your data without actually
[00:24:18.250]
having a license to the software.
[00:24:22.946]
I hope that answers the question.
[00:24:23.866]
(Kanita laughs)
[00:24:25.260]
<v Geoff>Yeah, thank you.</v>
[00:24:28.700]
Can you load data from different MX Deposit projects into
[00:24:32.370]
the same Target for ArcGIS Pro projects?
[00:24:37.177]
<v Kanita>Can you load data from</v>
[00:24:38.270]
different MX Deposit projects
[00:24:40.150]
into the same Target for ArcGIS Pro project?
[00:24:44.380]
Yes, you can.
[00:24:46.350]
So, one thing I did not discuss is the fact that
[00:24:51.400]
you can import multiple drill hole datasets into Target,
[00:24:55.410]
from one Target for ArcGIS Pro project.
[00:24:58.090]
So here, I have one project,
[00:25:00.240]
and so that’s that listed in this current dataset group.
[00:25:05.890]
So I only have one project, but if I wanted to,
[00:25:07.700]
I can add many other projects,
[00:25:10.020]
and then I could simply connect with the data input tool,
[00:25:13.953]
connect to MX Deposit, and bring in my MX Deposit projects
[00:25:19.033]
into each of my relevant Target ArcGIS Pro projects.
[00:25:23.450]
So in that way,
[00:25:24.470]
you could have one Target for ArcGIS Pro project open,
[00:25:29.170]
but you could have it connected to
[00:25:30.760]
multiple MX Deposit projects on the cloud.
[00:25:38.290]
<v Geoff>Excellent.</v>
[00:25:41.170]
One other question:
[00:25:42.610]
When importing drilling and sample data,
[00:25:45.660]
does Target for ArcGIS Pro re-project that?
[00:25:49.710]
How does it handle coordinates systems?
[00:25:52.860]
<v Kanita>So when you’re importing in,</v>
[00:25:56.900]
when you’re importing data from MX Deposit,
[00:26:00.240]
MX Deposit has its own list of grids.
[00:26:03.681]
They call them grids, or coordinate systems,
[00:26:06.410]
attached to different global projects.
[00:26:10.150]
The grids that are available on MX Deposit are also linked
[00:26:14.760]
to your Target for ArcGIS Pro
[00:26:17.670]
account, if you’re connected with your Seequent ID.
[00:26:20.040]
So when I was doing that import from MX Deposit,
[00:26:24.250]
it did list all of the available grids on MX Deposit.
[00:26:28.740]
I would simply then go ahead and choose the one
[00:26:30.720]
that’s relevant to my project
[00:26:32.660]
and apply it before I bring it into my project.
[00:26:35.440]
And of course, as we get fully coordinated aware,
[00:26:38.720]
you do have the ability to re-project coordinate systems
[00:26:42.860]
and things like that.
[00:26:44.300]
But you do get a list of all of the coordinates that are
[00:26:47.914]
available on MX Deposit before we bring that data in.
[00:26:55.270]
<v Geoff>Excellent.</v>
[00:26:56.700]
Maybe one more question.
[00:26:59.120]
Can I use my own color convention on the drill hole data
[00:27:02.750]
and adjust my symbology?
[00:27:08.003]
<v Kanita>Yes, you can use your own color code convention.</v>
[00:27:12.240]
You could do it in a couple of different ways.
[00:27:16.450]
So you have a preset convention for your drill hole project
[00:27:20.200]
or your rock symbology,
[00:27:22.386]
and you have a library of that in like a CSV file,
[00:27:26.098]
you could definitely bring that in.
[00:27:28.620]
We have an import symbology tool here,
[00:27:31.586]
which would allow you to bring in that symbology
[00:27:35.050]
either from a rock code file.
[00:27:38.220]
We do have a specific symbology, or specific convention,
[00:27:42.300]
for this kind of file,
[00:27:44.200]
or you could customize it yourself
[00:27:48.150]
within Esri because you’re given all of the
[00:27:49.993]
Esri symbology options.
[00:27:52.290]
You could customize it yourself, save it as a layer file,
[00:27:55.860]
and then, you know, if you wanted to share it,
[00:27:57.510]
you could pass that layer file on to a colleague,
[00:28:00.420]
and they would have access to the same kind of symbology
[00:28:03.340]
that you have used.
[00:28:05.800]
Alternatively, if you have multiple global datasets going
[00:28:08.850]
in the same project space, you can also cross reference
[00:28:13.061]
those databases and bring in the symbology
[00:28:15.720]
from another dataset.
[00:28:17.810]
So three different ways of doing it, but it is,
[00:28:20.210]
it is possible.
[00:28:23.030]
<v Geoff>Excellent, thank you.</v>
[00:28:26.128]
I don’t see any other questions coming in.
[00:28:30.710]
<v Kanita>Yeah, no problem.</v>
[00:28:32.610]
I am also available to take any questions by email.
[00:28:36.330]
If you think of them after the fact,
[00:28:38.180]
please go ahead and shoot me an email.
[00:28:40.250]
And as always,
[00:28:41.900]
there’s a lot of information available on my.seequent.com.
[00:28:47.150]
Have a great day.
[00:28:53.808]
(piano music)