


Learn innovative, next-generation capabilities of Target for ArcGIS - Import, visualize and share your geological knowledge within the powerful Esri ArcGIS Pro environment.
Target for ArcGIS Pro allows users even more flexibility and integration with tools in the Esri environment they are familiar with. Advance your understanding and find what’s hidden, faster!
- Import, visualize and interpret drilling data from standard industry data sources or generic formats
- View drillhole data by numeric or categorical attributes in 2D maps and 3D scenes
- Create cross sections to view and interpret your geology in 3D
- Incorporate subsurface datasets to your project for increased understanding and geological context
- Share and collaborate using Esri’s online workflows and Geospatial Cloud offerings
Overview
Speakers
Lisa Mcgregor
VP Global Marketing – Seequent
Sara Deschamps
Product Owner
Duration
50 min
See more on demand videos
VideosFind out more about Seequent's mining solution
Learn moreVideo Transcript
[00:00:03.247]<v Lisa>All right.</v>
[00:00:04.080]Hi everyone.
[00:00:05.230]Thanks everyone for joining.
[00:00:06.870]My name is Lisa McGregor.
[00:00:08.080]I’m the VP Global Marketing for Seequent,
[00:00:10.420]and we are coming to live today
[00:00:11.920]from Toronto and Montreal, Canada.
[00:00:14.880]In today’s webinar,
[00:00:15.790]we’ll be presenting the latest addition to the target family
[00:00:18.390]Target for ArcGIS Pro.
[00:00:20.030]I’d like to take a moment to briefly introduce Seequent
[00:00:22.290]and our partnership with Esri.
[00:00:24.500]Seequent is a world leader in the development
[00:00:26.160]of geoscience analysis, modeling
[00:00:27.940]and collaborative technologies
[00:00:29.770]for understanding subsurface, geoscience
[00:00:31.670]and engineering design solutions.
[00:00:34.120]Our solutions enable customers to analyze complex data,
[00:00:37.100]manage risk and ultimately make better decisions
[00:00:39.460]about earth environment and energy challenges.
[00:00:42.920]The Seequent portfolio includes Leapfrog, Geosoft,
[00:00:46.724]Geoslope and MX deposit across geological,
[00:00:49.810]geophysical, geo-technical
[00:00:51.660]and geoscience data management solutions.
[00:00:54.330]We serve customers in mining, civil environmental,
[00:00:57.270]energy and government sectors.
[00:00:59.810]Seequent is an Esri gold business partner,
[00:01:01.760]and we work closely to design, develop and launch
[00:01:04.010]new extensions and create essential workflows
[00:01:06.530]for geoscientists who wants to use their data
[00:01:08.500]in ArcGIS Pro by seamlessly integrating with tools
[00:01:11.360]from the Esri platform that many are already familiar with.
[00:01:15.220]Our partnership with Esri ensures that we can deliver
[00:01:17.550]interoperability that allows our customers
[00:01:19.560]to get the full benefit from both targets
[00:01:21.320]and as Esri ArcGIS, geoscience workflows,
[00:01:24.190]creating a world-leading end to end solution.
[00:01:27.290]Our speaker today is Sara Deschamps.
[00:01:29.380]She’s a product owner at Seequent,
[00:01:31.120]and she has been instrumental in the design
[00:01:32.880]and development of Target for ArcGIS Pro.
[00:01:35.900]So without further ado, please take it away, Sara.
[00:01:40.590]<v Sara>Okay, thanks Lisa.</v>
[00:01:42.300]Hi everybody, I’m Sara.
[00:01:44.640]And I’m just going to (clears throat) run through
[00:01:47.240]a little bit of a quick agenda today.
[00:01:49.630]So as Lisa said, we’re going to be introducing
[00:01:51.830]and showing a new product that we’ve just launched
[00:01:55.330]called Target for ArcGIS Pro.
[00:01:57.920]And this is an adding obviously for ArcGIS Pro
[00:01:58.875]that enables you to work with your drillhole
[00:02:02.230]and subsurface datasets in your GIS platform.
[00:02:06.040]So I’m going to start off a bit
[00:02:07.260]with a little bit of background.
[00:02:08.870]What is ArcGIS Pro and why are we building on top of it?
[00:02:12.860]I’m going to introduce the product itself,
[00:02:14.697]a little bit of an overview about it,
[00:02:17.060]and I’m going to get into a product demo
[00:02:19.140]and that’s going to take probably the majority
[00:02:21.270]of our time today, 25 minutes maybe 30 minutes,
[00:02:23.950]something like that.
[00:02:25.570]And then we’ll follow up with some Q&A,
[00:02:28.010]if you have questions as we go along, as Lisa said,
[00:02:29.990]you can put them into the chat box or the questions box
[00:02:32.070]at the bottom and we’ll look at those at the end
[00:02:35.200]and any, we don’t get to at the end,
[00:02:36.790]we can also follow up by email, okay?
[00:02:42.530]So I’m just starting off with a little bit
[00:02:44.970]of background here on what is ArcGIS Pro itself.
[00:02:48.230]We have a long history of building geoscience workflows
[00:02:51.540]on the previous ArcGIS Pro, which was called ArcMap,
[00:02:55.880]but really the future of Esri product
[00:02:57.740]as you know ArcGIS Pro.
[00:03:00.210]So you might’ve heard of ArcMap,
[00:03:01.655]you might’ve heard of ArcGIS or ArcGIS desktop even
[00:03:05.970]and sometimes that can be a little confusing
[00:03:07.390]there are a couple of different application names
[00:03:08.810]thrown around but both ArcMap and ArcGIS Pro
[00:03:14.660]are the two main desktop products developed by Esri,
[00:03:19.440]which is one of the largest
[00:03:21.660]GIS software providers in the world.
[00:03:24.520]So ArcMap is an older product
[00:03:26.370]it was released in 1999, about 20 years ago,
[00:03:30.495]it is a 32 bit product and it’s still being maintained.
[00:03:33.730]You can’t actively purchase it anymore,
[00:03:36.900]but and only critical bugs are being fixed
[00:03:39.830]and Esri has said that they are planning on
[00:03:42.200]retiring that product to the next couple of years,
[00:03:44.870]but there are still thousands of people
[00:03:46.950]who use ArcMap every day.
[00:03:48.020]So it is still a very popular,
[00:03:50.610]a little screen capture down there below
[00:03:52.490]in case you forgot what it looks like.
[00:03:55.540]On the other hand ArcGIS Pro,
[00:03:57.834]is the newer 64 bit version, it was released in 2015,
[00:04:01.680]but it was really in a kind of an extended beta
[00:04:03.550]for a couple of years.
[00:04:05.040]It became the primary application
[00:04:07.860]about two years ago in 2017
[00:04:10.110]and it is the defacto replacement for ArcMap.
[00:04:12.490]So going forward, everything that Esri is doing,
[00:04:15.936]is in ArcGIS Pro.
[00:04:19.080]This new product that we’re talking about today
[00:04:20.730]is also a replacement for an older product
[00:04:23.590]we previously had a drillhole extension for ArcMap
[00:04:27.470]called Target for ArcMap
[00:04:29.870]and our customers have long been asking us
[00:04:31.840]to create a similar solution for ArcGIS Pro.
[00:04:34.850]So that’s the product we’re going to be talking about today.
[00:04:39.790]But just a couple other reasons
[00:04:42.030]why we’ve chosen to build on top of ArcGIS Pro,
[00:04:46.170]there’s a number of reasons
[00:04:47.003]why this is an interesting platform for us
[00:04:49.490]it is modern and easy to use.
[00:04:51.160]It’s got a brand new Windows style ribbon interface,
[00:04:55.050]but it’s also easy to build on with new SDKs
[00:04:58.150]and developer tools that actually provides.
[00:05:00.500]It’s identity aware, that it knows who you are.
[00:05:02.750]It’s connected to the internet
[00:05:05.170]or to the Esri geospecial cloud
[00:05:08.350]and ArcGIS is online, which makes it really easy
[00:05:11.130]for sharing data, doing online mapping
[00:05:14.450]and cloud geoprocessing.
[00:05:17.830]Two of the most important reasons for us though
[00:05:19.860]one was it as a MultiMap project space, unlike ArcMap,
[00:05:24.210]which was more of a single map document
[00:05:27.490]you’re able to have multiple different Mac windows
[00:05:30.680]and 3D scenes all over at the same time,
[00:05:33.960]which makes it much easier to deal with things
[00:05:36.700]like multiple plan maps, section maps and 3D views
[00:05:40.330]that are very common in exploration workflows
[00:05:43.200]and the fact that it has the 3D scenes
[00:05:46.570]embedded inside of Pro instead of as a separate
[00:05:50.810]standalone application, the way ArcMap was.
[00:05:53.600]ArcGIS Pro was really a 2D
[00:05:55.410]and 3D mapping environment in one,
[00:05:59.050]which is really quite handy.
[00:06:01.080]So all of these differences together to make ArcGIS Pro
[00:06:04.650]really well suited for mineral exploration workflows
[00:06:07.970]and also an interesting platform to build on.
[00:06:11.540]So let’s have a look at our product
[00:06:13.413]that we’re talking about today, Target for ArcGIS Pro.
[00:06:20.120]So Target fort ArcGIS Pro helps geoscientists in mining
[00:06:23.660]and exploration who are using Esri’s ArcGIS Pro
[00:06:27.620]to display and work with drillhole and subsurface data.
[00:06:31.940]Target for Pro is a geological software extension
[00:06:34.780]that simplifies the importing, viewing
[00:06:37.460]and analysis of drillhole geological data
[00:06:40.410]within ArcGIS Pro.
[00:06:43.100]And it builds on our past successes
[00:06:44.760]of developing geological solutions
[00:06:46.670]for previous Esri products,
[00:06:48.270]which have become widely used and industry standards.
[00:06:55.050]Target for Arc Pro is intended to replace
[00:06:57.650]our previous product Target for ArcMap,
[00:07:00.630]but it is also significantly different.
[00:07:03.320]So our goal here was really to create similar workflows
[00:07:08.570]on the Pro platform, but not a carbon copy,
[00:07:12.060]not an exact replacement of Target for ArcMap.
[00:07:15.830]So to achieve this, we really focused
[00:07:17.850]on these five key areas that you see here
[00:07:20.960]around drillhole data, visualization and display.
[00:07:26.200]These areas are the kind of the cornerstones
[00:07:28.840]of the previous product
[00:07:30.950]but the overall approach we take in Pro
[00:07:32.730]has been very, very different.
[00:07:34.790]We’ve tried really hard to leverage the Esri data formats
[00:07:39.090]and the ArcGIS Pro tools much more extensively.
[00:07:43.350]So just a quick overview of some of these areas
[00:07:46.080]where you’re going to see most of the functionality today,
[00:07:49.540]lines up importing drillhole data
[00:07:52.570]from a variety of different formats and storing
[00:07:55.230]and managing that data in has we refiled your databases
[00:07:59.980]really simplified a drillhole visualization
[00:08:02.800]around displaying holes in 2D and 3D,
[00:08:07.290]really easy shortcuts for working with symbology
[00:08:09.640]and appearance of drillhole data.
[00:08:12.210]Creating cross-sections and creating multiple cross sections
[00:08:15.830]directly in your 3D scenes.
[00:08:18.960]Importing other subsurface data
[00:08:20.610]to add context to your drilling information.
[00:08:22.390]So subsurface measures and slices from voxels,
[00:08:26.660]things like that,
[00:08:29.050]and then finally sharing and collaborating,
[00:08:31.320]which is primarily using some of the Esri’s online workflows
[00:08:35.230]and the built in layout tools
[00:08:36.700]that they have for creating maps.
[00:08:38.940]So this is really the areas that the demo is going to cover
[00:08:42.140]as each of these areas here.
[00:08:46.730]And one last thing
[00:08:47.563]before we get into looking at the software,
[00:08:51.000]you may or may not have known that we had
[00:08:54.718]a previous add in that we’ve had about
[00:08:56.000]for a little over a year now,
[00:08:58.989]Geosoft data in for ArcGIS Pro and that’s been replaced,
[00:09:02.170]but the functionality that was in it
[00:09:04.540]is now a part of Target for ArcGIS Pro.
[00:09:08.465]So there are kind of a mix of some free tools
[00:09:11.440]and some licensed tools in this one product.
[00:09:14.450]So that means even if you don’t have a license for Target,
[00:09:17.230]you still can download it, install it,
[00:09:19.950]and you will have access to the tools that are listed here.
[00:09:23.400]So that’s GSF grid imports access to the data portal
[00:09:28.170]or the geoscience data portal.
[00:09:30.070]And two new ones that we’ve added in this release,
[00:09:32.610]which is the subsurface measure imports for OMF
[00:09:35.870]and Geosoft files and the 3D navigation tools,
[00:09:40.750]as well as the rest of first ones
[00:09:42.510]that were there before as well.
[00:09:44.290]So these are really interoperability type tools,
[00:09:47.350]gives you a way to kind of kick the tires off
[00:09:50.030]some of the tools that are in Target and have a look at it
[00:09:54.598]if you’re not already a licensed user.
[00:09:57.720]So with that, we’re going to jump into the demo
[00:10:02.980]and I’m going to switch over to ArcGIS Pro and or not.
[00:10:10.693](giggles)
[00:10:11.526]There we go.
[00:10:13.980]Here we go.
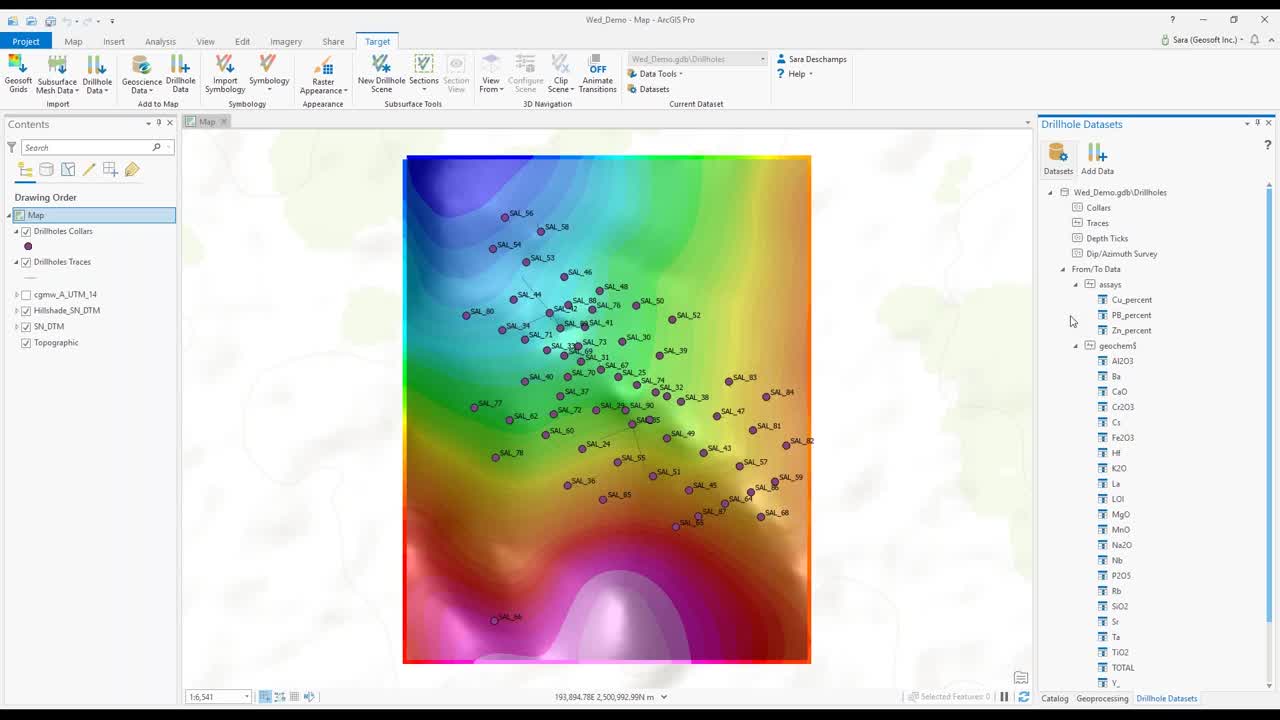
[00:10:14.813]All right, so hopefully that she has shown up
[00:10:17.970]on your screens already and what you can see here
[00:10:22.187]and here we are in ArcGIS Pro,
[00:10:25.500]you can see we’ve got a Target toolbar
[00:10:28.000]or ribbon that we’ve added in here,
[00:10:29.510]once we’ve installed Target for ArcGIS Pro,
[00:10:33.207]and there’s about eight different groupings of tools
[00:10:35.610]as we go across.
[00:10:36.443]We’ll just give you a quick overview of the toolbar,
[00:10:38.650]and then we’ll get into some of the actions and functions.
[00:10:42.760]So there’s eight main groupings here
[00:10:43.980]we got imports, add map, symbology, appearance,
[00:10:47.770]subsurface tools, 3D navigation, current data set,
[00:10:50.990]and then your profile and help.
[00:10:53.010]So with the imports, you’ve got things like
[00:10:54.590]Geosft grid imports, subsurface mesh data, drillhole data.
[00:10:58.470]So we’re going to be running a bunch of those.
[00:11:00.430]Add the map is where you would find
[00:11:02.625]your access to the geoscience data portal,
[00:11:05.430]as well as adding drillhole data to the map.
[00:11:08.020]Symbology is around drillholes symbology
[00:11:10.500]and importing saved symbologies
[00:11:13.170]or modifying and managing those.
[00:11:15.730]The rest of your parents tools are for,
[00:11:19.030]changing the rest of reference.
[00:11:21.550]Subsurface tools like creating new drillhole scenes,
[00:11:24.150]3D drillhole scenes,
[00:11:25.700]creating sections modifying and managing sections,
[00:11:28.930]viewing sections.
[00:11:30.100]The 3D navigation tools over here
[00:11:32.050]are kind of quick shortcuts for when you’re in a 3D scene,
[00:11:36.370]that is also a subsurface scene
[00:11:38.410]that can be a little clunky sometimes.
[00:11:40.430]So these are a few of these are mostly just shortcuts
[00:11:42.930]as to how to navigate more easily.
[00:11:47.510]The current dataset,
[00:11:48.680]if you’ve imported more than one drillhole data set.
[00:11:51.960]So from different sources
[00:11:53.220]or representing different time periods,
[00:11:55.480]and you can use this to manage that
[00:11:56.860]as well as data tools there
[00:11:59.590]and then your profile, your secret ID profile,
[00:12:01.870]and access to the help, getting started.
[00:12:05.010]If you want to send us an email
[00:12:06.240]and give us some feedback on the product, we would love it
[00:12:09.120]you can do that right there and check for updates.
[00:12:13.740]One more note and I’m going to say about the toolbar
[00:12:15.920]before we get started.
[00:12:17.190]You’ll notice that some of the tools are kind of grayed out
[00:12:20.530]as I go along here and there’s a couple of reasons
[00:12:22.250]that could happen one would be if you’re not signed in.
[00:12:26.400]So you can see, I am signed in there’s my name,
[00:12:28.300]but if you were not signed in,
[00:12:29.280]you would see all the tools would be grayed out
[00:12:30.983]unless you are signed in and in that case, we should do so
[00:12:33.960]because you have to be signed in.
[00:12:36.380]Another case would be is
[00:12:37.530]if you don’t have a license for Target,
[00:12:39.630]you would see some of them grayed out
[00:12:41.117]and some of them would be lit.
[00:12:42.980]The ones that would be available would be the free tools
[00:12:45.067]and the ones that would be grayed out
[00:12:46.110]would be the license tools.
[00:12:47.810]And the other case that you might see is if you haven’t done
[00:12:51.740]one of the necessary steps.
[00:12:54.080]So if you haven’t done something that is needed to do
[00:12:57.490]to use the tools and it’s not going to let you use that tool
[00:12:59.920]and if you just hover over any of these grayed out tools,
[00:13:02.110]you’re going to see the lower half of the tool tip
[00:13:04.590]says that this is disabled
[00:13:06.170]and it says why in this case, it needs a 3D scene
[00:13:10.460]and the case of this tool over here,
[00:13:12.300]it requires the drillhole data needs to be imported.
[00:13:14.860]So anytime you’re looking at the tools here,
[00:13:17.750]if you see them grayed out, just check that tool tip,
[00:13:20.240]and it’s going to tell you what,
[00:13:22.060]why it’s disabled and what you can do about it, okay?
[00:13:26.444]So I’m going to start by importing some Geosoft grids
[00:13:31.110]and this is one of the free tools
[00:13:34.970]that’s available to everybody.
[00:13:36.770]If you’ve got Geosoft grids and you want to bring those in.
[00:13:40.300]So I’m going to bring in a couple here called regional mag,
[00:13:43.467]and local elevation grid, I’m going to bring those in.
[00:13:47.500]There’s a couple of reasons why you might want to start
[00:13:49.910]by bringing in some background data
[00:13:52.330]this could be mag or gravity,
[00:13:53.800]it could be elevation or geochemistry.
[00:13:55.610]It helps you to set the context of your project area,
[00:13:59.533]but it also helps by setting up
[00:14:00.730]the corner system of your map
[00:14:02.640]and zooming you into the area where you might be working.
[00:14:05.960]So there’s a couple of nice things you can have there
[00:14:09.720]you’ll notice that the colors come in the way they were set
[00:14:12.360]in other Geosoft products and would always this montage,
[00:14:15.250]those colors are honored and I could change those
[00:14:18.100]if I wanted to using those roster appearance tools.
[00:14:24.090]For the…
[00:14:28.935]Let me zoom into the little elevation grade that I’ve got
[00:14:35.180]this is a right around the area where my drillholes are
[00:14:37.670]and I can try that to rest your parents tool there
[00:14:42.710]and I can run a quick hill shade and it’s going to add on
[00:14:46.040]a nice little hill shade layer for me as well.
[00:14:48.870]So I’m going to start by importing some drillhole data
[00:14:51.310]now I’m in the area where those drillholes are
[00:14:53.167]and I got my coordinate system all set up on my map,
[00:14:56.270]and I’m going to go through and import some drillhole data.
[00:14:58.900]So there’s a few different options here
[00:15:00.380]for importing drillhole data
[00:15:03.170]we’ve got our more generic formats or sources on top,
[00:15:06.330]on our more specific formats below.
[00:15:08.300]So I’m starting off with Excel or Access, ODBC connections
[00:15:12.860]and good old textiles, followed by acquire, Annex deposit
[00:15:18.010]and Target projects, that would be if you’re working with,
[00:15:21.960]if you had been working in the previous version of Target,
[00:15:23.970]you could bring that data across fairly easily
[00:15:27.720]but I will start with the Excel and Access.
[00:15:31.650]This is probably one of the more common formats
[00:15:33.670]and a lot of people have.
[00:15:36.515]And because I brought in that data,
[00:15:39.220]I can just grab my special reference from recorded system,
[00:15:41.930]from the map or from the grid that I brought in
[00:15:46.690]and I’m going to go look for my drillholes
[00:15:49.290]in an Excel spreadsheet.
[00:15:52.120]And here I’m going to go through,
[00:15:55.150]I’m going to choose my color data.
[00:15:56.850]I’m going to choose my survey data and then any of my,
[00:16:02.250]from two data tapes and any of my point data types
[00:16:10.560]and I’m going to go ahead and say rent.
[00:16:12.140]So these would be my interval data sets, my point data sets
[00:16:15.670]and I’m going to go ahead and say, run, I’m going for that.
[00:16:19.166]So what you’re going to see here is a little bit of a wizard
[00:16:22.160]this is going to go into check
[00:16:23.450]if all the required fields are present
[00:16:26.010]and in this case, I’m missing one,
[00:16:28.020]I’m missing my total depth and it tells me
[00:16:30.450]down here what’s missing.
[00:16:31.760]So I’m just going to say that’s my end of all my likes value
[00:16:35.667]and I can have a quick look at the other datasets
[00:16:38.180]since the survey, from two datasets, the point datasets,
[00:16:41.570]but they all say ready to import.
[00:16:43.760]So they’re all fine.
[00:16:44.710]So just a quick check there
[00:16:46.230]to see that the required fields are present
[00:16:50.700]and as this is running, I can pop up in the,
[00:16:54.370]a little dialog here.
[00:16:55.203]It’s going to give me a bit of a progress update
[00:16:57.330]as we go along but I can also flip over to the catalog
[00:17:01.190]and I can have a look at what’s going on in the catalog
[00:17:04.310]and this gives me a chance to tell you
[00:17:05.980]what’s happening behind the scenes.
[00:17:07.560]So you can see here, we’ve got a feature dataset
[00:17:11.170]and for anybody who’s maybe not familiar,
[00:17:13.060]a feature dataset is just a collection of feature classes,
[00:17:17.730]feature classes, the more recent equivalent to a shape file.
[00:17:21.340]So you’ll have a point feature class
[00:17:22.830]instead of a point sheet file
[00:17:24.060]and aligned feature glass instead of a line Geosoft
[00:17:27.130]and as you can see here,
[00:17:27.963]we’re starting to populate that drillhole dataset
[00:17:32.160]with things like the colors, the traces, the depth sticks
[00:17:36.530]and if I give us a little refresh,
[00:17:38.820]we should see that it more tables and more future classes
[00:17:41.930]start showing up as the import goes along.
[00:17:45.780]So the things like the traces and the depth sticks
[00:17:49.870]are data sets, they’re being calculated.
[00:17:53.281]So via the D surveying process
[00:17:55.340]where we take the color points
[00:17:56.950]and the depend of the survey points,
[00:17:59.690]we calculate those traces for you
[00:18:01.320]and bring those into the dataset as well
[00:18:05.670]and the same goes for the depth sticks.
[00:18:11.677]And you also see that we’ve got a couple
[00:18:12.810]of relationship classes here,
[00:18:14.130]which kind of helps to tie all the information together
[00:18:19.250]and in that dataset, so that each of those different layers
[00:18:24.350]to know about each other,
[00:18:28.430]and we should be almost done.
[00:18:30.500]You might also see something like this pop up
[00:18:34.610]in a yellow text during that import,
[00:18:37.800]we run some QA, QC checks
[00:18:40.800]and if there are any warnings or discrepancies found,
[00:18:44.150]it’s going to tell you using these kind of yellow text
[00:18:46.330]with a little exclamation point.
[00:18:49.130]In this case, the geochemistry table came in
[00:18:52.820]and there was a hole with data in the geochemistry table
[00:18:56.580]that was not in the color dataset.
[00:18:58.080]So I’d want to go and check that out
[00:19:01.690]in my Excel spreadsheet there and figure that out
[00:19:05.340]but it tells me that it’s succeeded and it finished
[00:19:07.730]and there’s a couple of warnings
[00:19:09.040]that I want to go check out, so that’s fine
[00:19:12.116]and a couple of things have happened
[00:19:13.540]once the import is done you’ll see that my colors and traces
[00:19:18.470]have been added to the active maps that I was looking at
[00:19:21.790]and it’s opened a drillhole datasets
[00:19:24.317]and the panel over here,
[00:19:25.670]which shows me the contents of that dataset.
[00:19:33.020]This drill hole dataset here is,
[00:19:35.950]it’s just kind of a friendlier way of looking at the data
[00:19:38.970]than what we might see in catalog
[00:19:40.670]not everyone is super comfortable with catalog,
[00:19:43.000]and we can’t control the order of how these tables appear
[00:19:48.687]in catalog, but we can kind of pretty add up
[00:19:51.333]a little bit over here.
[00:19:52.640]So we can see the GDB and the data set name,
[00:19:55.620]but we can also kind of order or organize the data
[00:19:58.380]in a way that makes sense and then group from two datasets
[00:20:01.627]and the point datasets together.
[00:20:03.770]The other thing that we can do here is that we’ve actually
[00:20:05.860]allowed you to dig down or explore into each
[00:20:09.790]of the feature classes and to see the attributes
[00:20:13.910]that are in there.
[00:20:14.743]So you can see which attributes are available to you to use
[00:20:18.130]when you’re doing things like displaying the data
[00:20:19.810]and you want to symbolize it.
[00:20:24.020]So this is one way that you could actually
[00:20:26.030]start to add data onto the map.
[00:20:28.390]You could do something like just grabbing copper
[00:20:30.530]by the name of the attribute and dragging it
[00:20:32.890]right onto the maps and all the student enrollment
[00:20:36.840]and turn off my map data there.
[00:20:38.740]So you can see it a little bit better.
[00:20:40.130]So there’s my assays feature class,
[00:20:43.160]but it’s been automatically symbolized
[00:20:45.190]by the copper values.
[00:20:47.565]So that’s kind of a handy way to do things
[00:20:49.350]if you compare to what might happen,
[00:20:51.190]if you were to do the same thing from the catalog.
[00:20:59.850]If I drag and drop that layer,
[00:21:01.800]same assets layer it just comes in looking like a line
[00:21:04.110]and then I have to go through all the steps
[00:21:05.490]of having to symbolize that myself.
[00:21:10.180]So I’m going to just take those guys away, so I can do that.
[00:21:14.060]I could go through the drill hole datasets tab here,
[00:21:17.080]and I could drag and drop individual layers
[00:21:19.890]and add them to my map
[00:21:21.290]but another way of adding data to the map
[00:21:23.820]would be to come up here
[00:21:24.700]and press the add data button for drill hole data
[00:21:27.100]and I can add in any of the different types of data sets,
[00:21:31.570]I can select multiple different values or attributes
[00:21:38.230]and ask to have all of those added to the map at one time.
[00:21:45.380]Oh, just the methodology.
[00:21:46.758](laughs)
[00:21:56.230]So then we’ve got some depth sticks
[00:21:59.500]I’ve added in a couple of different geochem values
[00:22:02.110]and asset values and all of those
[00:22:05.610]are showing up nicely on my map
[00:22:11.700]there’s a bunch of things that you can do here.
[00:22:14.000]So this ad data tab, but just as kind of sum up,
[00:22:18.030]you can add on a number of different layers all at one time
[00:22:22.640]and any of the layers that you add via this tab here
[00:22:26.630]will get automatically symbolized for you
[00:22:28.610]so you don’t have to go through
[00:22:29.443]all the steps of symbolizing them.
[00:22:30.840]Now you might not love the symbology
[00:22:32.240]that we choose for you by default,
[00:22:33.910]but that’s where the symbology tools come in.
[00:22:36.130]So there’s a number of ways
[00:22:37.110]in which you can import symbology
[00:22:39.100]that these might be something that you’ve predefined
[00:22:42.150]either as a layer file or as a CSV.
[00:22:45.750]You can also do things like modifying the symbology
[00:22:50.722]and I’ll just show that with the copper values here.
[00:22:57.060]These are kind of a bit of a way
[00:23:00.312]of getting at a more of a drill hole standard kind of view.
[00:23:06.770]So you might think of something like a histogram view
[00:23:09.350]that you might see for assay data
[00:23:13.160]just make that a little bigger maybe that’s too many.
[00:23:16.190]There you go.
[00:23:17.130]So you can see making that kind of histogram view
[00:23:19.810]for my copper data.
[00:23:21.830]So these modify really customized symbologies
[00:23:25.670]that are a little tricky to do,
[00:23:27.640]or in some cases impossible to do
[00:23:29.460]with the regular ArcGIS Pro symbology tools
[00:23:33.240]and just to note that,
[00:23:34.500]because all this data’s being stored in future classes,
[00:23:38.890]you can just start clicking on any of those bars
[00:23:41.880]it’s going to tell you what the drill hole is,
[00:23:44.030]It’s going to tell you the from into it will go
[00:23:46.240]and the attribute values that are associated there.
[00:23:56.757]A couple of other things you can do here, if you want to,
[00:23:59.320]you can define or set up a default symbologies
[00:24:03.290]and I’m going to show an example of that little later on
[00:24:07.330]and another example of some of those,
[00:24:09.040]some of the other modified tools that you can use as well.
[00:24:13.290]And what that means is that when you’ve preset
[00:24:16.890]your own defaults,
[00:24:18.050]when you do add drill hole data to the maps,
[00:24:21.080]they’re going to come in using those defaults
[00:24:24.560]that you’ve specified instead of the ones
[00:24:26.250]that we’ve specified, okay?
[00:24:33.260]I’m going to go on in,
[00:24:34.640]we’re going to make a drill hole scene
[00:24:36.660]and you might notice that I’m moving
[00:24:38.720]in a general left to right fashion across the ribbon here.
[00:24:43.680]Making this little drill hole scene
[00:24:44.900]really just does a couple of things for you,
[00:24:47.590]it makes a local scene, which you can tell,
[00:24:50.070]because it’s using that whole buildings icon.
[00:24:53.200]It adds the drill hole colors
[00:24:55.310]and the drill traces traces for you
[00:24:56.930]and it kind of orients you so that you’re looking at it
[00:24:58.770]from a little bit under the ground.
[00:25:01.050]This is really the same as doing something like this,
[00:25:03.290]where you’d go here and say, add a new local scene
[00:25:06.050]and then add some drill hole data to it
[00:25:09.660]and also we run this little configure guy,
[00:25:11.460]which just sets a couple of the settings
[00:25:13.070]to make it a little easier to view the drill holes.
[00:25:17.590]So they’re got my drill holes in 3D, which is great.
[00:25:23.170]The one thing is that I’m kind of stuck
[00:25:27.657]in this weird problem where I’ve got these great base maps
[00:25:35.290]that are just one of the cool things that I just brought
[00:25:37.750]but he’s great base maps, I can use, satellite imagery
[00:25:42.660]or I can use typography or terrain,
[00:25:46.150]and it’ll just grab those off the internet
[00:25:48.440]and load them for me and that’s super sweet, but they just,
[00:25:50.980]they kind of go off into the horizon forever.
[00:25:53.690]So it makes it really hard for me to see my drill holes
[00:25:57.610]underneath the surface of the earth right.
[00:26:00.500]So there’s a couple of things that we’ve done over here
[00:26:02.530]in the 3D navigation grouping,
[00:26:06.130]where we’ve added a couple of tools to help you
[00:26:09.090]work a little bit easier in those 3D scenes.
[00:26:14.830]The first one here that I’m running is the clip scene
[00:26:18.920]to drill hole extents.
[00:26:22.130]So I’m just going to Zoom in a little view from the top.
[00:26:28.350]So what I’ve got now is I’ve actually clipped
[00:26:30.710]the extent of my 3D scene,
[00:26:31.970]so that they’re just a little bit bigger
[00:26:33.760]than my drill holes and that’s kind of handy.
[00:26:39.100]If you wanted to make it a little bit of a bigger area,
[00:26:41.270]you can use the other option here,
[00:26:42.630]which is called draw clip area,
[00:26:44.710]and you can draw your own box
[00:26:46.480]and that’ll change the scene clipping to be to that area
[00:26:50.643]that you just drew.
[00:26:54.880]And you might’ve noticed that I use
[00:26:59.560]one of these view from options while I was moving around.
[00:27:03.070]These are basically just facial bookmarks
[00:27:06.430]that you can use to reorient the view
[00:27:09.860]or to change the view so that you’re viewing it from
[00:27:13.820]a different angle or a different perspective.
[00:27:17.330]If you find that the changes in scene
[00:27:21.670]are a little bit too jumpy,
[00:27:23.090]you can turn on the animated transitions,
[00:27:25.830]and this’ll kind of swing you around
[00:27:27.590]as you do those view changes, which some people like,
[00:27:31.320]’cause it gives them a bit more context
[00:27:32.780]as to where they are looking now,
[00:27:35.240]as opposed to where they were looking before
[00:27:37.630]some people don’t in which case we can turn it off.
[00:27:43.926]I think that’s all I’m going say about the 3D NAB stuff
[00:27:46.100]as can handle tools in there.
[00:27:50.954]I’m going to throw on a couple,
[00:27:52.220]maybe one or two more pieces of data throw in my,
[00:27:56.218]some of my assays and we can see
[00:27:58.870]what we’re working with here in 3D scene.
[00:28:01.220]So again, that ad data tool just lets you
[00:28:03.900]quickly add some of the attributes
[00:28:08.041]or the income of the data values onto the map.
[00:28:12.390]So that you can see what’s going on
[00:28:17.160]and there’s no copper values just trying to show up
[00:28:21.370]and I’m going to start by we’ll start by
[00:28:25.090]getting into creating some sections and have a look at that.
[00:28:29.410]So I’m going to go to our create section tool
[00:28:33.150]and I will start by drawing a section
[00:28:36.920]on the current map.
[00:28:39.240]I just start by first drawing a line
[00:28:42.510]and dragging that out to make a little box
[00:28:45.200]and we’ll turn off my base map
[00:28:46.340]so you can see a little bit easier
[00:28:49.070]and what you see is we actually just have a kind of a box
[00:28:51.700]defined in the 3D scene
[00:28:56.950]and if I want to, I can click the scene extents there
[00:29:02.180]to see which holes are inside that section
[00:29:05.560]and which holes are outside that section.
[00:29:10.400]I can move that section around if I want
[00:29:13.860]or I can also just save it as it is.
[00:29:15.407]I’m going to go through this process one or two more times,
[00:29:17.560]I’ll show you a few things about creating sections.
[00:29:22.490]So here we’re going to go through it again.
[00:29:23.750]It flips me around to the top
[00:29:25.620]and draw another section location there.
[00:29:30.590]Sometimes I get a box that’s a little bit different
[00:29:32.410]than what I thought I was going to get
[00:29:33.640]and there is a couple of different modes here
[00:29:36.620]in ArcGIS Pro there’s a thing called perspective
[00:29:39.600]and I think a parallel
[00:29:41.320]and if you use parallel while you’re doing this sections,
[00:29:45.640]you’re much more likely to get more of what you expected
[00:29:51.680]when you drove the box.
[00:29:52.970]So we put a little shortcut button right here
[00:29:54.800]that lets you change between parallel perspective
[00:29:57.750]and there’s some other words for that and other stuff
[00:29:59.990]for those two different units, but they’re pretty common.
[00:30:03.140]So here we’ve got another section and I can adjust.
[00:30:06.670]I can adjust things like the thickness
[00:30:11.450]and the size of that box will change.
[00:30:14.610]I could adjust the length and get a little bit longer.
[00:30:19.060]I can adjust the height.
[00:30:20.150]I can also move it around if I wanted to in the direction
[00:30:24.500]that is perpendicular to the section
[00:30:29.120]or I could adjust the Eastern
[00:30:31.190]and Northern center point of that if I wanted to,
[00:30:35.630]and I’ll go ahead and save back as well.
[00:30:38.450]Now I’m going to make one more,
[00:30:41.510]maybe one more like a long section and,
[00:30:52.939]play around to the assay till you see that changes
[00:30:56.340]the orientation of the section line.
[00:30:59.700]So each of those parameters can be adjusted dynamically
[00:31:02.410]or by using the values and there’s also an option in here
[00:31:07.370]for creating multiple sections.
[00:31:12.110]So if I do one last one here and I draw a nice long section
[00:31:17.550]at one end, I should be able to create
[00:31:25.520]a set of offset sections and see those
[00:31:28.640]as they would space out down the dataset
[00:31:37.130]or across the whole project.
[00:31:40.040]So something like that.
[00:31:41.667]And you can see if I get my space and just right,
[00:31:43.710]I’ll be able to hit each of those groupings like that.
[00:31:49.830]Let me say that going the name like series
[00:31:54.320]and say that and I’ll get a set of five sections
[00:31:57.780]that run across that whole project.
[00:32:01.570]Now you might notice that now I’ve got
[00:32:02.730]a whole bunch of sections
[00:32:03.770]and I can each time that I’ve saved one,
[00:32:05.420]I land here in the manage tab and I can see all the sections
[00:32:08.503]that I have and I can turn them on and turn them off.
[00:32:11.640]If I don’t have them to like one, I can delete it
[00:32:18.120]and if I want to rename them, I can do that too.
[00:32:22.900]So I call this one long section and that’d be fine.
[00:32:28.836]So there’s a bunch of different things you can do in here
[00:32:30.770]with the manage sections tab.
[00:32:33.650]You might also want to change the order
[00:32:35.100]that they’re sorted in directionally,
[00:32:37.210]often numerical creation
[00:32:39.120]and the reason why you weren’t going to change that
[00:32:40.633]is when we start to get into viewing sections,
[00:32:44.280]the order becomes important.
[00:32:47.260]So one of the heroes I’ve just launched the section view,
[00:32:49.750]which keeps me in my dribble scene, that same 3D scene,
[00:32:53.620]but it brings up an extra control panel
[00:32:56.630]that lets me view each of those sections that I’ve created.
[00:33:01.100]So with this little dropdown here,
[00:33:02.790]I can see each of those sections
[00:33:04.940]and I can flip from one section to the next
[00:33:09.240]and investigate all the way through that drill hole project,
[00:33:15.800]by viewing those different sections.
[00:33:18.900]I can flip from the front to the back
[00:33:21.210]and see it from the top and the bottom, if I want to,
[00:33:24.610]and there’s a number of other little handy things
[00:33:26.750]you can do in here.
[00:33:28.140]This same section view also works in the layout tools.
[00:33:36.190]So I’m going to show that in the next little example,
[00:33:41.779]when you want to actually make something
[00:33:42.970]that you can print out.
[00:33:45.580]So that’s the way you can view sections
[00:33:48.050]and whatever you’ve got,
[00:33:49.260]whatever you’ve got displayed in your contents of your scene
[00:33:53.590]is what you’re going to see showing up on that section.
[00:34:02.240]Yeah, I’m going to flip to a project
[00:34:03.960]that I’ve got already pre-made
[00:34:06.530]that’s got some slightly prettier examples of things in it
[00:34:10.740]and I’m going to show you a few,
[00:34:13.530]just a few examples of things
[00:34:14.910]that would have taken me slightly longer
[00:34:18.630]to whip up on the floor.
[00:34:24.040]As it loads here I’ll give you an idea of some of the things
[00:34:28.440]we’re going to look at there’s a bunch of different
[00:34:31.600]symbology things that you can do.
[00:34:35.290]So I wanted to kind of run through those quickly
[00:34:37.050]so you get a sense of what they are.
[00:34:39.820]I wanted to show that you can import section oriented grids
[00:34:44.720]and the sub-service mesh status,
[00:34:47.050]I’m going to show all those things
[00:34:48.000]and then we’ll have a look at how that works
[00:34:49.890]with that section viewer that we were just looking at
[00:34:53.630]’cause I think that’ll be hopefully interesting to you guys.
[00:34:58.820]So to start off with, we’re just going to look at
[00:35:03.264]the plan B here the drill holes.
[00:35:04.980]You’ll notice here, I’ve got a couple of different maps,
[00:35:07.150]a little inset maps, some geophysics,
[00:35:10.010]and using that hill shade some geology over here
[00:35:13.277]and those will get used on the layout
[00:35:14.830]I’m going to show you a couple of seconds
[00:35:17.370]and just as a reminder, in case I had forgotten
[00:35:19.930]to show it the histogram bar plot kind of appearance
[00:35:23.290]that you can do for drill holes in plan view is quite handy
[00:35:29.690]and the fact that you can also do those
[00:35:32.450]using two different values.
[00:35:33.990]So here on this one, you’ll see that they’re are colored
[00:35:37.490]by in this case zinc but sized by copper.
[00:35:40.620]So you’ll see something like there
[00:35:42.510]where you got a high copper value, but a lower zinc value
[00:35:45.440]also that you’re going to offset the lithology
[00:35:48.200]down the side of the drill hole trees
[00:35:50.810]and to get it out of the way a little bit.
[00:35:53.420]And flipping over into the 3D scene
[00:35:56.330]there’s the lithology which I mistakenly forgot to import
[00:35:59.240]on the first go around, along with the depth sticks
[00:36:02.290]in case I didn’t show those
[00:36:03.300]so those are the sort of depth ticks
[00:36:04.670]that we calculate for you.
[00:36:06.590]So lithology just as tubes and that’s one of the things
[00:36:13.560]that is quite useful with the symbology tools,
[00:36:16.370]is that you might want to import your rock codes
[00:36:20.860]and then save that as a part of your project.
[00:36:23.280]So that’s how I was able to get those colors on there
[00:36:26.510]that’s quite a handy tool for the symbology.
[00:36:30.710]The other thing I’m going to show over here
[00:36:32.260]is kind of a view of what you might call proportional disks,
[00:36:40.010]I guess, so proportional sized asset values.
[00:36:43.400]So in this case we’re looking at copper values
[00:36:45.660]where the higher values have been made to be larger
[00:36:50.100]than the rest of the assay values.
[00:36:52.440]So that’s a pretty common, I would say,
[00:36:54.090]pretty common drill hole symbology
[00:36:57.281]and a lot of these things you can create
[00:37:00.210]using this modified symbology tool here.
[00:37:03.220]And the last one here that I’ll show
[00:37:04.830]that’s a symbology related item
[00:37:07.010]is oriented disks for structural data.
[00:37:11.390]So you can see here, I’ve got some structural data
[00:37:14.710]that was alpha beta and if I needed to convert
[00:37:19.180]alpha betas into dip and deep end direction,
[00:37:21.340]I can use this tool over here to do so,
[00:37:23.880]and that I can plot those oops,
[00:37:28.640]can plot those guys as a kind of oriented discs
[00:37:31.210]is what we call them in here
[00:37:33.020]and you can have them color coded by the type of structure
[00:37:35.070]are showing oriented based on the different
[00:37:37.590]dip direction values.
[00:37:39.520]So just trying to show a couple
[00:37:40.500]of different symbology options
[00:37:41.730]that would have taken me a few too many minutes
[00:37:43.790]to create them on plot.
[00:37:46.940]The next thing I’m going to show here is one of the ways
[00:37:50.520]that you can visualize block model data or voxel data.
[00:37:57.128]Here it goes, I do want it transfer it.
[00:38:03.890]So here’s a couple of slices that came out of a voxel.
[00:38:08.140]Right now ArcGIS Pro doesn’t have a file format
[00:38:12.270]that is something that can store voxel or block mental data
[00:38:17.027]and they don’t have something in the file geodatabase
[00:38:19.250]a future class or anything like that
[00:38:20.550]to store this type of data
[00:38:22.130]but what we can do is we can extract out slices
[00:38:26.040]and we can do that in to your soft or target or the viewers
[00:38:29.550]and we can bring those slices directly in,
[00:38:32.630]and that’s just using this one of the free tools,
[00:38:34.690]the geoseparate tool,
[00:38:36.920]if it’s a section it’ll pop into 3D in its proper spot
[00:38:41.020]and its correct location and it just shows up like that.
[00:38:45.840]We’re working on trying to find a nicer solution
[00:38:49.250]to this right now.
[00:38:51.970]The other thing of data that you might have
[00:38:53.310]that you might want to bring in is something like
[00:38:55.490]one of these subsurface meshes.
[00:38:56.810]So we’ve got the Geosfot subsurface file
[00:38:58.900]and we’ve got the OMF file which is a open mining format.
[00:39:02.540]And that’s one that you can export straight out of leapfrog,
[00:39:05.730]that OMF file and what that’s going to bring in for you
[00:39:09.910]is usually something that looks like a,
[00:39:12.120]so that looks like this right here,
[00:39:14.550]which is commonly used for geological models or wire frames,
[00:39:21.200]or it could even be great shells or ISO surfaces
[00:39:25.811]and that’s the way that you can bring that data in.
[00:39:28.520]These will come in as a multi-pack feature class
[00:39:33.382]and then you can use those as well
[00:39:34.730]and any tool that would take a multi-pack
[00:39:37.640]to reach your goals.
[00:39:40.558]So what I’m going to do now
[00:39:41.391]is I’m just going to pop a few layers on
[00:39:44.450]and I’ll go back to that section view
[00:39:49.090]and have a look at how that looks and section view now.
[00:39:53.640]So you can see with some of those,
[00:39:57.770]the drill hole lithology turned on
[00:39:59.510]and that geological model we’re getting a slice
[00:40:02.410]through that as well and in cases where
[00:40:06.330]we had that box we’ll slice,
[00:40:08.620]you’ll see that sharp as part of the background as well
[00:40:11.860]and if I wanted to change the datasets
[00:40:15.680]that are being displayed in the section,
[00:40:18.960]I just change what is turned on and turned off
[00:40:21.340]in the contents paint over here.
[00:40:25.230]So there’s a section with a slice of a geological model
[00:40:27.830]and some proportionally sized asset values.
[00:40:33.290]The last thing that I wanted to show,
[00:40:37.510]last thing I want to show here
[00:40:38.590]is really what you can do
[00:40:41.000]with the layout views in ArcGIS Pro.
[00:40:43.850]So the layout tools are something that comes standard
[00:40:46.920]as part of Pro and it’s really how you would build
[00:40:49.968]a large map or a map that you might print out
[00:40:52.960]or send as a PDF, I’m just going to hold up this
[00:40:57.510]to make it look a little bit bigger.
[00:41:00.640]And so here’s a layer of that same kind of project area
[00:41:03.790]with a plan view and my little inset maps
[00:41:06.150]and a bit of a detail on a couple of interesting dribbles
[00:41:08.610]and then my section view
[00:41:10.670]that I was just looking at right there
[00:41:13.250]and all this stuff is built just using the new layout tools
[00:41:18.770]in ArcGIS Pro so it could go to the the layout tab
[00:41:22.630]and using all those tabs there
[00:41:24.450]and all the tools on that layer tab there.
[00:41:27.800]And I’ll show you what that looks like when the PDF it
[00:41:33.460]give you a sense of what that might look like
[00:41:36.970]if you were to try and print it out.
[00:41:47.100]So this is really these layers would be
[00:41:49.260]how you would go ahead and build any of your map views,
[00:41:52.590]sharing that data is just a slightly different version
[00:41:55.047]that I did the other day
[00:41:56.590]and sharing that data for either for print
[00:41:59.000]or for publication, or as a poster at conference
[00:42:01.890]or things like that and that’s what that layout view
[00:42:08.260]would look like in a PDF.
[00:42:11.080]Another really cool way that you can share data
[00:42:13.470]with ArcGIS Pro is to share it as a website,
[00:42:17.890]and this is going to take something like either a 2D map
[00:42:20.706]that you’ve got, or a 3D map, 3D scene
[00:42:23.367]and it’s going to take you up to ArcGIS online
[00:42:32.620]and opening up that web scene here.
[00:42:36.920]And just see the same data set and a what of your,
[00:42:44.150]and those, what would they go?
[00:42:46.958](giggles)
[00:42:51.360]There you are.
[00:42:54.010]As you can see the same drills
[00:42:55.730]and that same geological model that we imported
[00:43:00.850]and even the slice of the box is in there as well,
[00:43:08.810]I do think.
[00:43:09.690]So all that data that was in that 3D scene
[00:43:12.759]was just a couple of clicks and a few minutes is up
[00:43:14.880]in a web browser that you can then share
[00:43:18.200]with anyone that you want to.
[00:43:21.320]Okay.
[00:43:24.400]I think with that, we will jump back to the slides
[00:43:30.130]and just get wrapped up.
[00:43:36.030]And so just a bit of a, I guess, more of a summary here,
[00:43:40.150]some of the things that we showed today, importing viewing,
[00:43:45.520]analyzing all your drill holes in ArcGIS Pro.
[00:43:49.090]Till now there’s been no way really
[00:43:50.820]to work with drill hole data and ArcGIS Pro.
[00:43:55.010]So that’s the thing right there.
[00:43:58.450]And the theories that we showed
[00:43:59.340]they’re really about importing,
[00:44:01.420]displaying those drill holes in 2D and 3D
[00:44:04.000]and creating cross sections and multiple cross sections,
[00:44:08.250]bringing in other datasets,
[00:44:10.020]whether they were subsurface or slices
[00:44:13.320]and then some of those sharing and collaborating workflows
[00:44:16.210]with the online and lit.
[00:44:18.450]The other thing to say here is,
[00:44:19.760]I guess we tried really hard
[00:44:21.380]to build this as an integrated, as a solution
[00:44:25.530]and we feel like we’ve achieved on that.
[00:44:31.420]It’s not always easy to take a workflow
[00:44:33.340]and try to bring it into something
[00:44:34.830]that it wasn’t exactly designed to do.
[00:44:37.220]So that’s where we really tried to focus
[00:44:40.450]and you are able to use all those ArcGIS Pro tools
[00:44:43.390]if you want to, you can just,
[00:44:45.100]you can grab some of those geo processing tools,
[00:44:47.150]of which there are literally hundreds
[00:44:49.110]and use them on your drill hole data, which is really handy.
[00:44:54.640]And to give you an idea of where we’re going,
[00:44:57.310]we’re still working on this,
[00:44:58.310]obviously there’s a lot of things that we need to do,
[00:45:01.110]but some of the top priorities
[00:45:02.150]we’re looking at for next year
[00:45:05.150]are things like drill hole planning,
[00:45:08.400]basic geological modeling,
[00:45:09.780]like wire framing drawing interpretations on sections
[00:45:12.807]and drawing those in 3D,
[00:45:15.190]slicing up those voxels and a bit of an easier way,
[00:45:17.230]or bringing the voxels in entirely
[00:45:19.010]and visualizing those in ArcGIS Pro.
[00:45:22.120]And we want to hear your ideas
[00:45:24.210]we want to hear what you guys think are the top priorities,
[00:45:27.500]working with drill hole data.
[00:45:28.860]So please reach out to us and let us know
[00:45:31.470]if you have a passionate ideas
[00:45:33.370]about what should go into ArcGIS Pro
[00:45:35.230]for working with troubles.
[00:45:38.060]So we’ll take a break and get some questions.
[00:45:41.820]If you haven’t had a chance you can start typing.
[00:45:45.230]We’ll pick a few to answer
[00:45:47.690]and I’ve got a few common questions that have come up here.
[00:45:51.840]So we’ll pop that open while I have a chance
[00:45:54.160]to kind of look through,
[00:45:58.490]these are some of the things that have come in
[00:45:59.770]in the last week or so,
[00:46:03.170]and some of the things that people have asked us,
[00:46:05.800]so Target ArcGIS Pro does require
[00:46:10.850]version 24 of ArcPro or higher,
[00:46:14.020]but it does work with any licensed level.
[00:46:16.510]So you might have a basic standard
[00:46:17.970]or advanced license for Pro and it works with all of those.
[00:46:23.430]The other thing to know is that you do require a secret ID
[00:46:26.490]if you don’t already have one,
[00:46:27.670]you’ll need that to download and install
[00:46:29.580]and to use the tools.
[00:46:30.830]You don’t need to be online,
[00:46:32.070]but you do need to be signed in.
[00:46:34.500]If you already have an existing subscription
[00:46:37.370]for Target for ArcMap, then you already have a license
[00:46:38.845]and you can get started right now.
[00:46:42.940]If you have any questions about that,
[00:46:43.940]you can shoot us an email
[00:46:45.810]and if you’re not currently a subscriber,
[00:46:48.370]there are free tools in there that you can try out
[00:46:51.150]and you can still have a go at it, okay?
[00:46:56.880]So there’s not a ton of questions I think
[00:46:58.890]that have come in so far.
[00:47:00.410]Lisa, do you have any ones that you can see?
[00:47:04.090]<v Lisa>Yeah, I have a couple here</v>
[00:47:07.370]and we encourage anyone on the line
[00:47:09.420]to please put your questions in that box,
[00:47:10.920]so we can address those.
[00:47:13.200]The first one here is around data.
[00:47:14.620]So when the source data has changed,
[00:47:17.250]will I have to import the data all over again?
[00:47:19.310]<v Sara>That’s a great question.</v>
[00:47:21.450]Yeah, no.
[00:47:22.283]So obviously when you do go through that import process,
[00:47:25.030]there’s a couple of steps
[00:47:26.470]and you don’t want to go through those again.
[00:47:28.340]So, but drill hole data does change very frequently,
[00:47:32.810]almost daily in some cases
[00:47:34.620]and there is a refresh option in the data tools section
[00:47:39.030]where you just simply a one button press,
[00:47:41.610]and it’s going to refresh from the source
[00:47:43.700]that you used last time and using all the settings
[00:47:46.470]that you used last time to do the imports
[00:47:48.720]and we’ll just redo that import for you
[00:47:50.250]and all your data will be up to date
[00:47:52.370]in just a couple of minutes.
[00:47:53.980]Good question.
[00:47:55.250]<v Lisa>Cool, yeah, I have a couple more here</v>
[00:47:56.780]and I guess we can sort of sifting through them.
[00:47:59.860]The next one is a symbology question.
[00:48:01.840]It seems so someone has asked
[00:48:04.040]if they can create custom styles
[00:48:06.330]and then share those with their coworkers or their teams.
[00:48:09.460]<v Sara>Yeah, absolutely.</v>
[00:48:11.690]So the symbology tools from,
[00:48:14.570]in that symbology drill hole symbology section,
[00:48:17.490]you can create your own, you can import other people’s
[00:48:21.610]and you can share those either via a layer file
[00:48:24.630]or via the geo database itself
[00:48:27.350]and you can share those across your organization
[00:48:29.440]or with other users.
[00:48:30.910]Yeah, absolutely you can share them for sure.
[00:48:33.440]<v Lisa>Okay, I’ve got one more</v>
[00:48:35.088]and so it’s specific to sections.
[00:48:36.660]So is it possible to create stacked section views?
[00:48:40.270]<v Sara>Yeah, that would all be in the layouts.</v>
[00:48:42.960]So in the layout tools,
[00:48:44.870]you can add multiple different map frames or 3D frames,
[00:48:49.130]and you would just have to create different multiple frames
[00:48:55.130]of each of the sections that you want to see
[00:48:57.137]and it should be pretty easy to get a stack section
[00:48:58.900]to be that way.
[00:49:00.870]<v Lisa>Great.</v>
[00:49:02.560]I think we have a couple of questions here
[00:49:04.860]that we can maybe address after today’s event.
[00:49:08.870]I want to thank everybody for attending today’s session,
[00:49:11.320]and don’t forget that we will make the recording available
[00:49:13.190]and as I said, we can address any questions
[00:49:14.710]that you want to shoot over.
[00:49:16.840]I see that Sara has included contact information here
[00:49:19.670]for pricing and upgrade inquiries,
[00:49:21.000]as well as getting started link to learn more.
[00:49:24.120]<v Sara>Yeah, if you want to take a screen capture that,</v>
[00:49:26.850]those two links will help you get some more information
[00:49:30.380]and feel free to reach out.
[00:49:33.400]<v Lisa>Alright, this is great.</v>
[00:49:34.300]Thanks Sara and thanks everyone for joining.
[00:49:36.940]<v Sara>Yeah, thanks everybody for coming.</v>
[00:49:38.700]<v Lisa>Okay thanks.</v>