


Introduction
Stability by strength reduction is a procedure where the factor of safety is obtained by weakening the soil in steps in an elastic-plastic finite element analysis until the slope fails. The factor of safety is deemed to be the factor by which the soil strength needs to be reduced to reach failure (Dawson et al., 1999; Griffiths and Lane, 1999). This example illustrates how a Strength Reduction stability analysis can be done with SIGMA/W. In addition, the results are discussed in the context of an alternate procedure known as a stress-based stability analysis.
Numerical Simulation
The Analysis Tree for the Project is presented in Figure 1. The first step is to do an In Situ analysis to establish the state of stress in a 2h:1v slope 10 m high, as shown in Figure 2. The specified soil stiffness is arbitrary for an In Situ analysis because the displacements are inconsequential. Poisson’s ratio governs the amount of stress that develops in the horizontal direction.
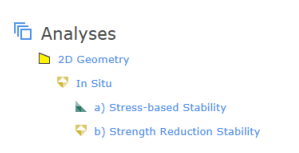
Figure 1. Analysis tree for the Project.
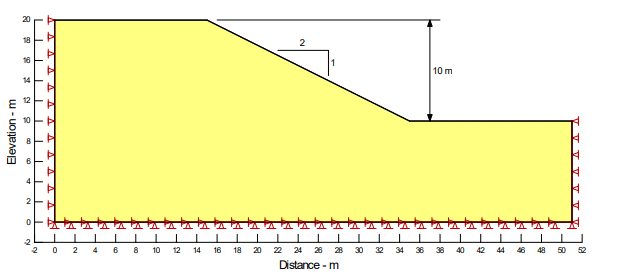
Figure 2. Problem configuration.
The In Situ analysis forms the Parent for the subsequent stability analyses (Figure 1). The safety factor is first calculated using the Finite Element Stress technique in SLOPE/W. This approach calculates a safety factor by integrating the SIGMA/W shear stress and shear strength along the slip surface (see SLOPE/W Reference Book). The second analysis uses the automated Strength Reduction Stability technique. The strength reduction factor (SRF) is defined as:
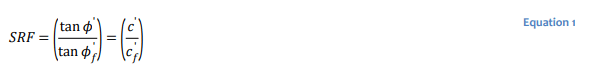
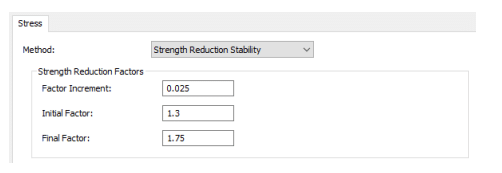
Figure 3. Strength reduction stability analysis settings.
Results and Discussion
The SLOPE/W FE Stress stability factor is 1.55 as shown in Figure 4. Figure 5 presents the distribution of the resistance and driving or mobilized shear along the slip surface. Note that the shear resistance or shear strength is locally greater than the mobilized shear along the entire slip surface. The overall factor of safety is the area under the resistance curve divided by the area under the mobilized shear curve. From the computed factor of safety, the area under the resistance curve is 1.55 times greater than the area under the mobilized shear curve.
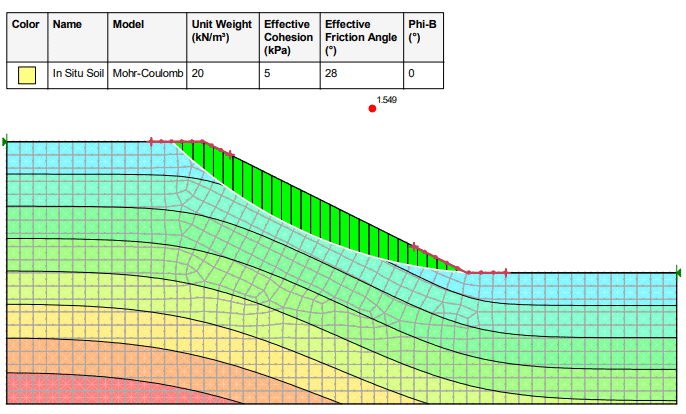
Figure 4. Factor of safety based on in situ stresses in Analysis 1.
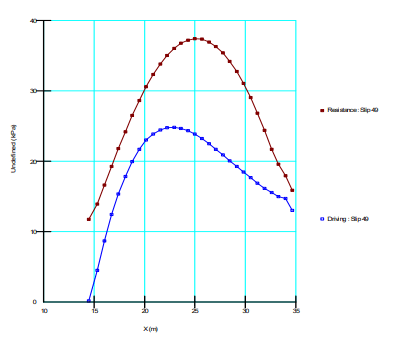
Figure 5. Shear strength and mobilized shear along the slip surface.
Figure 6 to Figure 8 present the SRS results. Unlike the FE Stability and Limit Equilibrium methods, the factor of safety is not calculated directly via the SRS method. The safety factor must be interpreted. A review of gauss points with a stress-state on the failure surface suggests that a global failure zone has developed near the ground surface with a reduction factor equal to 1.6 (Figure 6). A zone of maximum displacement becomes focused within the upper portion of the slope. The Normalized Domain Stiffness drops to its minimum at about 1.57 (Figure 7), while the Vector Norm of Displacement begins to increase at a strength reduction factor of 1.57 (Figure 8). The SRS safety factor is therefore around 1.57, which is in-keeping with the FE Stability safety factor, thereby confirming the SRS interpretation and improving confidence in the results.
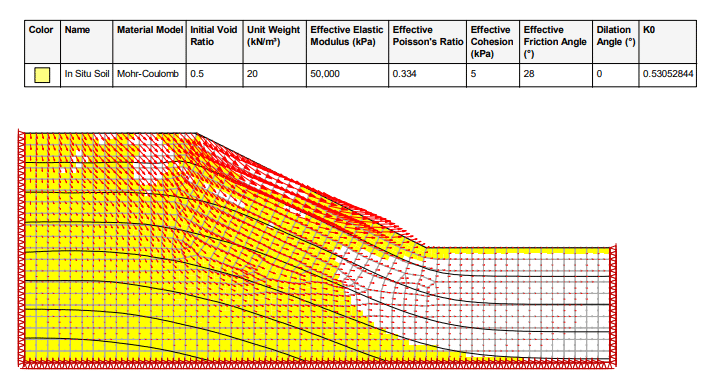
Figure 6. Plastic states (failure) when the safety factor is 1.6.
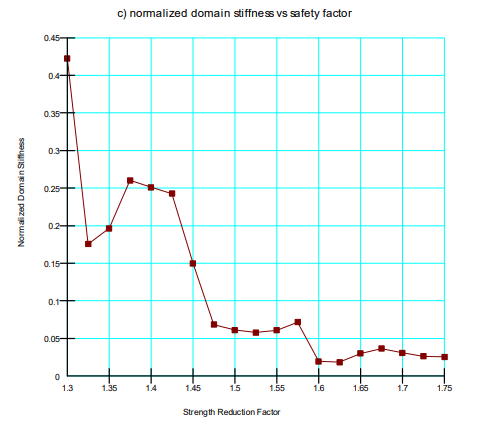
Figure 7. Normalized domain stiffness vs strength reduction factor.
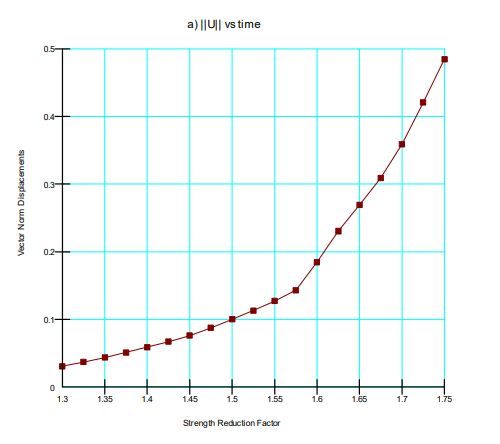
Figure 8. Vector norm of displacements vs strength reduction factor.
Summary and Conclusions
This example demonstrates that SIGMA/W can be used to do a Strength Reduction method of stability analysis. A comparison of the FE Stability and SRS techniques reveal that a key advantage of the SRS technique is that the mode of failure evolves naturally as the strength is reduced.
References
Dawson, E.M., Roth, W.H. and Drescher, A. (1999). Slope Stability Analysis by Strength Reduction, Geotechnique, 49(6), 835-840
Griffiths, D.V. and Lane, P.A. (1999). Slope Stability Analysis by Finite Elements, Geotechnique, 49(3), 387-403