


In this video, we will demonstrate the interactive tools Leapfrog Works has for numeric data analysis.
Please note: In late 2020, Leapfrog Works received a significant update to its user interface. While the current version of Leapfrog looks quite different from the version used to record this video, most of this content is still valid as the layout, location of functions, and workflows remain largely the same. For more information about the latest new features, please see the Leapfrog Works product page (https://my.seequent.com/products/leapfrog-works/latest).
0:00 – Introduction to numeric data analysis in Leapfrog
0:09 – Univariate and bivariate graph types available
0:50 – Benefits of building a merged table in Leapfrog
1:23 – Creating a new merged table
1:48 – Creating a query filter for units of interest
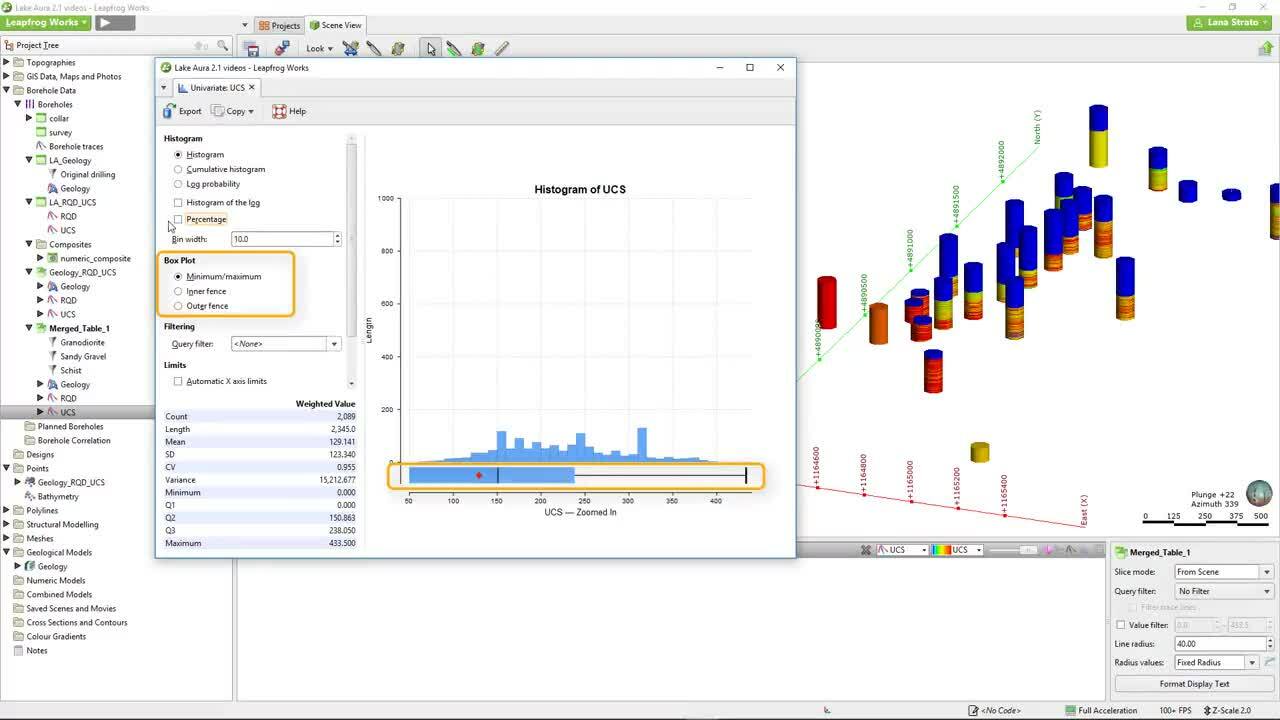
2:26 – Histograms
3:24 – Histogram – 3D scene interaction
4:16 – Scatter plots
4:40 – Scatter plot – 3D scene interaction
5:18 – QQ plots
5:53 – Box plots
6:53 – Copying and exporting graphs
7:01 – Table of statistics
Duration
8 min

See more on demand videos
VideosFind out more about Leapfrog Works
Learn moreVideo Transcript
The video transcript gets copy and pasted here