Introduction
Mechanically stabilized earth (MSE) walls, also called reinforced soil walls, are commonly used structures for retaining the earth under bridges, highways, railroads, water front ports, and various other types of infrastructure. These walls are constructed from the bottom up by placing alternating layers of soil and reinforcement. The reinforcement could be a relatively extensible product such as a geogrid or geotextile or a more rigid product such as steel ribbed strips. The reinforced soil is usually engineered granular material and the facing of these walls is typically inclined at greater than 70 degrees.
Designing an MSE wall requires consideration of the geometric configuration and reinforcement requirement to ensure external and internal stability. External stability is concerned with the global stability of sliding masses defined by slip surfaces that pass outside the reinforced soil zone. Internal stability is concerned with rupture and pullout of the reinforcement. Both modes of internal stability are assessed using empirically derived relationships that estimate stress states within the ground and reinforcement.
SLOPE/W can only be used to analyze the stability of sliding masses. Slip surfaces can pass outside or through the reinforced zone. Slip surfaces that pass through the reinforced zone benefit from the reinforcement behind the slip surface; however, the results of the analyses cannot be used to assess rupture and pullout. The objective of this example is to demonstrate how SLOPE/W can be used to analyze external stability and compound failures; that is, slip surfaces that pass through the reinforced zone behind the MSE wall. A commentary on internal stability is also provided to highlight the distinction between it and compound failures.
Numerical Simulation
SLOPE/W was used to analyze the stability of an MSE wall that was designed by the Federal Highway Administration (FHWA 2001). The wall configuration is as follows:
- Steel ribbed strip reinforcement within reinforced zone
- Each strip is 50 mm wide;
- Width of reinforced zone of 5.5 m
- Reinforcement vertical spacing: 0.75 m with the topmost layer at 0.675 m below the ground surface
- Reinforcement horizontal spacing: 0.6 m for the 1st and 8th layers from the top and 0.75 m for the remaining steel strips
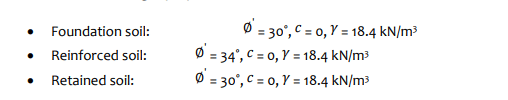
Figure 1 shows the model domain, which comprises a 7.8 m high by 5.5 m wide zone of reinforced earth, and external loading condition representing a traffic surcharge of 9.4 kPa on the ground surface. The soil strength properties were defined as follows:
The SLOPE/W analyses were carried out using the Morgenstern-Price method.
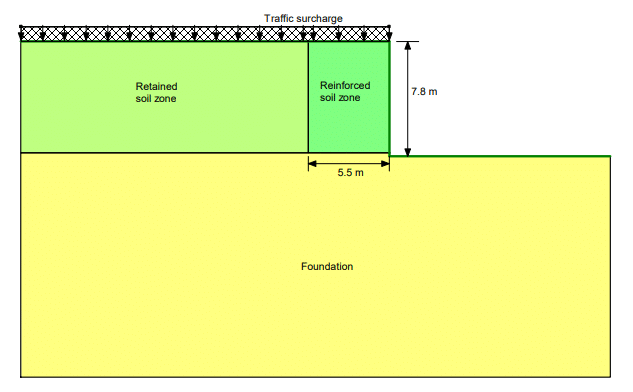
Figure 1. Model domain and external loading conditions.
External Stability
Two external failure modes were simulated: base sliding and deep-seated failure along circular slip surfaces. The Block Specified search technique was used to generate the trial slip surfaces for the base sliding scenario because the left and right blocks can be collapsed to a single point (refer to the associated file). The Left Projection Angle was varied from 115 degrees to 165 degrees in 10 increments. The Entry and Exit search method with specified tangent lines was selected to analyze global deep-seated failure. The box that defines the tangent radius lines was collapsed so that the individual tangent lines collapse to points through which the slip surfaces must pass. The use of points in this scenario was a convenient means of ensuring that all slip surfaces passed outside the zone of reinforced earth.
Compound Slip Surfaces
Compound failure modes were described by bi-linear slip surfaces that passed through the reinforced zone. The break point of the bi-linear curve was at half of the wall height and was selected to be commensurate with the mode of failure used in the assessment of internal stability by the FHWA (2001; see commentary below). The search of bi-linear slip surfaces within the zone of reinforced soil was undertaken using the Block Specified search technique (refer to the associated file). The left block (point) was placed at the break point of the assumed bi-linear slip surface and the right block (point), also the exit point of slip surfaces, was at the toe of the wall. The Left Projection Angle was varied from 90.5 degrees (i.e. inclined slight from vertical) to 120 degrees in 10 increments. The Right Projection Angle was set to 0 degrees. Other modes of compound type failures (e.g. circular) could also have been considered.
Figure 2 shows an example of the input parameters for the steel ribbed strip reinforcement using the information by FHWA (2001). The allowable tensile stress was taken as 0.55(𝑓𝑦) = 227.5 MPa, where 𝑓𝑦 denotes the yield stress of steel, taken as 413.7 MPa for 60 grade steel. The net cross-sectional area was determined to be 129.2 mm2 taking into account the corrosion loss during design service life. The horizontal spacing of the steel strips was 0.6 m for the 1st and 8th reinforcement layers and 0.75 m for the remainder. Hence, the allowable tensile capacity was 227.5 × 129.2 / (0.6 × 1000) = 49.0 kN and 227.5 × 129.2 / (0.75 × 1000) = 39.2 kN, respectively. The Reduction Factor for tensile capacity was taken as 1.0.
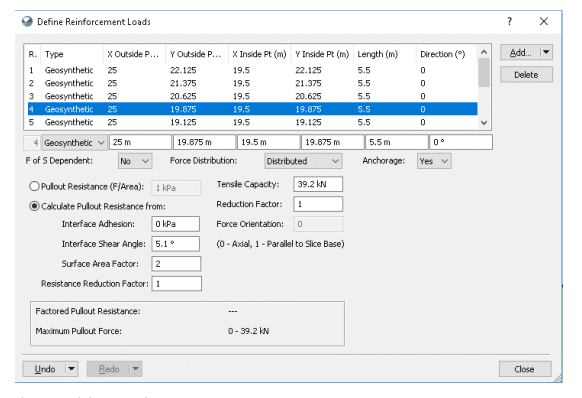
Figure 2. Reinforcement input parameters.
The option to “Calculate Pullout Resistance from” was used to vary the pullout resistance with overburden stress. A Surface Area Factor of two was used to consider the pullout resistance mobilized on the two sides of the strips. The Interface Adhesion was taken as zero and the Interface Shear Angle was calculated in accordance with the procedure outlined in the Appendix. The interface shear angle varies between 2.6 to 8.8 degrees. The pullout Resistance Reduction Factor was set to 1.0. Passive failure within the Active Zone was not considered by selecting “Yes” for the “Anchorage” option; that is, the steel strips were assumed fixed to the precast concrete facing.
SLOPE/W has the option of “F of S Dependent” for reinforcement (Figure 2). The analysis of the compound failure mode was completed using both the “No” and “Yes” options. Selecting “No” means that the factor of safety definition does not apply to the soil at the interface with the reinforcement. Stated another way, the pullout resistance (i.e. shear strength at the interface) is not reduced by the Factor of Safety, meaning that the full shear strength is mobilized at the interface. The reinforcement loads end up in the denominator of the factor of safety equation when this option is selected. The Factor of Safety equation conceptually takes this form:
𝐹𝑆 = 𝑅𝑒𝑠𝑖𝑡𝑖𝑛𝑔 𝐹𝑜𝑟𝑐𝑒 (𝐷𝑟𝑖𝑣𝑖𝑛𝑔 𝐹𝑜𝑟𝑐𝑒 ‒ 𝑅𝑒𝑖𝑛𝑓. 𝐿𝑜𝑎𝑑𝑠)
In contrast, the “Yes” option means that the Factor of Safety definition does apply to the soil at the interface with the reinforcement. The Factor of Safety equation conceptually takes this form:
𝐹𝑆 = (𝑅𝑒𝑠𝑖𝑡𝑖𝑛𝑔 𝐹𝑜𝑟𝑐𝑒 + 𝑅𝑒𝑖𝑛𝑓. 𝐿𝑜𝑎𝑑𝑠) (𝐷𝑟𝑖𝑣𝑖𝑛𝑔 𝐹𝑜𝑟𝑐𝑒))
Results and Discussion
External Stability
Figure 3 shows results of the SLOPE/W base sliding analysis. The calculated Factor of Safety (FS) was 2.044, which compares reasonably well with the value of 2.19 reported by FHWA (2001). The close agreement in the value of Factor of Safety is rather fortuitous given the differences in the modes of failure and the methods of analysis. The FHWA (2001) method of analysis for base sliding defined the Factor of Safety as the ratio of horizontal resisting force to driving force at the base of the reinforced soil zone. In contrast, SLOPE/W gives consideration to both force and moment equilibrium. The force and moment factor of safety equations are made equivalent by taking a percentage of an assumed inter-slice force function that describes the relationship between the inter-slice normal and shear forces. Furthermore, consideration was given to the shear mobilized along the slip surface both beneath and behind the zone of reinforced soil in the SLOPE/W model.
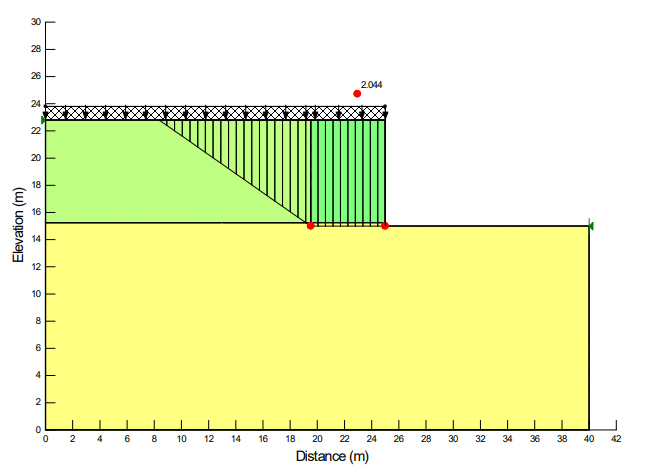
Figure 3. SLOPE/W results for the base sliding analysis.
Figure 4 shows the results of the stability analysis of circular slip surfaces. The calculated FS of 1.465 exceeds the design FS of 1.3 for global stability prescribed by the FHWA (2001). The result of the global stability check was not provided by the FHWA (2001).
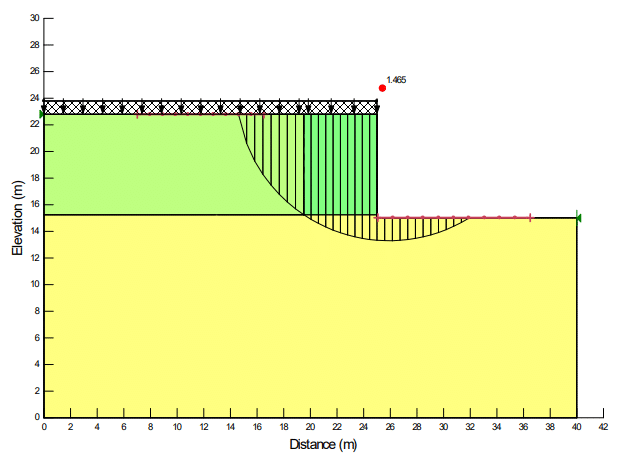
Figure 4. SLOPE/W results for the deep-seated stability analysis.
Compound Slip Surfaces
As note previously, the stability of slip surfaces passing through the reinforced zone was completed without and with factor of safety dependency applied to the pullout resistance. Convergence could not be obtained on any slip surface when the dependency was set to “No”. The reason, in essence, is that the denominator of the factor of safety equation – which includes the reinforcement loads – can approach zero or become negative if the reinforcement loads exceed the driving force. Convergence of the factor of safety equations is therefore not possible.
In contrast, convergence was possible for all trial slip surfaces when the factor of safety dependent option was applied. The pullout forces included in the numerator of the factor of safety equations are reduced by the calculated factor of safety during iteration, making convergence possible.
Figure 5 shows the case where the reinforcement loads were dependent upon the Factor of Safety. The left inset shows the slip surface with the near vertical section. The calculated FS was 1.801. The most critical slip surface was a ‘wedge’ type failure that had a calculated FS was 1.429. As can be seen in Figure 5, except for the bottom layer, the reinforcement loads applied to the free body diagram were governed by the pullout resistance.
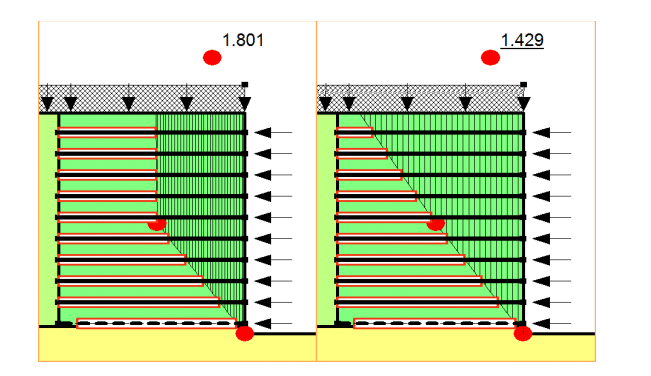
Figure 5. Stability with FS-dependent reinforcement loads.
Commentary: Internal Stability Analysis
The Simplified method of the FHWA (2001) adopts a bi-linear failure surface for internal stability design of steel reinforcement type of MSE walls (Figure 6). For the case of horizontal back-slope, the break point of the bi-linear curve is at half of the wall height. The failure surface divides the reinforced zone into active zone and resistant zone. The reinforcement lengths within the resistant zone provide pullout resistance.
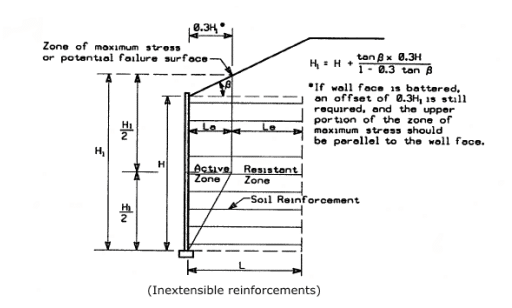
Figure 6. Potential failure surface for internal stability using the Simplified method (From FHWA-NHI-00-043).
The internal stability design using the FHWA (2001) Simplified method is to compare the load and resistance at each of the reinforcement layers. The maximum tension, 𝑇𝑚𝑎𝑥, in each reinforcement layer per unit width of wall is calculated as:
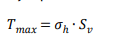
where 𝜎ℎ is the horizontal stress and 𝑆𝑣 is the vertical reinforcement spacing. The horizontal stress, 𝜎ℎ, is related to the vertical stress, 𝜎𝑣, by a horizontal stress coefficient, 𝐾𝑟:
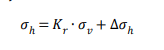
The 𝐾𝑟 coefficient is related to Rankine’s active earth pressure coefficient, 𝐾𝑎, using the empirical bi-linear model shown in Figure 7:
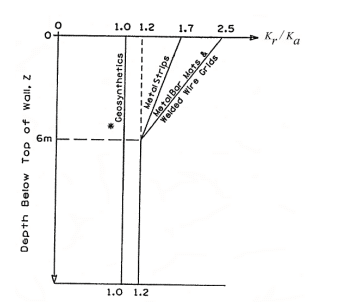
Figure 7. Variation of horizontal stress ratio, Kr/Ka, with depth (From FHWA-NHI-00-043).
From Figure 7, it can be seen that, for the metal strip wall, the horizontal stress coefficient ranges from 1.2 𝐾𝑎 to 1.7 𝐾𝑎.
Like the calculation of maximum reinforcement load, the reinforcement pullout model using the FHWA (2001) Simplified method is also a semi-empirical analytical approach. The details of the pullout model are presented in an Appendix. The pullout resistance cannot be greater than the reinforcement tensile capacity. The factor of safety for reinforcement pullout is calculated as the ratio of pullout resistance, 𝑃, to maximum tensile load, 𝑇𝑚𝑎𝑥.
For this example wall, the Simplified method produced a factor of safety against pullout for each level of reinforcement that ranged between 1.51 and 1.82 (FHWA, 2001). The calculated factor of safety from the SLOPE/W analysis was within this range; however, it must be pointed out that the Simplified method and the SLOPE/W analyses are fundamentally different. The Simplified Method is concerned with the individual reinforcement while the SLOPE/W analysis is concerned with equilibrium of the entire sliding mass subject to the effects of reinforcement. This fundamental difference is reflected in the definitions of the factor of safety. The FHWA Simplified method for the internal stability design of MSE wall does not explicitly take into account the shear strength of soil. The FHWA approach actually attempts to acknowledge the ‘real’ stress distribution in the ground when calculating the tensile stress in the reinforcement; the reinforcement load can then be legitimately compared with the tensile capacity.
In addition to the fundamental differences noted above, there often exist numerical difficulties when using SLOPE/W for compound failure modes. Firstly, the vertical section of the slip surface shown in Figure 6 cannot be considered. Pullout forces are only included on the free body diagram if the reinforcement intersects a slice base. Secondly, convergence is often tenuous or impossible for the pre-defined slip surface shown in Figure 6. Lastly, these structures are often heavily reinforced making convergence more difficult.
Summary and Conclusion
SLOPE/W can be used to analyze the stability of various modes of failure that could pertain to a MSE wall configuration. Despite the reasonable agreement between the factor of safety of the compound failure modes and those corresponding to the internal pullout stability analysis of the FHWA (2001), SLOPE/W cannot be used to assess pullout and rupture.
References
Federal Highway Administration (FHWA), 2001, “Mechanically Stabilized Earth Walls and Reinforced Soil Slopes—Design and Construction Guidelines,” FHWA-NHI-00-043, V. Elias, B. R. Christopher, and R. R. Berg, Eds., Federal Highway Administration, Washington D.C., USA.
Appendix: Reinforcement Pullout Parameters Using FHWA (2001) Pullout Model
The pullout input parameters were determined in accordance with the pullout model of FHWA (2001). According to FHWA (2001), the pullout resistance per unit width of wall, 𝑃, is given by:
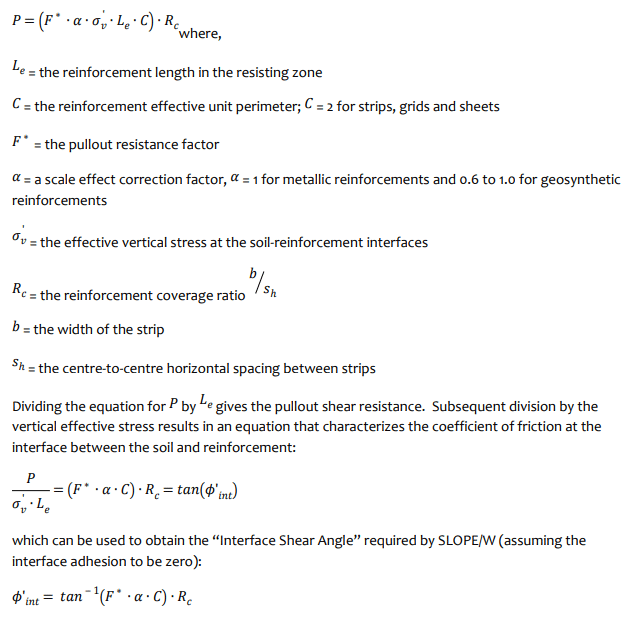
Values of 𝐹∗ were determined based on the depth of each reinforcement layer from the bi-linear relationship shown in Figure 8. The parameter Cu is the coefficient of uniformity of backfill soil.
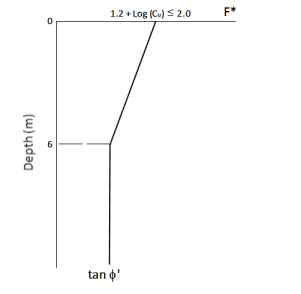
Figure 8. Pullout resistance factor, F* (From FHWA-NHI-00-043).
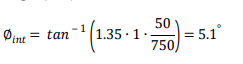
Consider the fourth reinforcement layer from the ground surface at a depth of 2.925 m. The friction angle of the zone of reinforced soil is ∅’ = 34˚ and coefficient of uniformity 𝐶𝑢 was assumed to be greater than 7. The value of 𝐹* can therefore be linearly interpolated as:
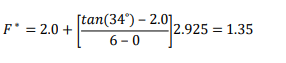
The steel strips are 𝑏 = 50 mm wide with a centre-to-centre horizontal spacing at this level is 𝑠ℎ = 0.75m. The Surface Area Factor, which is equivalent to 𝐶, is equal to 2. The Interface Shear Angle ( ∅ int ) for this level of reinforcement can be calculated as: