


Navigating complex geology in the East African Rift
Exploring natural resources beneath volcanoclastic sediments is one of the biggest challenges along the East African rift basins.
These sediments are difficult to interpret due to complex depositional processes and the challenge of distinguishing primary from secondary deposits, which complicates correlation of geological events. For the Tanzania Petroleum Development Corporation (TPDC), success meant reducing uncertainty in an area where traditional seismic methods fall short.
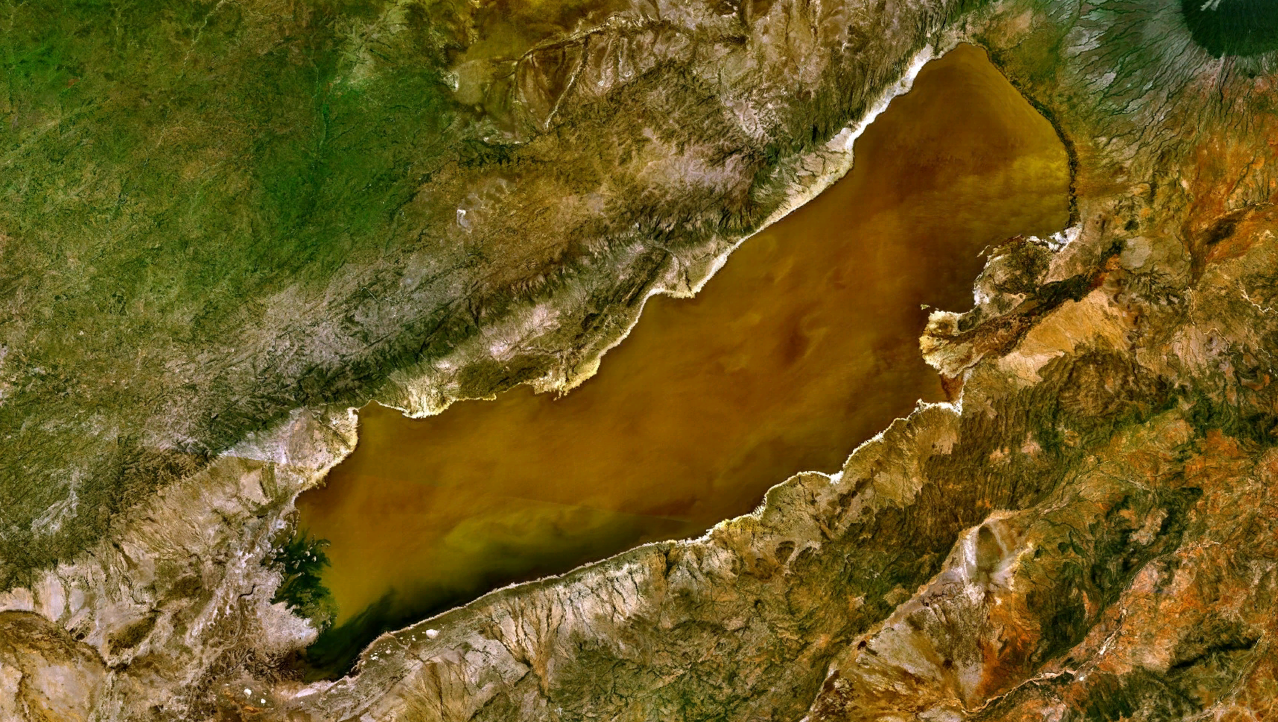
The Eyasi Wembere Basin in northeastern Tanzania lies within the tectonically active East African Rift system. Its surface geology, dominated by volcaniclastic deposits, poses a challenge for seismic imaging. These layers obscure wave propagation, making it difficult to resolve deeper structures and assess hydrocarbon potential.
TPDC’s gravity gradiometry and magnetic data workflow for seismic survey planning
To address this, TPDC launched a multi-method geophysical investigation. In 2015 and 2016, high-resolution airborne gravity gradiometry and magnetic data were acquired across the basin to identify potential structures and understand sediment distribution.
Geophysicist Sindi Maduhu and the TPDC exploration team used Seequent’s Oasis montaj to import, organise and interpret the data. The software’s ability to handle large volumes and integrate multiple datasets was key to building a coherent subsurface model.
”Oasis montaj brought all our datasets together and gave us a clear picture of the basin—critical for making informed decisions.
Sindi MaduhuGeophysicist, TPDC
Gravity map of the Eyasi Wembere Basin used to frame survey coverage and regional structure.
Related content:
* Unlocking Kenya’s rift basin hydrocarbon potential
* Effective approaches to potential field modelling in hydrocarbon exploration
* Gravity and Magnetic Geophysical Methods in Oil Exploration
* A tighter turning circle for exploration and discovery is how to reap the most from the Autumn years of oil and gas
Integrating seismic and amplified geochemical imaging to refine the picture
The gravity and magnetic data helped determine where to acquire seismic data, which was later integrated into Oasis montaj. The team also explored other geoscientific data to resolve areas of interest, particularly in zones where sediment and volcanic cover masked structures and lithology. Various enhancements were applied to the data to ensure that all geological structures were mapped and tested using seismic data.
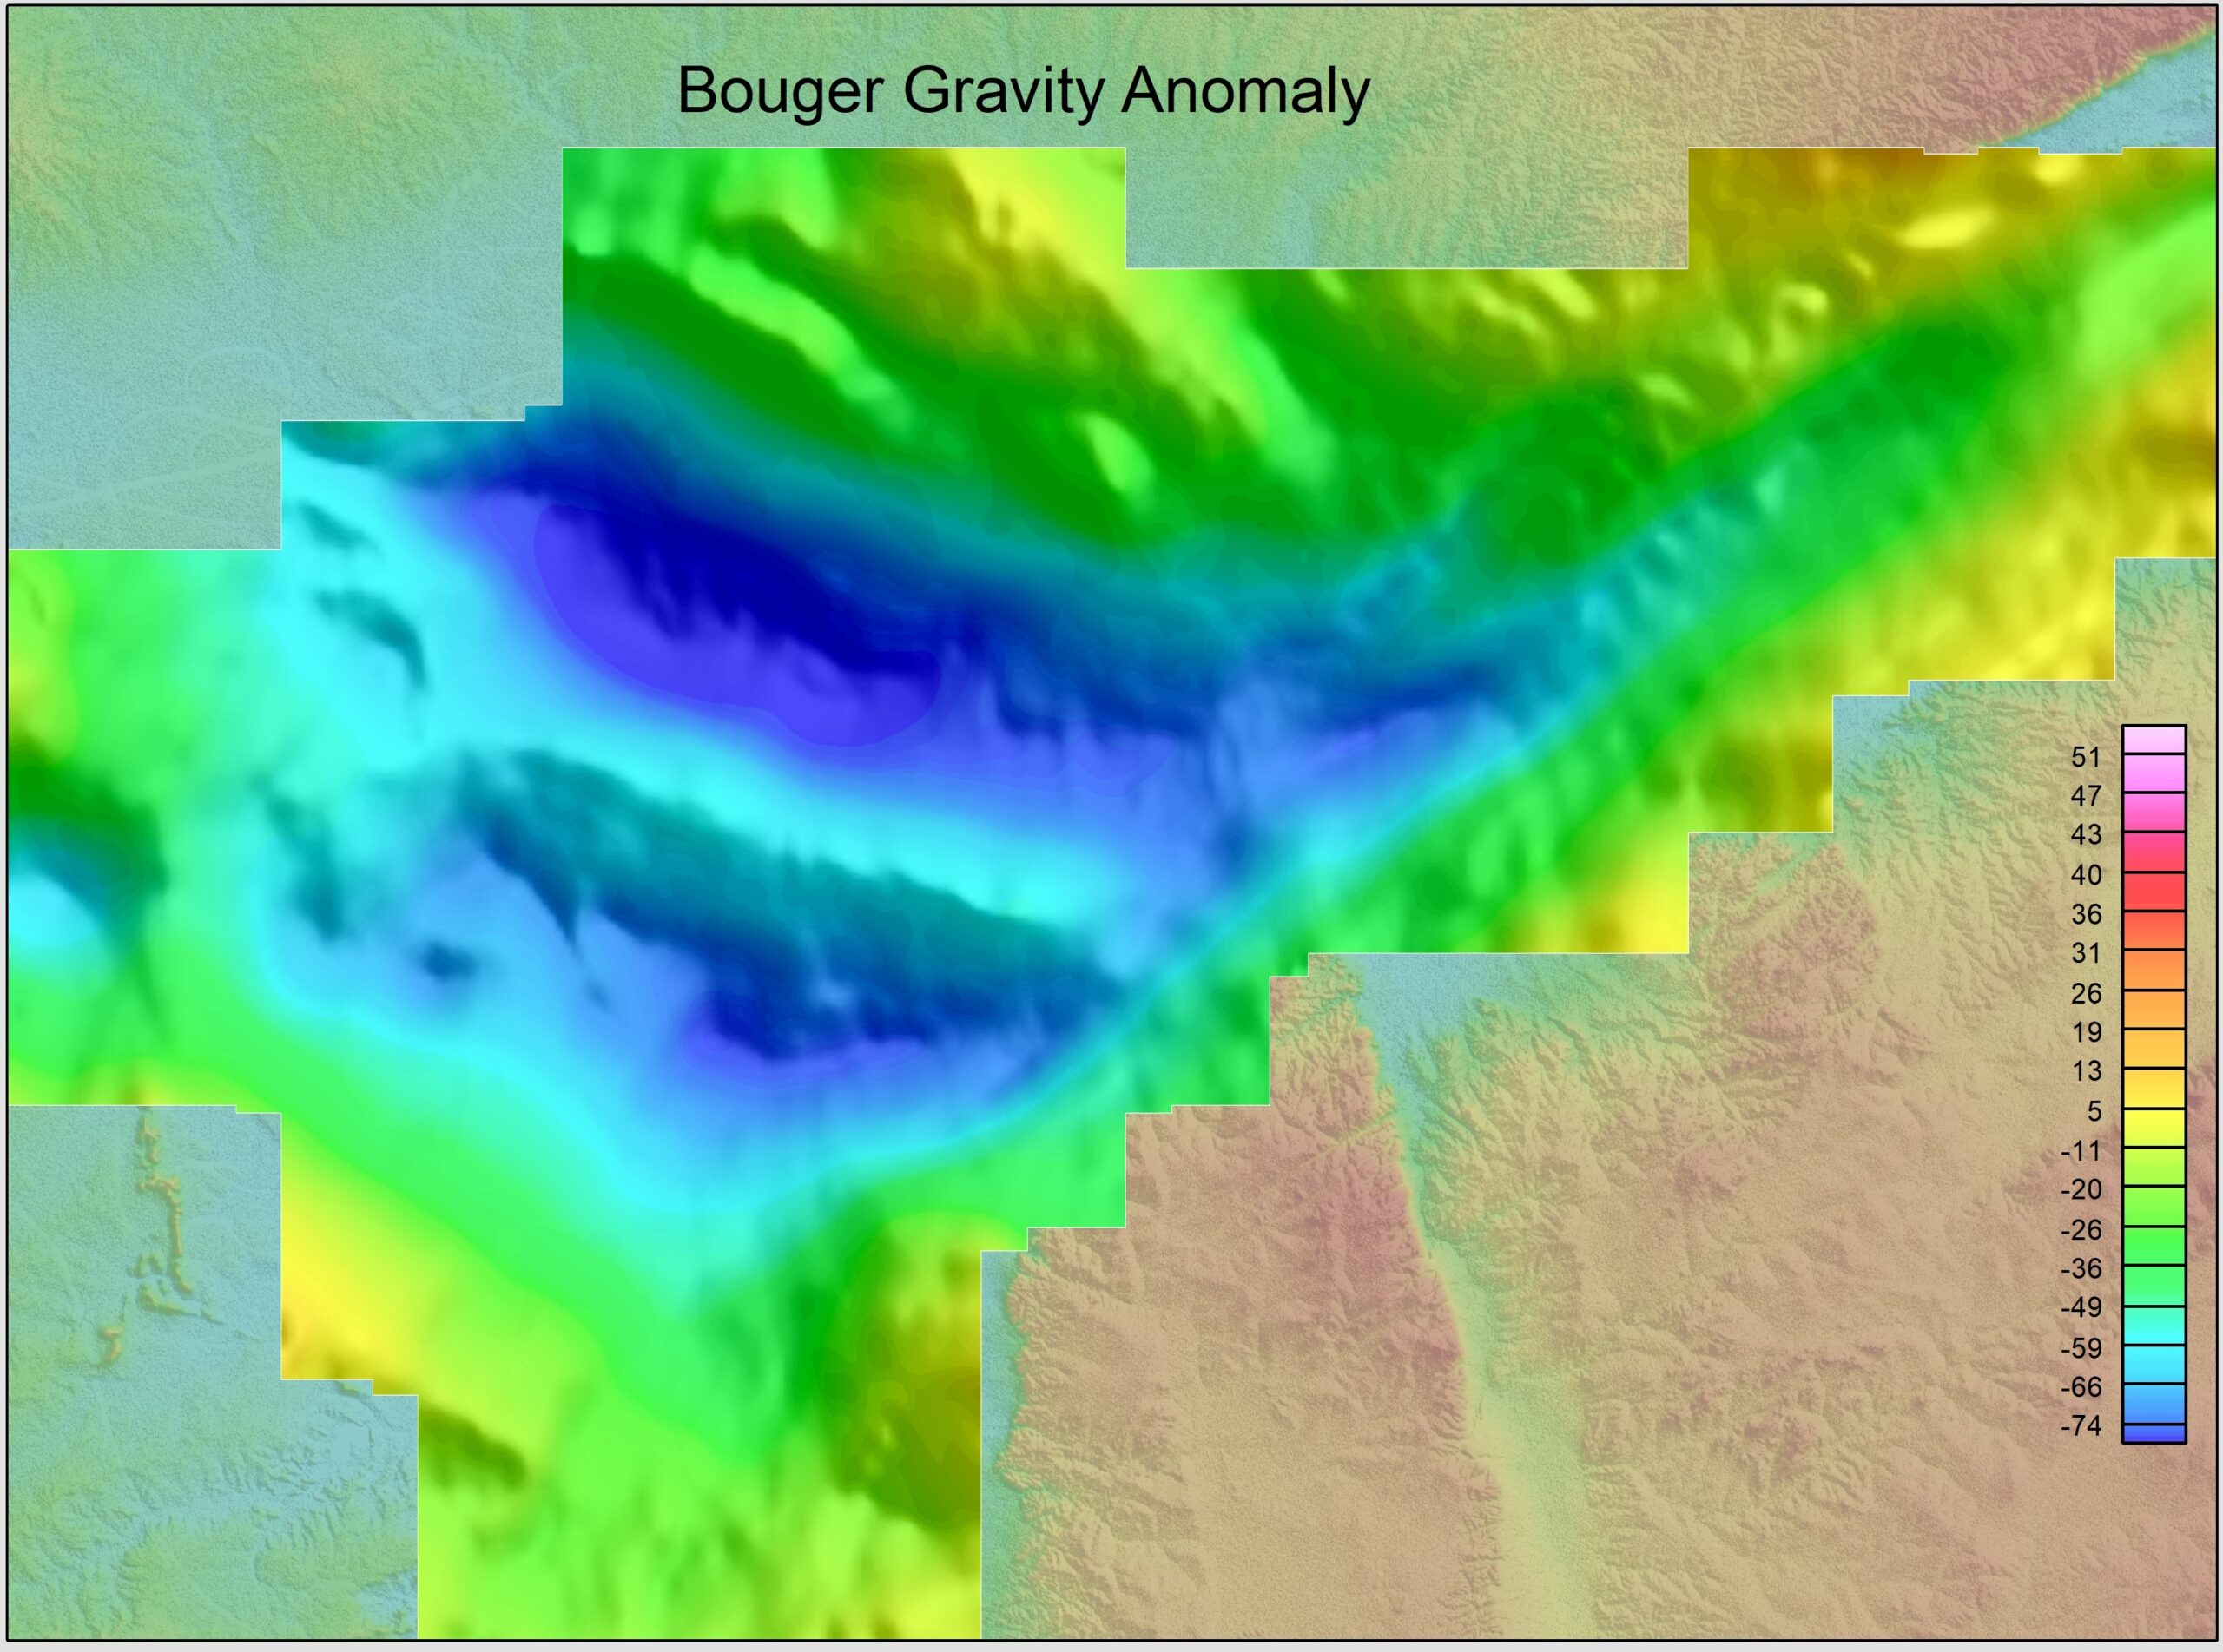
Gravity gradient map highlighting structural breaks beneath volcaniclastic cover.
Key findings and modelling insights
Using Oasis montaj and its extensions, the team identified rift-bounding faults, intra-rift structures, and confirmed basin depth and sediment thickness.
Structures and sediment thickness were identified using qualitative and quantitative approaches in Oasis montaj. Detailed quantitative refinement included depth estimates to tops of anomalous magnetic and gravity bodies, generated by various methods. Qualitative understanding of the significance of magnetic and gravity anomalies and their inter-relationships also benefited the modelling of seismically controlled magnetic and gravity profiles, helping to extrapolate results to unmodelled regions of the study area.
Modelling of potential field data is an important aspect of the interpretation process and is often performed using a “bottom-up/outside-in/magnetics first” approach. This ensures that deep (magnetic basement-related) and distal sources, which affect the region, are sensibly configured before attention is focused on details within the area of interest. The inversion of potential field data is performed in Oasis montaj Basin Modelling, where the 3D model is defined by a number of surface meshes, with density and susceptibility distributions assigned to each layer.
Some limitations were noted, such as a shift showing that the seismic depth is shallower than the inverted gravity depth, but the overall workflow provided valuable insights into subsurface architecture.
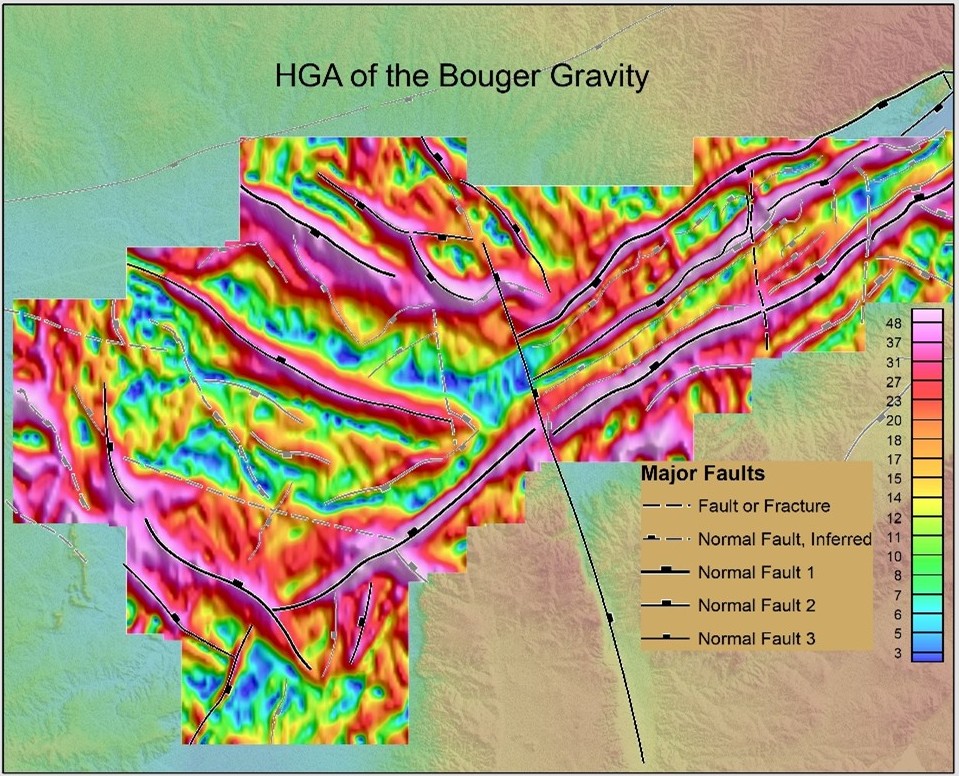
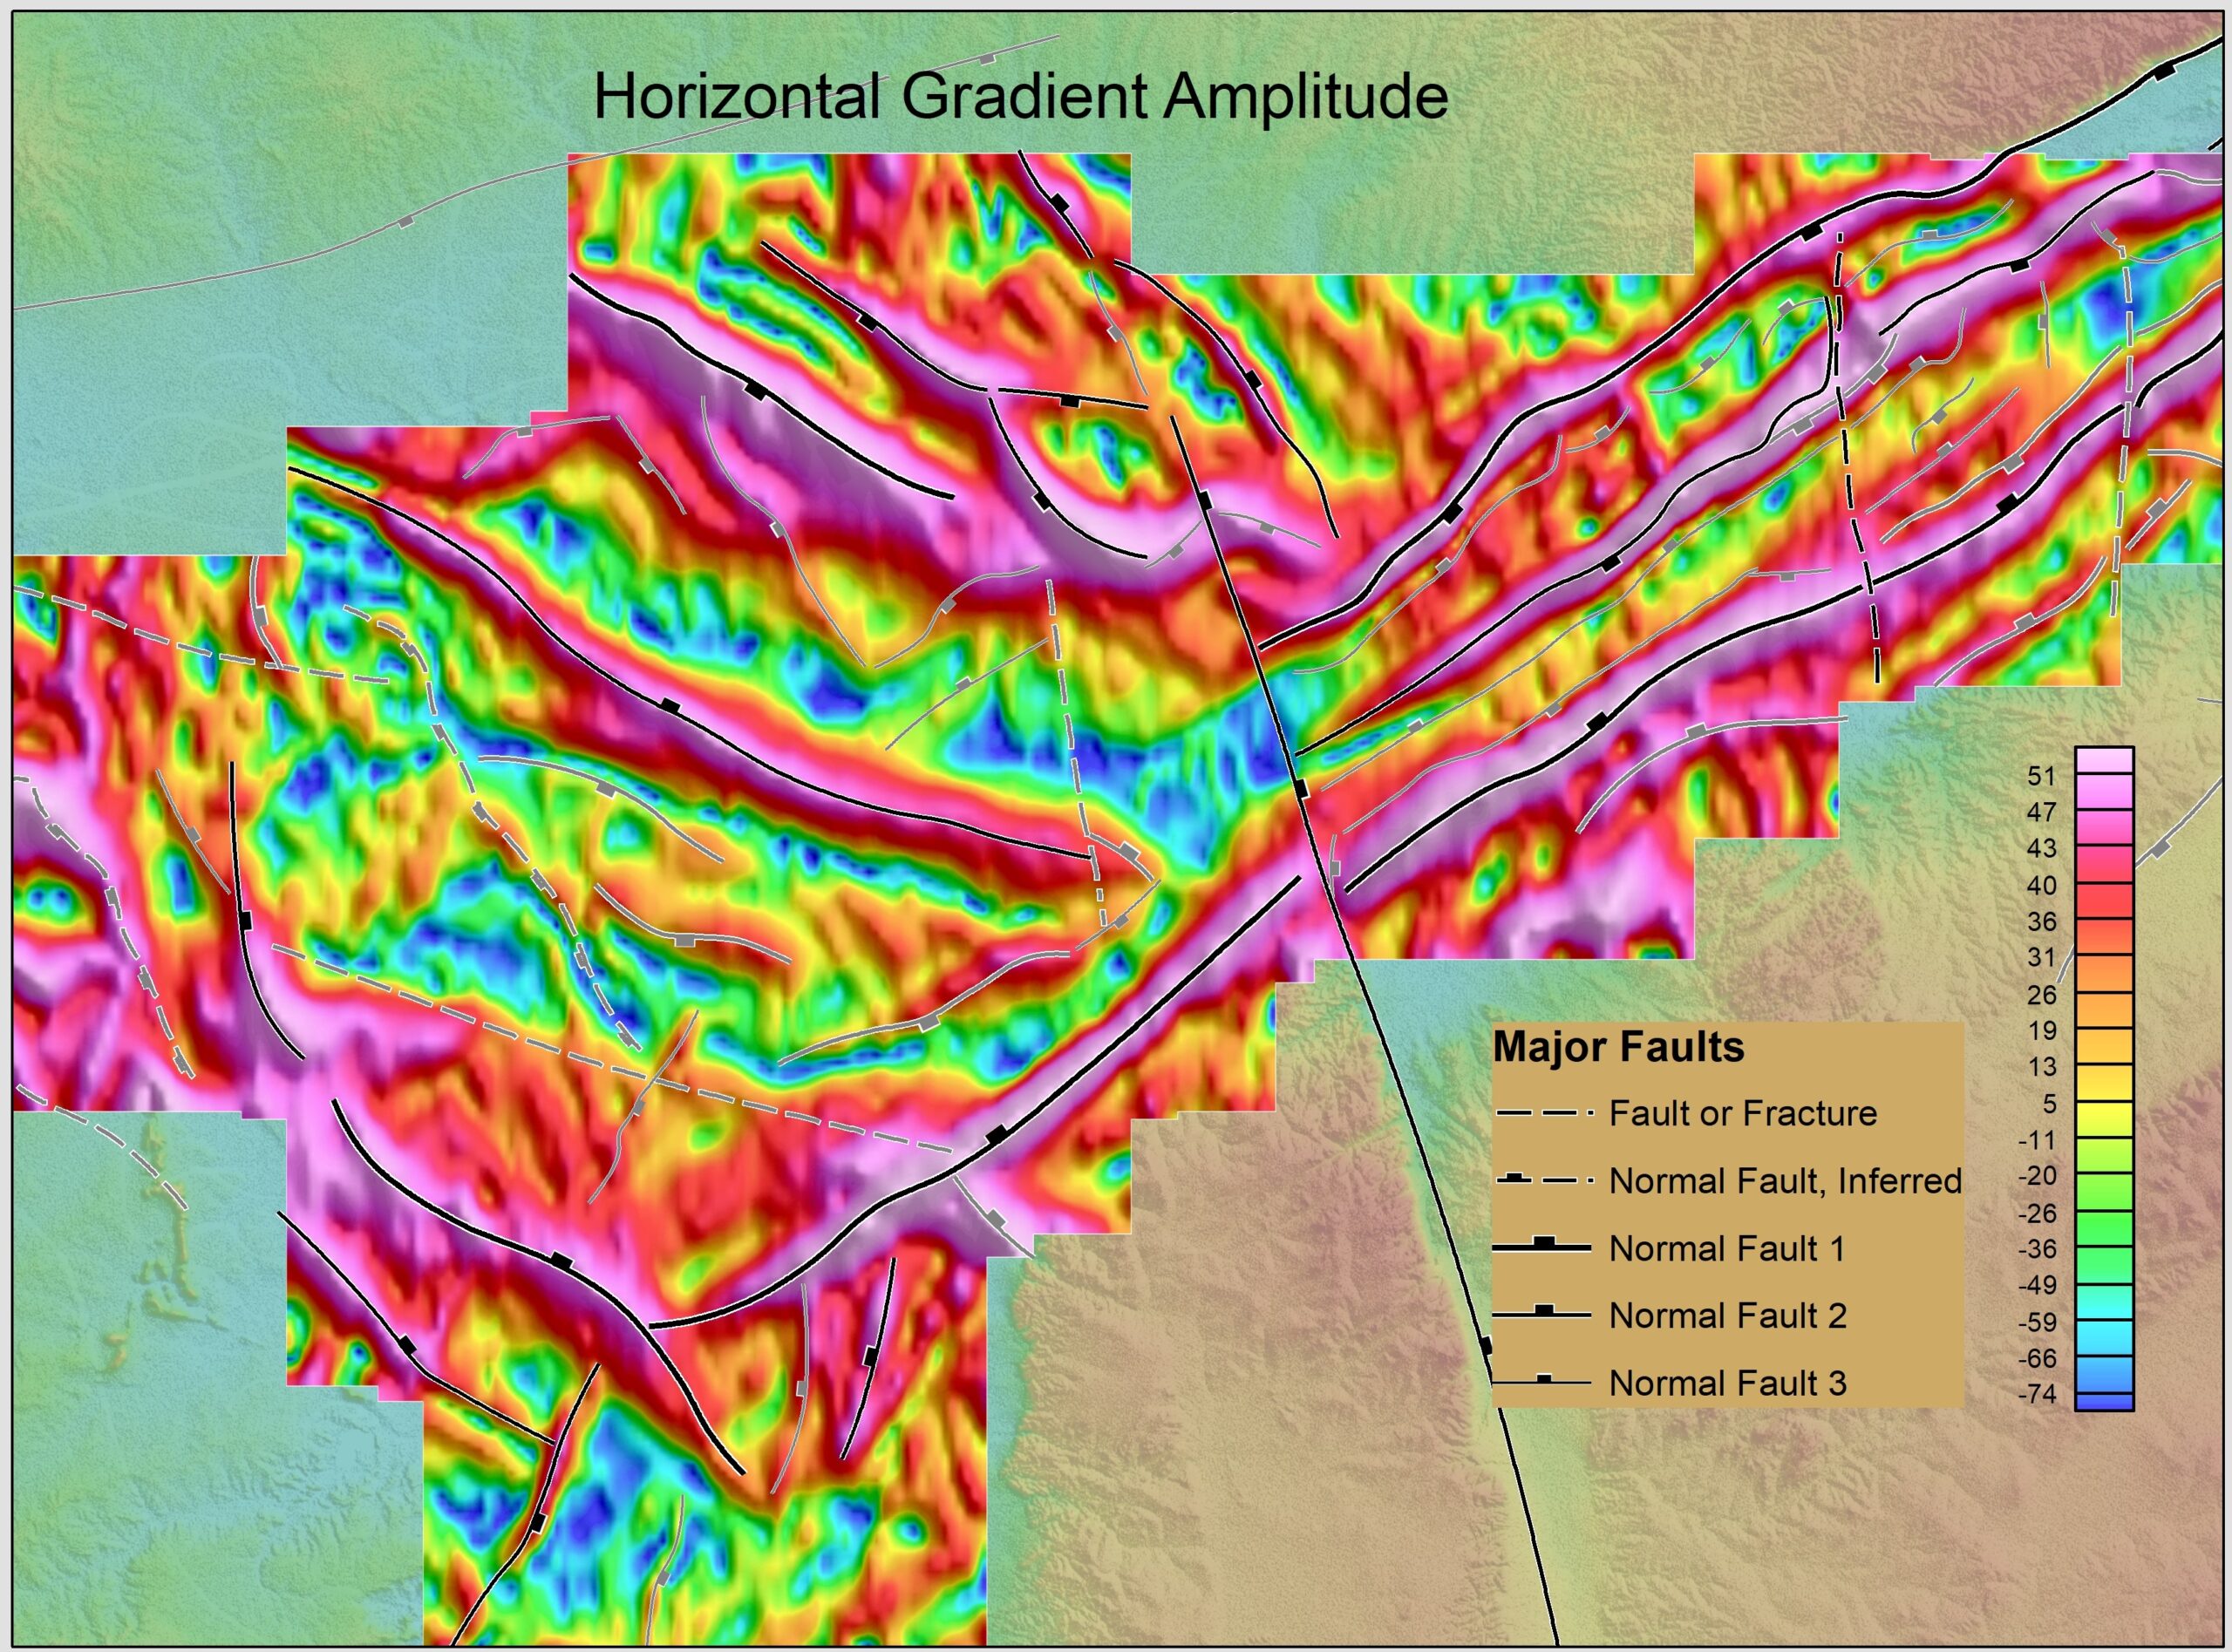
Horizontal gradient amplitude with interpreted rift‑bounding faults and intra‑rift structures.
Exploration metrics from TPDC’s Eyasi Wembere Basin project
The following metrics summarise the scope of the survey that mapped several major rift-bounding faults, intra-basinal structures and sediment thickness to inform the seismic survey.
1123 line km
Total distance covered by airborne gravity gradiometry and magnetic acquisition
~2km
Spacing between survey lines
80 m
The altitude the survey was conducted

2D inverted layered-earth model and calculated potential field response along profile B-B’
Preparing for the next phase
The project is now entering a new phase, with ongoing seismic acquisition and plans for exploratory drilling.
Before drilling, TPDC plans to deploy electromagnetic (EM) and magnetotelluric (MT) methods to resolve areas where seismic data is inconclusive, particularly in zones where sediment and volcanic cover mask deeper structures. This will help refine interpretations and identify optimal drilling sites. Software upgrades and training are also under review to support future work.
”Volcaniclastic layers obscure seismic waves, making imaging difficult. EM data helps us understand the basin’s structure where seismic alone falls short.”
Sindi MaduhuGeophysicist, TPDC
A workflow designed for visibility and confidence
This case study highlights how gravity gradiometry and magnetic data, supported by integrated modelling in Oasis montaj, can guide seismic acquisition and exploration planning in geologically complex settings. For TPDC and the Eyasi Wembere team, it’s a foundation for deeper understanding and more confident decision making.