


Introduction
Infiltration into the vadose zone is typically studied under conditions that do not consider pore-air entrapment. Pore-air generally does not impede infiltration rates or wetting front movement when the water table is at depth. Siemens et al. (2014) considered the impedance of water infiltration due to pore-air in a closed soil system using both laboratory and numerical experimentation. An example of a closed system is a shallow soil profile with a near surface no-flow boundary, such as a low conductivity soil layer or bedrock surface. This example compares infiltration into an unsaturated soil column for the open and closed conditions. The open condition means that the soil is able to accept infiltration with no pore-air entrapment, while a no-flow boundary prevents pore-air from escaping the column in the closed system.
Background
Entrapment of the pore-air during infiltration was considered in laboratory experiments and subsequent numerical simulations conducted by Siemens et al. (2014). The experiments in the laboratory considered both open and closed systems. The open systems allowed air to escape the column via open manometers installed along the length of the columns. During the closed system experiments, these manometers are removed and air escapement is restricted. For all columns, a constant head reservoir was installed at the top of the column to ensure a constant ponded condition during the entire infiltration experiment. Figure 1 shows the approximate configuration of both the laboratory and numerical experiments used in the study conducted by Siemens et al. (2014).
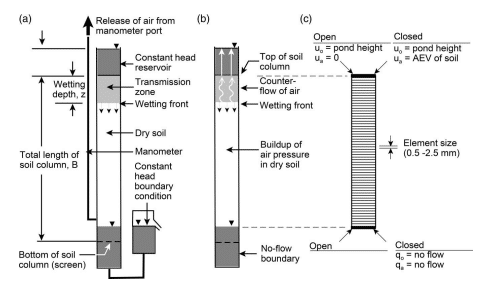
Figure 1. Laboratory and simulation configuration schematics for a) open systems, b) closed system, and c) numerical simulations conducted by Siemens et al. (2014).
There were 6 different columns developed to evaluate the influence of pore-air entrapment on infiltration under different soil conditions. Both a coarse and a fine material were used in the experiments to determine the infiltration of water in the open and closed systems of homogeneous or layered columns. All columns were approximately 1.45 m in length. The layered columns consisted of a 0.12 m thick fine layer located within a column of coarse soil from the elevation of 0.66 to 0.78 m. For the numerical simulations, only the soil portion of the column was simulated, with the boundary conditions at the surface and bottom boundaries representing the constant head or no flow conditions of each. A transparent quartz soil was used for the laboratory experiments with a mineral oil mixture, instead of water, to capture the wetting front and saturated zones digitally (Siemens et al., 2014).
Numerical Simulation
The example includes four of the numerical scenarios described by Siemens et al. (2014). The first two analyses consider the open systems for the homogeneous coarse soil and the layered system (Figure 2). The last two analyses consider the same soil conditions under a closed system. For the open systems, only the water transfer physics option is activated, as the pore-air phase is not considered. The closed systems activate the air transfer process, with the water transfer process also active on the same domain, to simulate both water infiltration and air entrapment within the soil column.
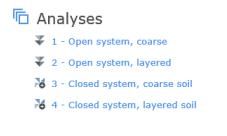
Figure 2. Analysis Tree for the Project.
The surface pond in all analyses is simulated using a pressure head boundary condition of 0.12 m. The open systems are simulated with a potential seepage face boundary condition applied to the bottom node of the domain to allow drainage from the column when saturated conditions develop. The surface node in the closed systems also includes a zero pore-air pressure boundary representing an atmospheric boundary. The bottom boundary of the column in the closed systems does not have a boundary condition applied so that both water and air flow is restricted (i.e. no flow boundary).
The unit weight of water (under the Water tab of the Define Analyses window) is defined as 8.28607kN/m3 to simulate the infiltration of an oil mixture (Figure 3). The initial conditions of each of the analyses were defined using spatial functions. For the coarse and layered columns, a pressure head of -0.13 m was assumed as the initial condition for the entire column.
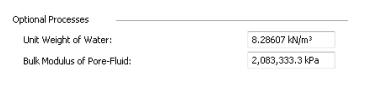
Figure 3. Unit weight of water modified to consider the density of the oil mixture.
The saturated-unsaturated material model was used to represent the hydraulic material properties of the fine and coarse materials. The volumetric water content functions used for each material are shown in Figure 4. The saturated hydraulic conductivity for the fine and coarse materials is 4 x 10⁻⁵m/sec and 1 x 10⁻³ m/sec, respectively (Figure 5). Siemens et al. (2014) assumed a minimum hydraulic conductivity for the fine and coarse soils of 9.1 x 10⁻¹⁰ m/sec and 1.1 x 10⁻⁷ m/sec, respectively, so the hydraulic conductivity functions are truncated at these values. The dry soil air conductivity for the fine and coarse soils is 2 x 10⁻³ m/sec and 8 x 10⁻³ m/sec, respectively (Figure 6).
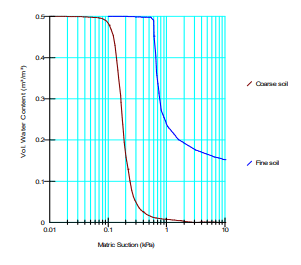
Figure 4. Volumetric water content functions.
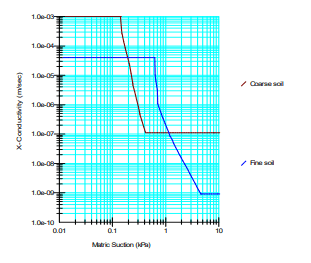
Figure 5. Hydraulic conductivity functions.
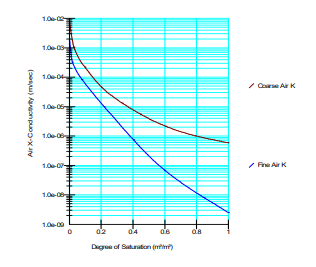
Figure 6. Air conductivity functions.
The global element size is set to 2 mm for the entire column. The total duration of each simulation is dependent on the material type and time required for the column to reach the equilibrium pore-water pressure.
Results and Discussion
Figure 7 shows the equilibrium pore-water pressure profiles for each analysis at the final time steps. All numerical analyses compare favorably to the laboratory results. Both of the closed systems reached the same equilibrium pore-water pressure profile, with a linear profile from approximately 1 kPa at the surface node and 9.7 kPa at the bottom node (i.e. fully saturated). The homogeneous open system also reached a linear pore-water pressure profile, with the top and bottom nodes at approximately 1 kPa and 0 kPa, respectively, based on the constant head and potential seepage face boundary conditions applied at the nodes. The open, layered analysis shows the same top and bottom node pore-water pressure conditions given the boundary conditions, but the profile within the column is no longer linear. The fine layer causes water to pond, while the coarse soil remains unsaturated beneath the fine layer because of the decreased infiltration rates.
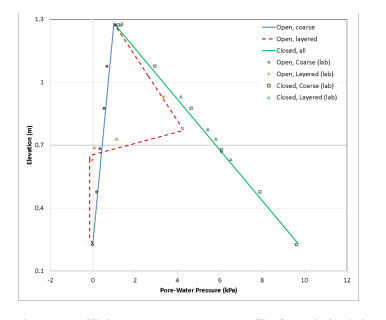
Figure 7. Equilibrium pore-water pressure profiles for each simulation and laboratory results (Siemens, et al. 2014).
During infiltration in the open systems, the potential seepage face at the bottom node of the column reached saturation in the coarse and layered systems at approximately 6 and 14 minutes, respectively (Figure 8). When air entrapment is considered, the time taken to reach the equilibrium pore-water pressure is much longer, with the coarse system reaching equilibrium pore-water pressure at approximately 20 minutes and the layered system at approximately 6.3 hours. The water infiltrates via gravity flow prior to saturation in the coarse soil being reached, leading to the air entrapment in the closed system.
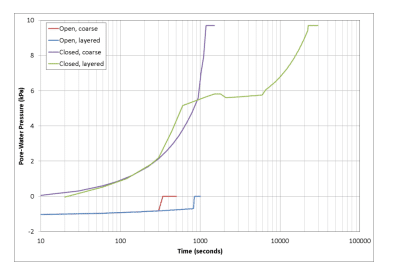
Figure 8. Pore-water pressure with time at the bottom node of the column for each analysis.
Figure 9 and Figure 10 present the pore-water and pore-air pressure profiles at four time steps for the closed system using the coarse soil. Considering the pore-water pressures in isolation, it would appear that the column is fully saturated as the pore-water pressures are positive. The pore-air pressures, however, begin to increase at the onset of infiltration due to entrapment. The corresponding matric suction, which is calculated as the difference between the air and water pressure, is positive. The soil beneath the wetting front is, therefore, unsaturated. It should be noted that the pore-air pressures and matric suctions reported by GeoStudio in the saturated portion of the domain are simply a relic of the continuum formulation, which assumes that the air phase is present throughout the domain. It is for this reason that negative matric suctions are presented on the graph and the matric suction is not perfectly zero after nearly 16 minutes.
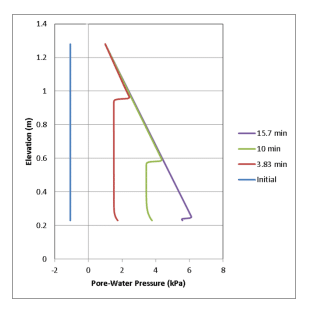
Figure 9. Pore-water pressure profiles for closed coarse soil system.
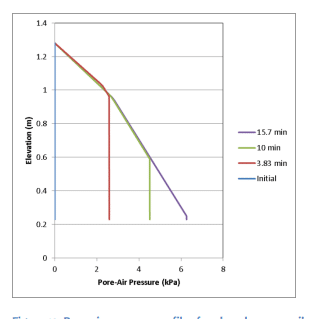
Figure 10. Pore-air pressure profiles for closed coarse soil system.
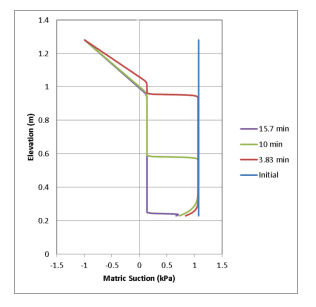
Figure 11. Matric suction profiles for closed coarse soil system.
For brevity, only the matric suction profile is presented for the layered, closed system (Figure 11). As noted above, the development of excess pore-air pressure increases the time to full-saturation to 6.3 hours compared to the open system. Positive matric suction is maintained in front of the wetting front up until this time. Again, the negative matric suction values do not have any meaning, except to imply that the entire column is saturated and all pore-air has been displaced.
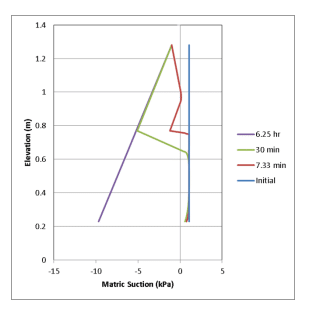
Figure 11. Matric suction profiles for closed layered soil system.
To further compare the open vs. closed systems, the saturation profiles over time for the two layered cases are discussed. The wetting front in the open system begins to slow once it reaches the fine layer at the center of the column (Figure 12). Similar behavior was simulated by Siemens et al. (2014) and the laboratory experiment (Figure 13). Once the wetting front moves past this fine layer, the saturation levels only reach approximately 0.7 as water continues to infiltrate toward the bottom of the column. This would be a result of the fine layer reducing the downward flow given the lower conductivity of the layer. The pore-water pressure below this layer never reaches positive values, as indicated above in Figure 7.
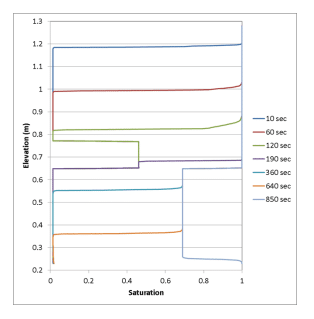
Figure 12. Saturation profiles for the open, layered simulation.
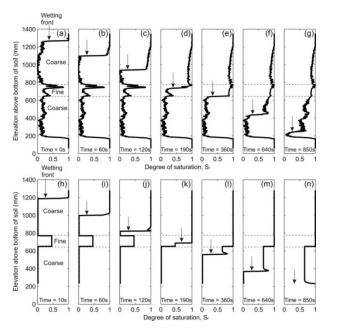
Figure 13. Saturation profiles for the open, layered laboratory experiment and simulation (bottom pane) conducted by Siemens et al. (2014).
In the closed system, the movement of the wetting front down the column is slowed even more due to the development of positive pore-air pressures. Infiltration reaches the fine layer in the simulation at approximately 7 minutes in the analysis (Figure 14), which is similar to that experienced in both the simulation and laboratory experiment (Figure 15) conducted by Siemens et al. (2014). Air pressure builds up in the upper column until the water reaches the fine layer. Then ponding occurs on top of the fine layer because of the decrease in the hydraulic conductivity. This causes water to pond and fill the unsaturated zone above the fine layer, forcing air to “bubble” up out of the column. Once fully saturated, the wetting front continues to move down the fine layer and into the underlying coarse layer. Again, a pocket of air forms as air pressure increases, until infiltration reaches the bottom of the column. The water again begins to pond when it reaches the no-flow boundary and moves up the column until the equilibrium pore-water pressure profile is reached (Figure 7).
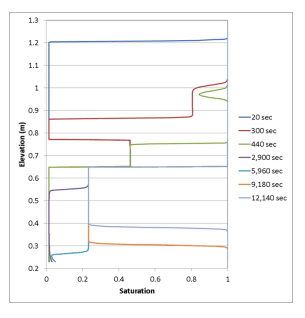
Figure 14. Saturation profiles for the closed, layered simulation.

Figure 15. Saturation profiles for the closed, layered laboratory experiment and simulation conducted by Siemens et al. (2014).
A subdomain graph was created from an elevation of 0.984 m to 1 m. Figure 16 shows the change in both the saturation of air and water within the soil pores over time at an elevation of 1 m (top of the subdomain). As infiltration nears 1 m, the air content suddenly drops and the air begins to “bubble” up the column. This “bubbling” is shown by the negative air rate flowing up and out of the top node of the subdomain. As the air content decreases, the water content increases until the coarse soil becomes saturated via the pond forming at the top of the fine layer.
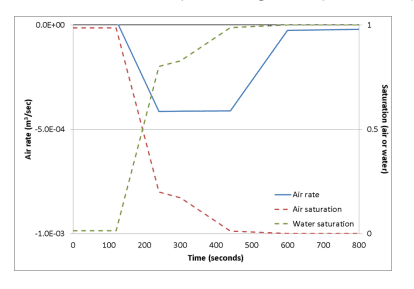
Figure 16. Air rate, air saturation and water saturation vs. time at elevation of 1m in closed, layered system.
Summary and Conclusions
This example illustrates the effect of pore-air entrapment during infiltration into an unsaturated soil for a closed system. The analyses compare well with the laboratory and simulated results obtained by Siemens et al. (2014). In the closed systems, air pockets form under the wetting front and force the infiltration to reach the bottom of the column before the entire is soil is saturated. Ponding occurs and water must then move up the column until the equilibrium pore-water pressure is reached.
The addition of the fine layer near the center of the column adds more complexity to the analysis, as the fine layer decreases the rate at which the infiltration can reach the lower half of the column. In the open system, the lower coarse soil never becomes fully saturated, as water is able to discharge from the column at a saturation level near 0.7. The closed system, however, forces the air to “bubble” out of the surface of the column until saturation is reached.
References
Siemens, G.A., Take, W.A., and Peters, S.B. 2014. Physical and numerical modeling of infiltration including consideration of the pore-air phase. Canadian Geotechnical Journal 51: 1475-1487.