


With the UAV Workflow you plan, acquire and process your drone magnetics data and perform all the key steps to prepare your data for targeting and modelling.
The webinar will focus on the major benefits of using the UAV Workflow in Oasis montaj and what concepts to consider before you start.
Join Seequent’s Joanne Demmer (Project Geophysicist) and Mark Lowe (Senior Project Geophysicist) who will discuss:
- An overview of the UAV Workflow in Oasis montaj and examples of using drone magnetics.
- Survey Planning – how to design a UAV survey allowing for VLOS, no-fly zones and survey drape.
- Visualising and sharing survey results.
Overview
Speakers
Joanne Demmer
Project Geophysicist – Seequent
Mark Lowe
Senior Project Geophysicist – Seequent
Duration
35 min

See more on demand videos
VideosFind out more about Oasis montaj
Learn moreVideo Transcript
[00:00:01.750]
<v Joanne>Hello everyone</v>
[00:00:02.710]
and welcome to this months Technical Tuesday.
[00:00:06.830]
I’m just going to wait for one minute before starting
[00:00:10.060]
just to give everyone a chance to get connected
[00:00:12.540]
and to join the session.
[00:01:01.590]
Thank you all for joining this months
[00:01:03.380]
Technical Tuesday session,
[00:01:05.590]
which is on How To Plan A Drone Magnetic Survey
[00:01:09.290]
Using The UAV Extension In Oasis Montaj.
[00:01:15.297]
I’m Joanne Demmer, a project geophysicist
[00:01:18.500]
at Seequent Australia.
[00:01:25.320]
In this session,
[00:01:26.390]
we’ll cover why collect magnetic data with a drone?
[00:01:30.990]
We’ll go through some case study examples.
[00:01:34.680]
I’ll give you some tips and tricks on survey planning.
[00:01:39.180]
We’ll go through a quick outline of the processing workflow.
[00:01:43.790]
And finally, tips on how to visualize
[00:01:46.440]
and share your results.
[00:01:50.220]
So what is a UAV?
[00:01:52.690]
UAV is short for unmanned aerial vehicle
[00:01:56.550]
and they’re commonly referred to as drones.
[00:02:00.980]
In the last decade, they’ve been many advances
[00:02:03.150]
in the commercialization of UAV systems
[00:02:06.630]
and developments in sensor technology,
[00:02:09.360]
which is changing how we investigate the surface
[00:02:12.430]
and the subsurface of the earth.
[00:02:16.570]
Drones provide a means to acquire high resolution
[00:02:19.560]
magnetic data at a fast pace.
[00:02:23.230]
They are lightweight, powerful
[00:02:25.490]
and improvements in battery technology
[00:02:27.700]
have increased flight times, payloads and ranges.
[00:02:32.640]
Drones can easily and cheaply go where humans can’t
[00:02:36.230]
and they don’t put people at risk.
[00:02:39.840]
So when would you consider doing a drone magnetic survey?
[00:02:44.090]
UAV surveys are not displacing the conventional ground
[00:02:47.480]
or airborne surveys,
[00:02:49.370]
rather filling the gap between them.
[00:02:52.910]
Consider doing a drone survey if you have, for example,
[00:02:56.980]
an area of steep terrain
[00:02:59.290]
that is too rugged for a helicopter to draw it adequately.
[00:03:03.800]
An area too dangerous to access by foot.
[00:03:06.930]
Perhaps you’ve got marshlands, tailings
[00:03:10.000]
or danger zones that contain unexploded ordinance.
[00:03:14.850]
Or a densely populated area or farmland.
[00:03:19.120]
Drones are quiet so reduce disturbance
[00:03:22.500]
to residents and livestock.
[00:03:27.730]
So what types of problems
[00:03:29.120]
can a drone magnetic survey resolve?
[00:03:33.810]
They can be used to locate near surface buried objects
[00:03:37.410]
or infrastructure with a magnetic signature.
[00:03:41.100]
For example, archeological discoveries
[00:03:43.590]
or detecting buried cables or unexploded ordinance.
[00:03:50.000]
This first example shows the results from a Mag Arrow survey
[00:03:54.740]
that was conducted to detect and delineate
[00:03:57.680]
buried oil and gas pipelines.
[00:04:00.960]
The pipes can be identified from the TMI grid on the left,
[00:04:05.300]
which shows high anomalies that have a linear trend.
[00:04:12.320]
Drone magnetic surveys can also detect hazards
[00:04:15.870]
such as sink holes or mine shafts.
[00:04:19.790]
This example, also a Mag Arrow survey,
[00:04:24.080]
was conducted to identify abandoned oil and gas wells,
[00:04:27.960]
and the results were compared with legacy data.
[00:04:32.470]
The TMI highs on the grids on the left
[00:04:36.130]
highlight well locations.
[00:04:39.030]
These have been plotted in blue
[00:04:41.550]
on the Mag heat map on the right
[00:04:44.430]
and compared with the legacy locations
[00:04:46.430]
that have been plotted in black.
[00:04:49.560]
As you can see, the old information was not very accurate.
[00:04:58.030]
Drone magnetic surveys can also map
[00:05:00.640]
environmental contamination.
[00:05:04.320]
The results from this Mag Arrow survey
[00:05:06.800]
were used to characterize a landfill site
[00:05:10.766]
and it was used to identify areas with buried steel
[00:05:14.230]
and isolate areas with buried organic waste
[00:05:18.010]
to try and assess the volume
[00:05:19.360]
of potential methane gas emissions.
[00:05:24.080]
The data from the three examples I’ve shown
[00:05:27.950]
were provided by Ron Bell of Geometrics,
[00:05:31.340]
and they’ve been presented at past sequence Lyceum events.
[00:05:36.770]
Our fourth and final example demonstrates
[00:05:39.830]
how and why drone magnetics is being used
[00:05:42.660]
in mineral exploration.
[00:05:45.459]
A senior project geophysicist, Mark Lowe,
[00:05:48.430]
talked to Adam Kroll,
[00:05:50.090]
the principle geophysicist at AirGEOX
[00:05:53.310]
about their recent Near Mine Project.
[00:05:57.080]
<v ->Hi, my name is Adam Kroll.</v>
[00:05:58.600]
I’m the principle geophysicist of AirGEOX
[00:06:01.780]
a drone magnetometer acquisition company.
[00:06:05.070]
These are my details down here in the bottom left
[00:06:07.570]
in case you want to contact me after this presentation,
[00:06:10.930]
and thanks Mark for inviting me.
[00:06:13.140]
So these are a couple of the drones that we use.
[00:06:14.517]
We’ve got to Gasser Heli at the top
[00:06:17.100]
and a Gasser Electric Hybrid Multirotor
[00:06:20.980]
down the bottom there.
[00:06:21.960]
That’s the one we’ve developed ourselves
[00:06:24.310]
and flies for about an hour and a half up to two hours.
[00:06:28.940]
This is magnetometer that we’ve developed ourselves.
[00:06:33.640]
We use a magnetometer that has a sensitivity
[00:06:35.810]
of one picoTesla per square root Hertz.
[00:06:38.190]
So about the same as a gem or Cintrix magnetometer.
[00:06:44.140]
In the nose here, we also have our
[00:06:48.330]
GPS IMU laser altimeter,
[00:06:50.520]
data acquisition system,
[00:06:53.060]
all that good stuff and a battery
[00:06:54.510]
that gives it two hours flight time,
[00:06:56.600]
and the best thing, 500 grams weight
[00:06:58.760]
so great for endurance of a drone.
[00:07:04.230]
Essentially all of the,
[00:07:07.320]
everything we’ve done to design this bird has been to
[00:07:11.340]
develop the highest sensitivity,
[00:07:13.920]
most accurate magnetometer data possible.
[00:07:17.580]
So the magnetometers in the tail,
[00:07:19.000]
whereas all the electronics are in the nose.
[00:07:21.010]
We also towed the magnetometer bird down here,
[00:07:25.830]
20 meters under the multirotor by a rope.
[00:07:29.290]
And that removes it from any of the electromagnetic noise
[00:07:31.730]
generated from the multirotor.
[00:07:34.870]
Now this survey that I’m going to talk about
[00:07:36.410]
is a near mine site exploration for gold
[00:07:42.040]
hosted in ironstone sediments.
[00:07:44.750]
So obviously being iron, it’s magnetic,
[00:07:47.510]
the best technique is using a magnetometer.
[00:07:51.590]
The problem that the client has is that
[00:07:53.560]
they’ve flown the area with a plane
[00:07:57.370]
and they’ve covered a lot of the ground
[00:07:59.267]
with this ground magnetics.
[00:08:00.830]
Problem with the ground magnetics is that
[00:08:02.450]
they hadn’t had a makeymite there
[00:08:04.070]
and the makeymite produces a lot of really high frequency,
[00:08:07.410]
high intensity results that obscure the deposits
[00:08:11.469]
that they’re looking for.
[00:08:13.150]
And what we found is that that 15 meters altitude
[00:08:17.420]
were effectively filtering out that makeymite noise,
[00:08:21.360]
but we’re seeing deposits
[00:08:22.900]
sort of 15 meters diameter and larger.
[00:08:26.262]
I’ll you a little video of how assist flies.
[00:08:30.858]
(drone engine revving)
[00:08:32.316]
And is the drone up here and the bird down the bottom.
[00:08:37.011]
(drone engine revving)
[00:08:43.627]
And as you can see, 15 meters is a really low altitude.
[00:08:46.760]
It’s not that high above the car.
[00:08:49.090]
And that’s all good and well when you’ve got flat ground
[00:08:51.480]
like this with low level traps.
[00:08:54.990]
But what happens when the client says,
[00:08:57.640]
can you fly over our pit, our open pit, and our dump.
[00:09:03.220]
Flying it that at 15 meters is a little bit hairy,
[00:09:05.440]
but we said, oh, we’ll give it a go.
[00:09:08.580]
So what we did was
[00:09:12.570]
we,
(clearing throat)
[00:09:13.810]
sorry, and here’s a just at the bottom here is a
[00:09:17.360]
it shows that we’re sort of at 330 meters altitude there,
[00:09:20.440]
it drops by 45 meters into the pit, comes out and then the
[00:09:25.680]
dump is 15 meters high.
[00:09:30.370]
So we flew along and as we descended it was going okay.
[00:09:35.460]
And then it went across the pit floor,
[00:09:39.070]
but the trouble started when we started climbing.
[00:09:42.380]
So the drone stopped its horizontal movement
[00:09:45.200]
and then started climbing vertically.
[00:09:47.300]
But the momentum of the bird kept it moving forward.
[00:09:50.670]
And essentially the bird just smashed into the pit wall
[00:09:53.820]
and it dragged off the hole out of the pit wall,
[00:09:58.700]
which really wasn’t nice to see.
[00:10:01.030]
And yeah, pretty much storied out bird.
[00:10:03.170]
So we went to the client and we said,
[00:10:06.350]
you know, we can’t do this.
[00:10:07.790]
We can’t descend into the pit.
[00:10:09.690]
What we’ll do is we’ll just descend say 15 meters
[00:10:12.530]
and then fly level through the pit.
[00:10:14.940]
And so to do that, I generated a DEN
[00:10:18.990]
where if you see here we’ve got the DEN,
[00:10:22.010]
but then it flat lines
[00:10:23.750]
after we’ve descended 15 meters into the pit.
[00:10:26.800]
So that’s what we did.
[00:10:28.370]
So we flew to that flight profile and here,
[00:10:31.620]
you know, Y system shows our GPS altitude, the DEN,
[00:10:36.970]
the drawing essentially flies along, drops at 15 meters,
[00:10:40.710]
flat lines over the pit, climbs again.
[00:10:43.230]
And it does a pretty good job of climbing the dump.
[00:10:47.800]
So everything went well after that little test.
[00:10:53.360]
So let’s have a look now at
[00:10:56.740]
whether we achieved what the client wanted to achieve.
[00:10:59.810]
So this is the plain magnetic data that they had previously
[00:11:06.950]
and this is at a high resolution drone magnetic data.
[00:11:12.095]
So from the outset, all of the features is the same.
[00:11:15.670]
One thing to note is that over the mine site,
[00:11:18.630]
there was no adverse effects from flying
[00:11:24.780]
over the pit or over the dump.
[00:11:27.300]
We can see here, there’s really not much going on there.
[00:11:30.600]
There is some ironstone here off to the side of the pit,
[00:11:37.014]
which is a depth.
[00:11:38.820]
And there’s probably some
[00:11:40.110]
small amount of dumped ironstone there,
[00:11:42.900]
but generally everything went well over there.
[00:11:45.570]
But can we detect the small ironstone deposits
[00:11:48.480]
that they’ve paid us to detect?
[00:11:51.320]
If we scroll over here a little bit,
[00:11:53.080]
we can see there’s a large ironstone deposit
[00:11:55.780]
and here’s a little anomaly off to the side.
[00:11:58.670]
So if we zoom into that and we measure it up,
[00:12:03.250]
we can say that that’s about a 25 meter wide anomaly
[00:12:08.560]
in both directions.
[00:12:11.530]
And if we look at the ground,
[00:12:14.320]
we can sort of see tracks coming off here,
[00:12:16.420]
perhaps drilling was done over here but
[00:12:20.814]
for this spot doesn’t look like any drilling
[00:12:23.860]
has been done there in the past.
[00:12:25.690]
And so that’s exactly what the client wanted to see.
[00:12:28.960]
High frequency, normally anomalies is like that.
[00:12:31.020]
And as we can see, the data’s really smooth.
[00:12:34.420]
Really nice.
[00:12:36.990]
We don’t see makeymite
[00:12:39.010]
so these ironstone deposits stand out.
[00:12:42.101]
So it’s a good result for the client.
[00:12:43.870]
We’ve flown now thousands of line kilometers
[00:12:46.010]
for them over this area and that relationship continues
[00:12:50.300]
because essentially they’re happy that the drone data
[00:12:54.470]
is providing them with something that they can’t get
[00:12:56.510]
from ground mag and they can’t get it
[00:12:58.240]
from traditional airborne mag methods.
[00:13:01.630]
Thank you for your time.
[00:13:04.920]
<v Joanne>Tips and tricks on how to plan</v>
[00:13:06.750]
a dry and magnetic survey.
[00:13:09.660]
So I’ve created a new project in Oasis Montaj,
[00:13:14.200]
and I’ve loaded the UAV extension.
[00:13:18.850]
The first option is survey planning.
[00:13:23.180]
So it’s really easy to plan a UAV survey
[00:13:25.820]
and to create a flight line plan.
[00:13:28.540]
All you need is a DTM grid
[00:13:31.040]
and an area of interest polygon file.
[00:13:35.430]
If you don’t have a DTM or it’s not an adequate resolution,
[00:13:39.830]
you can use the public tab to download free SRTM data.
[00:13:48.370]
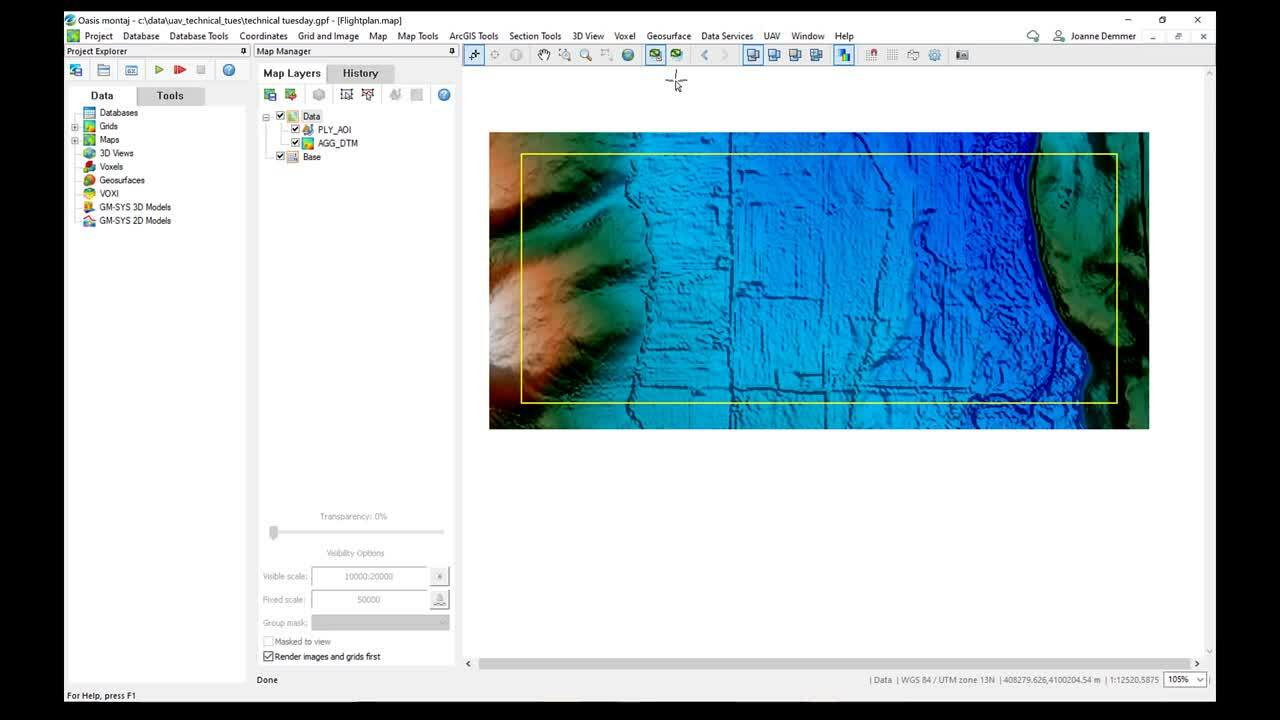
You can define an area of interest
[00:13:50.260]
using CAD tools in Oasis Montaj.
[00:13:53.550]
This area can be inclusive or exclusive
[00:13:57.180]
if you need to navigate over or around cultural obstacles,
[00:14:02.510]
such as pylons or property.
[00:14:07.530]
The area bound by the yellow box
[00:14:11.270]
is an inclusive area of interest.
[00:14:14.652]
And I’m going to modify this
[00:14:16.720]
to incorporate an exclusion zone.
[00:14:21.340]
To do that, I go to map tools, CAD tools,
[00:14:25.810]
and I’m going to create a polygon PLY file.
[00:14:33.380]
My area is going to be exclusive,
[00:14:37.330]
and I’m going to append this to the current
[00:14:39.930]
AOI polygon file.
[00:14:44.369]
I’m going to draw this interactively on the map.
[00:14:50.450]
So there is a property here which
[00:14:55.160]
we’re not allowed to fly over.
[00:14:57.860]
So I’m going to
[00:15:01.760]
create an exclusion zone over that,
[00:15:08.480]
and redraw my polygon file.
[00:15:16.870]
So I’ve now added the exclusion zone to my area.
[00:15:24.320]
So once I’ve defined my area of interest,
[00:15:27.810]
I can go back into the UAV extension and plan a UAV survey.
[00:15:37.950]
The data that I’m using for this example
[00:15:40.190]
was a Mike Arrows survey
[00:15:43.430]
on data was supplied by Ron Bell from Geometrics.
[00:15:50.100]
So I’m going to give it a survey name.
[00:15:55.673]
I’m going to define the area of interest polygon file
[00:15:58.220]
that I’ve just made.
[00:16:03.070]
It’s automatically detected the coordinate system
[00:16:06.120]
based on this polygon.
[00:16:10.620]
So I’m going to plan my UAV survey to a DEM grid
[00:16:13.560]
and specify the DEM grid here.
[00:16:18.590]
You can also plan to a constant elevation.
[00:16:25.500]
A terrain clearance flight line and flight line spacing
[00:16:30.680]
should all be decided based on your target of interest
[00:16:36.520]
and the depth of the target and its orientation.
[00:16:42.730]
Drones can fly really close to the ground
[00:16:45.590]
so this improves signal strength.
[00:16:49.050]
I’m going to put a terrain clearance of 35 meters
[00:16:52.490]
in this example.
[00:16:53.810]
And my flight lines are going to be east-west.
[00:16:57.270]
So 90 degrees.
[00:17:03.560]
And the flight line spacing, I’m going to put 50 meters.
[00:17:08.010]
You can choose to add tie lines,
[00:17:11.550]
it’ll automatically calculate the flight line spacing
[00:17:16.490]
at 10 times the flight line spacing.
[00:17:19.640]
I would recommend adding the tie lines in a separate
[00:17:24.880]
flight plan and merge them in later on,
[00:17:29.490]
this will improve your leveling.
[00:17:34.920]
You can also display the results in 2D and or 3D.
[00:17:41.570]
Under the more options,
[00:17:46.560]
you have further options to
[00:17:51.260]
change the sample spacing.
[00:17:57.100]
You can change the line extension
[00:17:59.410]
beyond the area of interest.
[00:18:01.440]
I’m going to put 10 meters.
[00:18:06.210]
This is advisable to accommodate four terms and also
[00:18:12.160]
push end of line processing artifacts
[00:18:14.990]
outside of the chargeable kilometers boundary.
[00:18:21.597]
You can also change the numbering and the number increment.
[00:18:30.580]
If there is a particular area of interest
[00:18:32.550]
that you want to force your flight plan over,
[00:18:35.480]
you can include weigh points
[00:18:37.710]
and you can locate these interactively on the map.
[00:18:47.590]
If I want to force my flight plan over this point,
[00:18:52.200]
I can.
[00:18:59.080]
So under drape options,
[00:19:00.480]
you can calculate a drape survey altitude for the drone.
[00:19:06.990]
So drones can
[00:19:09.830]
cope with severe changes in elevation really well
[00:19:12.400]
and they can stick to tightly draped flight plans.
[00:19:16.040]
So there’s no need to smooth the drape
[00:19:21.036]
and the climate descent angles can be near vertical.
[00:19:25.130]
I’m going to put 90 degrees.
[00:19:28.980]
So the ability to collect data
[00:19:31.180]
at a consistent height above the ground
[00:19:33.270]
significantly improves data quality
[00:19:35.840]
and interpretation later on.
[00:19:41.730]
So once you’re happy with your settings,
[00:19:46.190]
you can hit okay.
[00:19:49.880]
This step produces a survey report,
[00:19:52.070]
which gives you the line kilometers
[00:19:54.620]
for each plan survey line,
[00:19:58.400]
along with the total line kilometers for all of the lines.
[00:20:01.870]
It gives you the kilometers
[00:20:05.307]
for all of the area and just the area inside
[00:20:09.040]
the area of interest.
[00:20:13.000]
It also produces a flight plan database.
[00:20:19.860]
All of the flight planned lines are shown.
[00:20:22.340]
Note how it split the line around the exclusion zone
[00:20:27.160]
by appending a version one.
[00:20:31.160]
Each line is defined X, Y, latitude, longitude,
[00:20:35.830]
DEM and drape value.
[00:20:38.540]
You can view the flight plan in 3D,
[00:20:46.941]
or in 2D.
[00:20:50.497]
And note how it’s split the lines
[00:20:52.850]
around the exclusion zone there.
[00:20:54.840]
You can also export the flight plan as a K and Z
[00:20:57.850]
and view it in Google Earth.
[00:21:02.280]
So how do you take into account
[00:21:04.160]
short fluctuations of drones?
[00:21:07.290]
So you can generate sorties within the survey area
[00:21:11.000]
based on the drone’s flight range.
[00:21:13.640]
And you can do this back in the UAV extension
[00:21:16.780]
in survey planning to find sortie sub areas.
[00:21:22.560]
So this allows you to take the master flight plan
[00:21:26.010]
that we’ve just made and split it up into sub areas.
[00:21:33.640]
The sortie in length is in meters,
[00:21:37.358]
and this is calculated from the maximum flight time
[00:21:40.990]
of the drone in seconds.
[00:21:44.860]
Each sortie sub area polygon
[00:21:47.930]
is calculated to cover 90 percent of this value.
[00:21:53.080]
10 percent is reserved to allow for distance
[00:21:55.550]
traveled to and from the takeoff location.
[00:22:00.810]
You can include sub area overlap,
[00:22:04.200]
and this is recommended to improve leveling.
[00:22:07.550]
And then reduce this to 20 meters
[00:22:09.930]
and the lateral sub area overlapped to 10 meters.
[00:22:14.960]
And then I’m going to hit, okay.
[00:22:19.150]
This has created eight sub areas,
[00:22:24.150]
and it’s added a takeoff location within each sortie,
[00:22:29.020]
just shown by the white dots.
[00:22:31.980]
And these are automatically set
[00:22:33.840]
to the highest elevation point within the sub area.
[00:22:39.490]
If you want to modify the sortie sub areas,
[00:22:44.800]
you can.
[00:22:45.980]
You can add areas, delete them,
[00:22:48.590]
or interactively edit the sub area.
[00:22:53.410]
And you can also move takeoff locations.
[00:22:57.780]
To help you adjust the takeoff locations,
[00:23:01.100]
you can add Azure Map imagery to include roads,
[00:23:07.750]
and this will help you identify site access areas.
[00:23:15.050]
So the Azure Roadmap has been loaded.
[00:23:18.320]
I’m just going to untick my DT, so I can see it,
[00:23:20.740]
or you can make it transparent.
[00:23:23.610]
And I’m going to move the takeoff location
[00:23:25.990]
for sub area 1-1 and position it on this road.
[00:23:31.110]
So to do that,
[00:23:33.120]
I go back to my survey planning tools in UAV,
[00:23:36.630]
and I want to move takeoff location.
[00:23:40.170]
You can select the sub-area that you want to work in
[00:23:44.070]
and the map that you want to work on.
[00:23:47.660]
You can include access point files
[00:23:49.940]
if you’ve got positions saved in a CSV,
[00:23:53.410]
otherwise you can interactively locate the new position.
[00:24:10.140]
Once you happy with your sortie sub areas,
[00:24:14.410]
your takeoff locations and access points,
[00:24:17.480]
we need to define the sortie paths.
[00:24:20.350]
So we go back to the survey planning options
[00:24:23.370]
to find sortie paths
[00:24:25.140]
and this calculate separate flight paths
[00:24:27.800]
for each individual sortie sub area.
[00:24:31.590]
You can do this for all of the sub areas or individually.
[00:24:40.156]
I’m just going to select 1-1.
[00:24:42.880]
I’m going to extend the flight plan lines
[00:24:44.820]
10 meters beyond the sub areas polygon file.
[00:24:49.290]
And this again is to accommodate for
[00:24:52.480]
the drone turning and
[00:24:55.180]
to remove any edge effects that might creep in
[00:24:58.630]
around the survey boundary.
[00:25:03.190]
You can load each sortie
[00:25:07.120]
flight plan into individual databases,
[00:25:10.240]
and you can display the results on individual maps.
[00:25:17.750]
The survey report is appended with the line
[00:25:22.090]
title line kilometers for the sub area.
[00:25:26.210]
So stats like these are really useful
[00:25:28.480]
to estimate how much time is required to conduct the survey,
[00:25:33.130]
and also helpful to calculate how much it will cost
[00:25:38.370]
and how much you can charge the client.
[00:25:40.910]
You can use it as well to prepare project proposals.
[00:25:46.490]
This step also produces a CSV file,
[00:25:49.760]
which contains all of your takeoff locations in X,Y,Z.
[00:25:53.690]
So this is useful to put into a GPS and take with you.
[00:26:00.470]
It also produces a flight plan map of the sub-area
[00:26:06.320]
along with a flight plan database of the sub area.
[00:26:13.490]
For regions where regulations require the UAV
[00:26:16.750]
to be visible to the controller at all times during flight,
[00:26:21.100]
we can test the VLOS the visible line of sight
[00:26:26.130]
from the takeoff location.
[00:26:29.460]
We can do this in the survey planning menu,
[00:26:32.660]
the UAV extension test line of sight.
[00:26:38.970]
So we are working in a sub-area 1-1.
[00:26:45.158]
And the map we are working from was the
[00:26:46.950]
flight plan map for area 1-1.
[00:26:51.000]
We don’t have an access points file,
[00:26:52.690]
but if you had access point locations save to a CSV,
[00:26:57.880]
you can load that here.
[00:27:01.100]
To demonstrate what happens when you lose line of sight,
[00:27:05.720]
I’m going to put the terrain clearance
[00:27:06.897]
and the takeoff height to one meter.
[00:27:13.820]
The terrain clearance should be the
[00:27:17.570]
terrain clearance that you used in your flight plan.
[00:27:21.430]
And I’m going to display on map.
[00:27:27.720]
So a notification pops up
[00:27:29.170]
telling me that 89.5 percent of the points
[00:27:32.130]
on the full survey path are visible.
[00:27:35.430]
If I click okay,
[00:27:38.370]
and move this box out the way,
[00:27:42.620]
it’s displayed the area that is not visible
[00:27:45.770]
from the takeoff location on the map.
[00:27:50.050]
And you can display, you can see from the color bar,
[00:27:53.340]
the depth below the line of sight that those points are at.
[00:28:00.380]
So I can include up to four extra observers
[00:28:06.970]
and add them to points on the map
[00:28:11.760]
and see if that improves the visible line of sight.
[00:28:16.410]
So I can activate an observer
[00:28:21.210]
and I can locate their position interactively on the map.
[00:28:27.950]
And I’m going to place that observer on this road.
[00:28:34.810]
Put an observer height again of one meter
[00:28:38.310]
and display map.
[00:28:41.260]
And this time the notification is telling me
[00:28:43.400]
that a hundred percent of the points
[00:28:45.400]
on the full survey path are visible.
[00:28:48.100]
So I now know before heading out into the field
[00:28:50.390]
to conduct my drone magnetic survey
[00:28:54.290]
that all the rules and regulations have been adhere to,
[00:28:57.280]
and that the drone is visible at all times during flight.
[00:29:02.920]
So once the survey has been flown,
[00:29:05.540]
data from sorties can be imported individually
[00:29:10.080]
or in batches.
[00:29:13.030]
The UAV extension has input templates
[00:29:15.770]
for single sensor magnetic data
[00:29:18.230]
from commonly used UAV systems,
[00:29:21.120]
mainly the Mag Arrow and drone mag.
[00:29:24.780]
It does also have the ability
[00:29:27.490]
to utilize other ASCII import templates.
[00:29:33.690]
There is a full suite of processing tools
[00:29:36.360]
included in the extension.
[00:29:38.540]
These are for removing data discontinuities
[00:29:43.450]
or masking data that is acquired why the UAV is stationary.
[00:29:49.037]
You can also do base station corrections,
[00:29:51.420]
Idera for removal
[00:29:53.180]
and correct for lag and heading.
[00:29:59.310]
Repetitive tasks could be scripted
[00:30:02.250]
using the record functions.
[00:30:09.920]
So from this point,
[00:30:11.550]
you can easily merge data from individual sorties
[00:30:16.930]
into one master database,
[00:30:21.220]
and then apply leveling
[00:30:24.780]
and grit the total magnetic intensity.
[00:30:30.620]
So this near real-time processing means
[00:30:33.080]
you can QA QC really quickly,
[00:30:35.310]
and you can adjust survey parameters
[00:30:37.060]
whilst you’re out in the field.
[00:30:42.760]
Once I’ve merged each individual sortie
[00:30:45.770]
into one master database,
[00:30:48.450]
printed the TMI and leveled the data,
[00:30:55.550]
what tools are available in Oasis Montaj
[00:30:58.400]
to improve the subsurface understanding?
[00:31:03.440]
So under grid and image, there are a couple of options.
[00:31:07.620]
We can locate and plot the grid peaks.
[00:31:12.640]
So this is a target picking tool.
[00:31:15.360]
It uses Blake Cliff’s method to find peaks in a grid.
[00:31:20.860]
So I’m going to find peaks in my level TMI grid.
[00:31:29.900]
I’m not going to apply a smoothing filter.
[00:31:33.050]
This applies a hunting filter
[00:31:35.640]
to remove low amplitude high frequency noise.
[00:31:39.130]
Increasing this number reduces the number of peaks found.
[00:31:44.410]
I’m going to leave the level of peak detection to normal.
[00:31:49.430]
So the surrounding grid values in
[00:31:52.590]
all directions must be a lower value
[00:31:55.550]
for it to choose that point as a peak.
[00:32:00.450]
And I’m going to save the results as an extra line D 10
[00:32:04.860]
in my merged database.
[00:32:10.360]
This adds an extra column called grid value
[00:32:14.250]
and makes an extra line in my merged database.
[00:32:19.010]
I’m now going to plot these grid value points
[00:32:21.080]
on my level TMI grid.
[00:32:41.620]
So this is now highlighted all of the peaks
[00:32:44.960]
in my level TMI grid.
[00:32:49.250]
Another option is to calculate
[00:32:50.810]
and display the analytical signal.
[00:32:55.980]
This is done in the grid and image filters option.
[00:32:59.300]
So the analytical signal is useful for locating the
[00:33:03.010]
edges of magnetic bodies,
[00:33:05.890]
particularly why a remanence
[00:33:07.800]
and or low magnetic latitude complicates interpretation.
[00:33:13.390]
So I’m going to use my leveled TMI,
[00:33:16.130]
it’s my input.
[00:33:18.460]
You can choose to use the fast forward transform
[00:33:21.360]
or the convolutional methods.
[00:33:30.150]
This traits and analytical signal grid,
[00:33:33.770]
which you can close and then display the grid on your map.
[00:33:49.580]
Once you are happy with your results,
[00:33:51.710]
you can share your findings with your team members
[00:33:55.240]
by connecting to essential server.
[00:33:59.610]
You can see which server you’re connected to
[00:34:01.100]
in the top right of your Oasis Montaj window.
[00:34:06.770]
And then you can use the data services to upload to central.
[00:34:13.160]
We have a wealth of information
[00:34:14.670]
available online at seequent.com,
[00:34:18.130]
where you can find out more about Seequent Solutions,
[00:34:20.750]
including case studies and blogs.
[00:34:24.670]
You can find self-learning content
[00:34:26.650]
at myseequent.com/learning.
[00:34:31.730]
You can also see what webinars and workshops are coming up
[00:34:35.230]
by going to sequent.com/community/events
[00:34:40.370]
or by contacting a member of your local Seequent team.