


Groundwater makes up 97% of all liquid freshwater on the planet. It’s essential both for people and healthy ecosystems and essential too that we figure out ways to measure, monitor and manage its quantity and quality.
How do we get the information we need about these systems? One way is by drilling wells, but that only gives us information at the location of the wells themselves. We don’t know what’s happening between them or below them.
So I have spent a lot of time thinking about how to use geophysical imaging to probe our groundwater systems, and for a number of years I’ve been using AEM – the Airborne Electromagnetic Method. What we’re really mapping out is the electrical resistivity of the subsurface. What we want to do with that model is recover the information about what’s truly down there and map out the spatial variations in the geological materials that are holding our groundwater.
We can also use the AEM to look at water quality issues, by mapping out salinity, because the electrical resistivity we’re measuring is sensitive to that.
Mapping the threat of saltwater intrusion
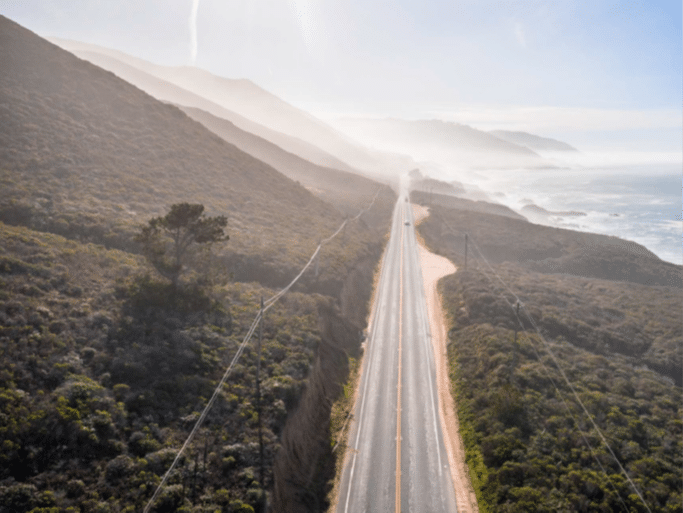
The study I’m going to describe is where we were looking at saltwater intrusion along the Monterey Coast. This is an area of California where extensive agriculture is heavily dependent on the pumping of groundwater, but when you’re doing that right next to the Pacific Ocean, it draws seawater into the aquifers.
This is not just a problem for California. Half the world’s population lives within 60km of the coast and there is
similar saltwater intrusion all over the world as these coastal aquifers are pumped to the extent that ocean
water is drawn in.
It’s a problem for the ecosystem too. Some of the richest ecosystems on the planet are found within a kilometre of the coast, and the moment we have saltwater intrusion we are not only disturbing the human water supply, but the nutrient supply to these coastal ecosystems as well.
For the groundwater managers trying to grapple with this problem, what they need to know is where is this saltwater/freshwater interface? We use AEM to answer that question because the existing well data just doesn’t provide the spatial density really needed to understand what’s happening here.
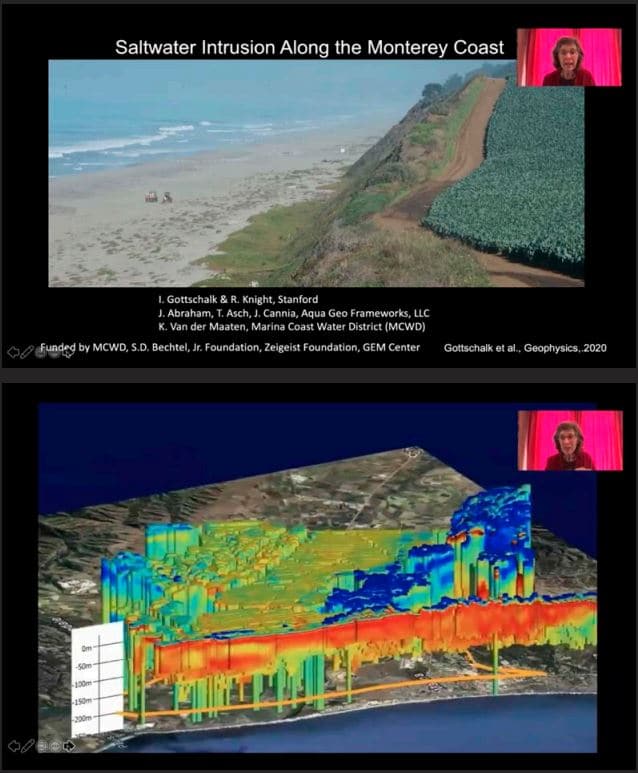
Red shows saltwater which has low resistivity, and blue indicates freshwater with higher resistivity
What we arrived at was an absolutely phenomenal data set that shows saltwater all along the coast then moving inland in definitely a more complicated situation than you could ever resolve just by drilling wells. With this density of data you can start to see what’s happening and what’s controlling the saltwater intrusion. When the water managers in the area saw this they were absolutely amazed, it’s a classic image of a saltwater intrusion wedge.
We can also use AEM to explore groundwater quantity, not by detecting it directly but by mapping out the sediment types in the sub surface – where we have sands and gravels that hold and move large volumes of water, or clays that hold water but act as impediments to the flow so you can’t pump the water out. So mapping what’s down there in terms of the composition is an essential part of managing groundwater.
Knowing where to pump to avoid subsidence
Another project was in the Central Valley of California – an agricultural area, but in terms of climate very close to a desert. Groundwater is being extensively pumped to support irrigation and we pulled together many varied data sets, all of which are part of understanding the delicate balance of groundwater quantity.
Even though there is rain in the valley itself, it’s the snowpack that accumulates over the winter that then melts in the spring and moves down into the valley that is really essential for supporting irrigation.
The amount of water stored is quite variable between the southern part of the valley and the northern part. There’s definitely more water in the north, and that means extensive pumping of groundwater in the south, which results in Red shows saltwater which has low resistivity, and blue indicates freshwater with higher resistivity. subsidence. Parts of the ground have sunk 1.3 metres over 4
years.
So we went in with our AEM to help groundwater managers understand what was controlling the quantity of groundwater, where it is in this area, and what can be done strategically about how and where to pump.
By showing where there is a lot of clay rich material we could help groundwater managers think strategically about where to pump and how much to pump, because if you are extracting a lot of groundwater and there’s a lot of clays present, it’s the compaction of these clays that causes subsidence.
It also enabled us to think strategically about opportunities to get water back into the subsurface, and we’re going to do some more work to understand how recharge from the Sierra Foothills is getting into the Central Valley.
A responsibility to manage groundwater sustainably
Since 2014 and the Sustainable Groundwater Management Act, all groundwater in California has to be sustainably managed. Groundwater management plans are due in 2020 and 2022, so there is an urgent need for water agencies to figure out what is happening below the surface in terms of groundwater quality and quantity.
The CA Department of Water Resources has committed $12million to conducting AEM surveys in the groundwater basins of California, but this is not just a California problem. Groundwater resources around the world are being challenged by climate change and population growth, and I believe those of us who have the knowledge to address these global problems should be doing so. It’s a responsibility to do what we can, and geophysics has an important role to play.
Rosemary Knight
Department of Geophysics, Stanford Univeristy