


The latest release of Oasis montaj is one of the largest in years with updates to key algorithms delivering powerful performance and optimised workflows. One of the key improvements to arrive this November is a vastly improved MAGMAP extension, renamed to 2D Filtering to encapsulate this enhanced functionality. With it you’ll experience a more intuitive filter-building workflow and some new features such as Matched Filtering and the Tilt Depth Calculation. This allows you to be more productive, save substantial time and increase your confidence with more interactive and visual workflows.
A new name to reflect increased options
We decided to rename our popular MAGMAP extension “2D Filtering” to better represent the multitude of options the extension now offers you. What we’ve developed is a more flexible, streamlined workflow that makes it significantly easier and faster to customise your filters. You can now see the effects of filters in real time, in isolation or combined while you design them, filtering performance is improved allowing you to filter larger grids.
This blog will walk through the key advances and we urge you to upgrade and try it out for yourself, we’ve already had some great feedback!
- A stunning new more flexible interface
- Increased functionality to zoom in and look at individual filters
- New Matched Filtering
- New Tilt Depth Calculation to the Tilt Derivative Tool.
A stunning new more flexible interface
The first thing you’ll notice is that there is now a ‘single point of entry’, so you start by loading the 2D Filtering menu.
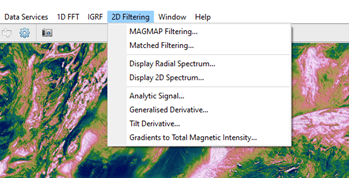
You’ll recognise options on this drop down that you’re familiar with, such as the Display Radial Spectrum and Display 2D Spectrum, these remain unchanged. You’ll also see the new Matched Filtering here.
If you start with the single point of entry to MAGMAP you’ll see that the dialogue is similar to the previous implementation, but now there is an option to design a filter with ‘Create or Edit Filter’.
Take a look at this video for a quick demonstration.
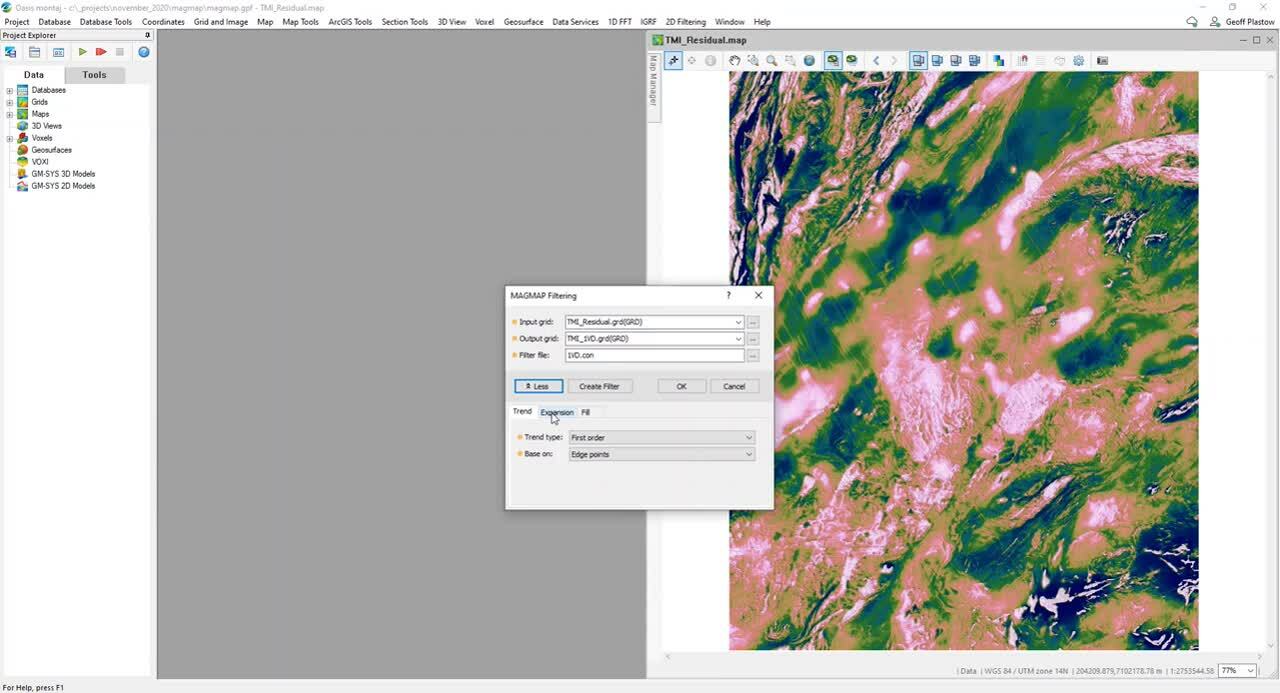
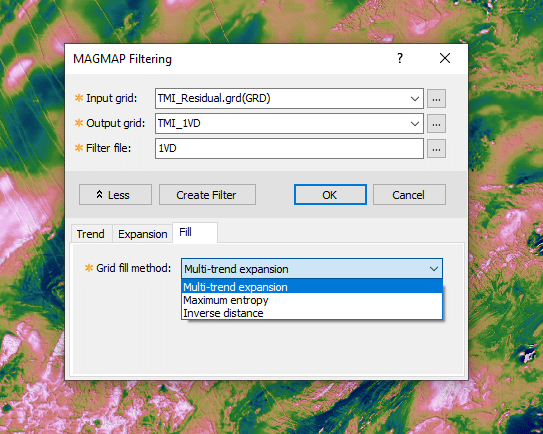
You’ll find all the features you are familiar with under the expanded dialogue. Trend hasn’t changed, Expansion hasn’t changed, but Multi-trend expansion has been added to the grid fill methods. This provides a stable interpolation method if your data contains linear features but does not have a predominant strike direction.
As you proceed through the filter design workflow, you’ll see the stunning new interface! This is due to the filter design workflow being completely rebuilt. You now have a more interactive window that is intuitive and more efficient. We have invested considerable time in this new interface to provide you with many more options for creative working to accelerate your understanding.
Take a look at this 58 second video for a quick demonstration.
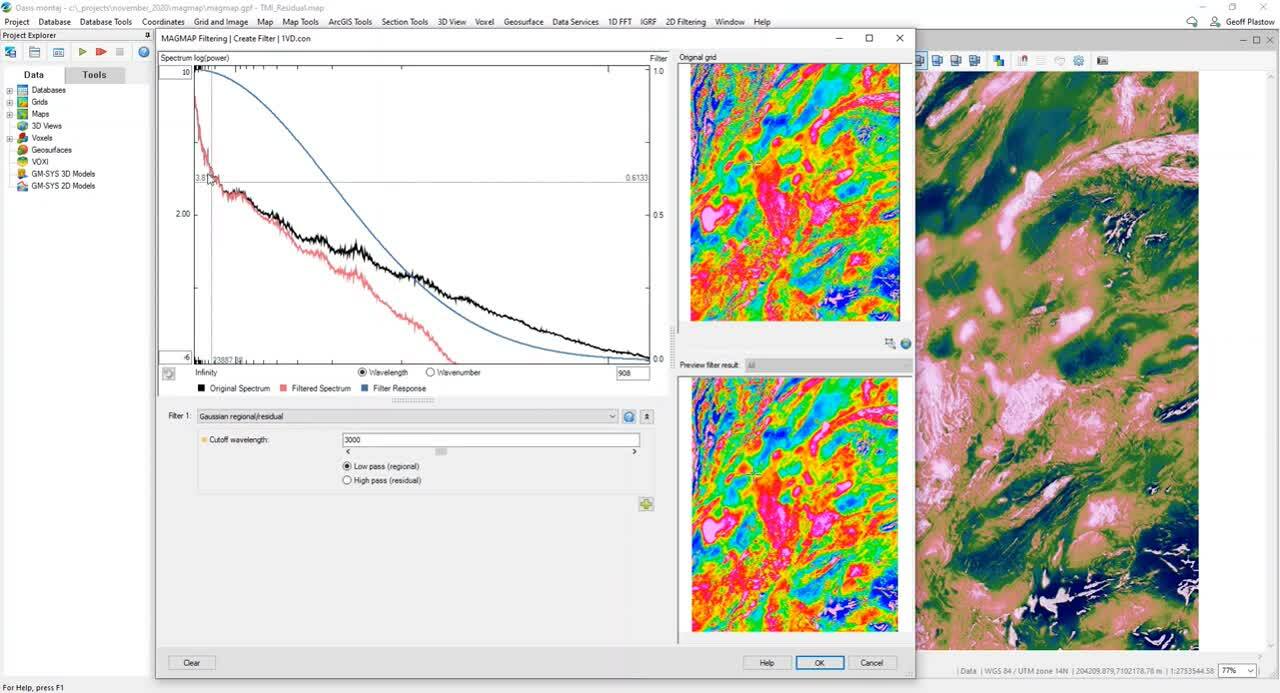
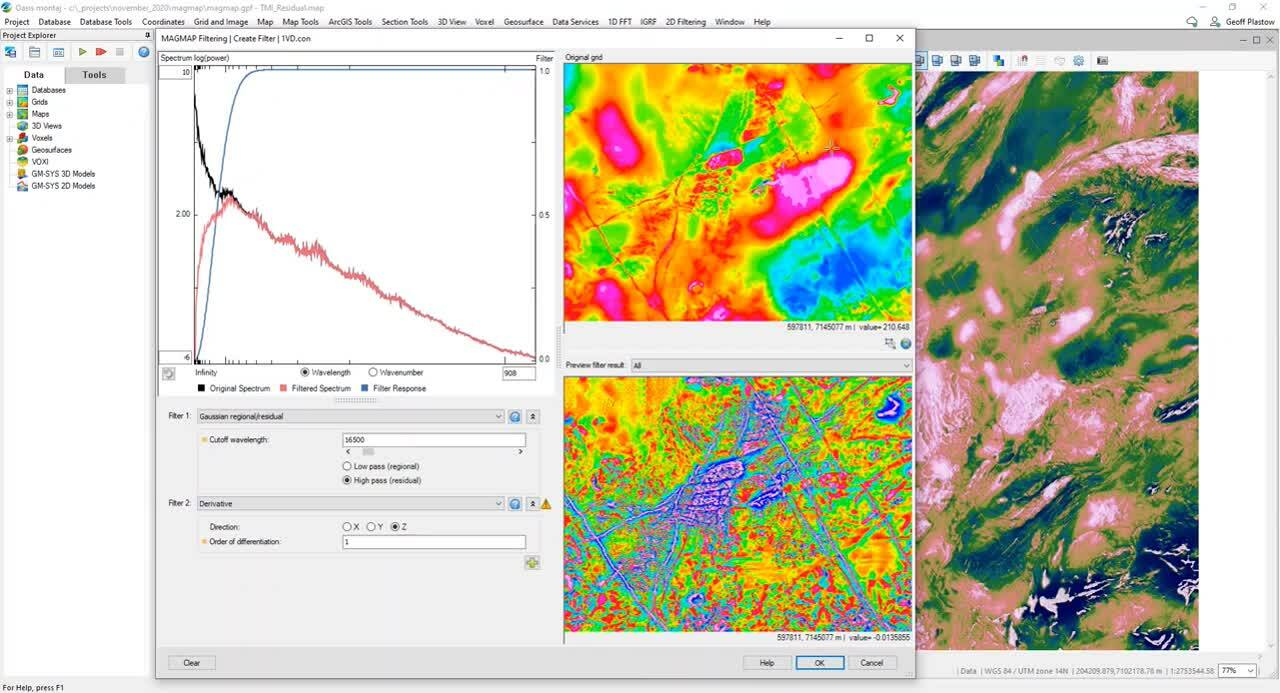
The 2D Filtering window can now be expanded and the handles allow you to resize the different panes.
In the top left the radially averaged power spectrum of the input data is displayed. The horizontal axis displays the Wavelength and can be switched to Wavenumber. The horizontal axis can also be rescaled to focus on a Wavelength or Wavenumber of interest. The original power spectrum is plotted in black, the Filter Response in blue and Filtered Spectrum in red.
The bottom left is the filter design panel is where a single or multiple filters are built.
The top right contains the input gridded data, the bottom right the output filtered grid.

When you apply filters, a preview of the result appears in the bottom right window. All of the existing filters are available in this dialogue, plus some new ones which include horizontal integration filters, which you can expand and collapse as needed. Alongside and to the right of each filter you’ll see a link to a help file, and you’ll see that help is now expanded and more detailed. We have also enhanced our online tutorials and learning pathways available through MySeequent. Check out the 2D Filtering Tutorial.
When the filter design process is started the first thing you’ll notice is that you immediately see a preview, you’ll also notice that cursor tracking and value at cursor location are all active. You can compare the input and output filtered grid values.
Take a look at this video for a quick demonstration.
Being able to have this fast interactive filtering is hugely beneficial when creating a filter. Being able to preview, look at the power spectrum and the original data speeds up understanding and allows for more creative time.
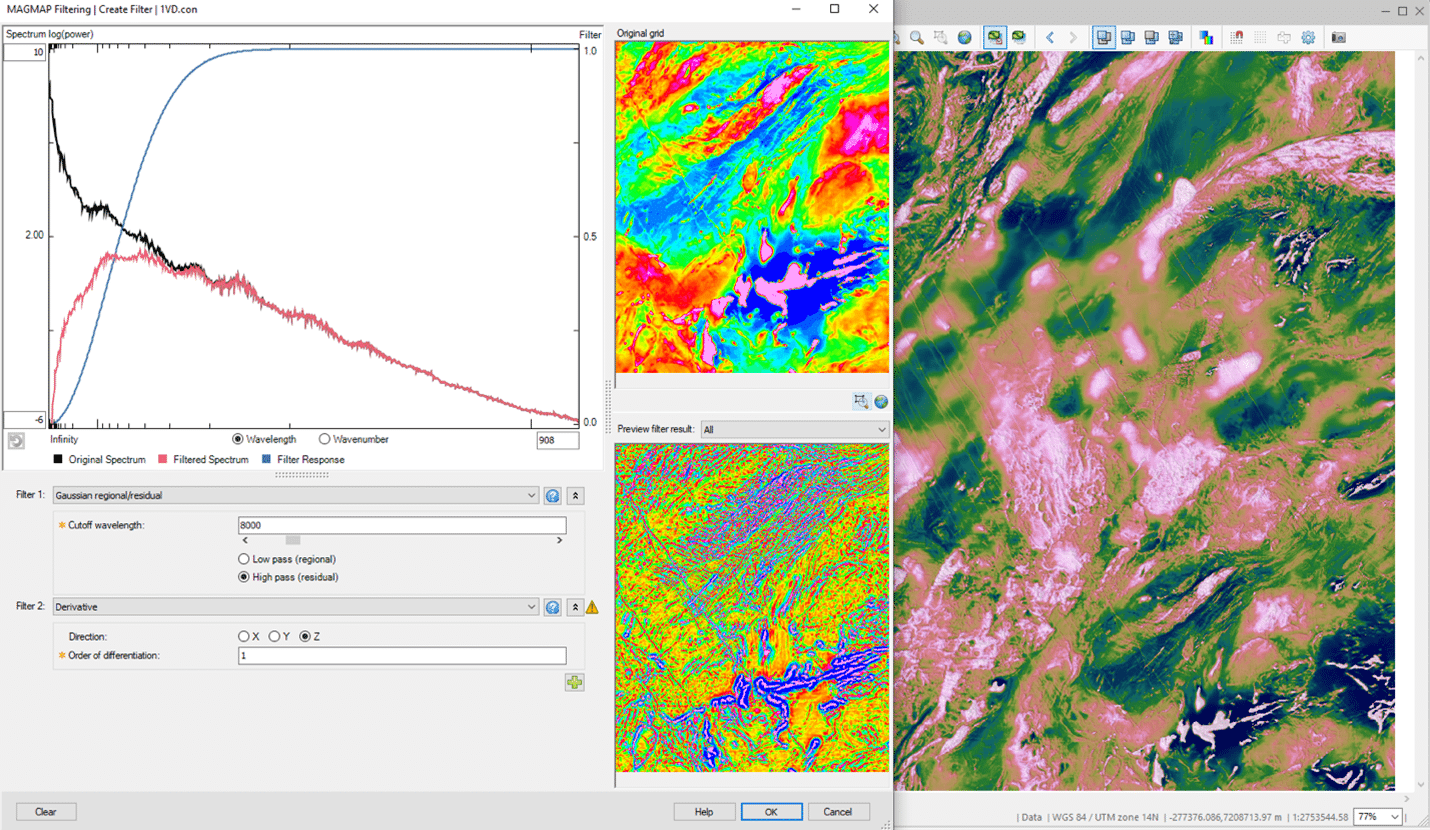
If we apply the Butterworth filter as an example, you’ll see that the update is happening in real time, the spectrum is updated and the bottom right preview is updated.
Increased functionality to zoom in and look at individual filters
You can also zoom into your data and see it in the preview window. And because filters in the frequency domain are cumulative you can enter them in any order and look at them individually. For instance, we can look at the Reduction to the pole or just the Butterworth Filter.
This allows you to easily see the effects of individual filters and takes out the guess work. It also allows for more experimental time to look at different combinations.
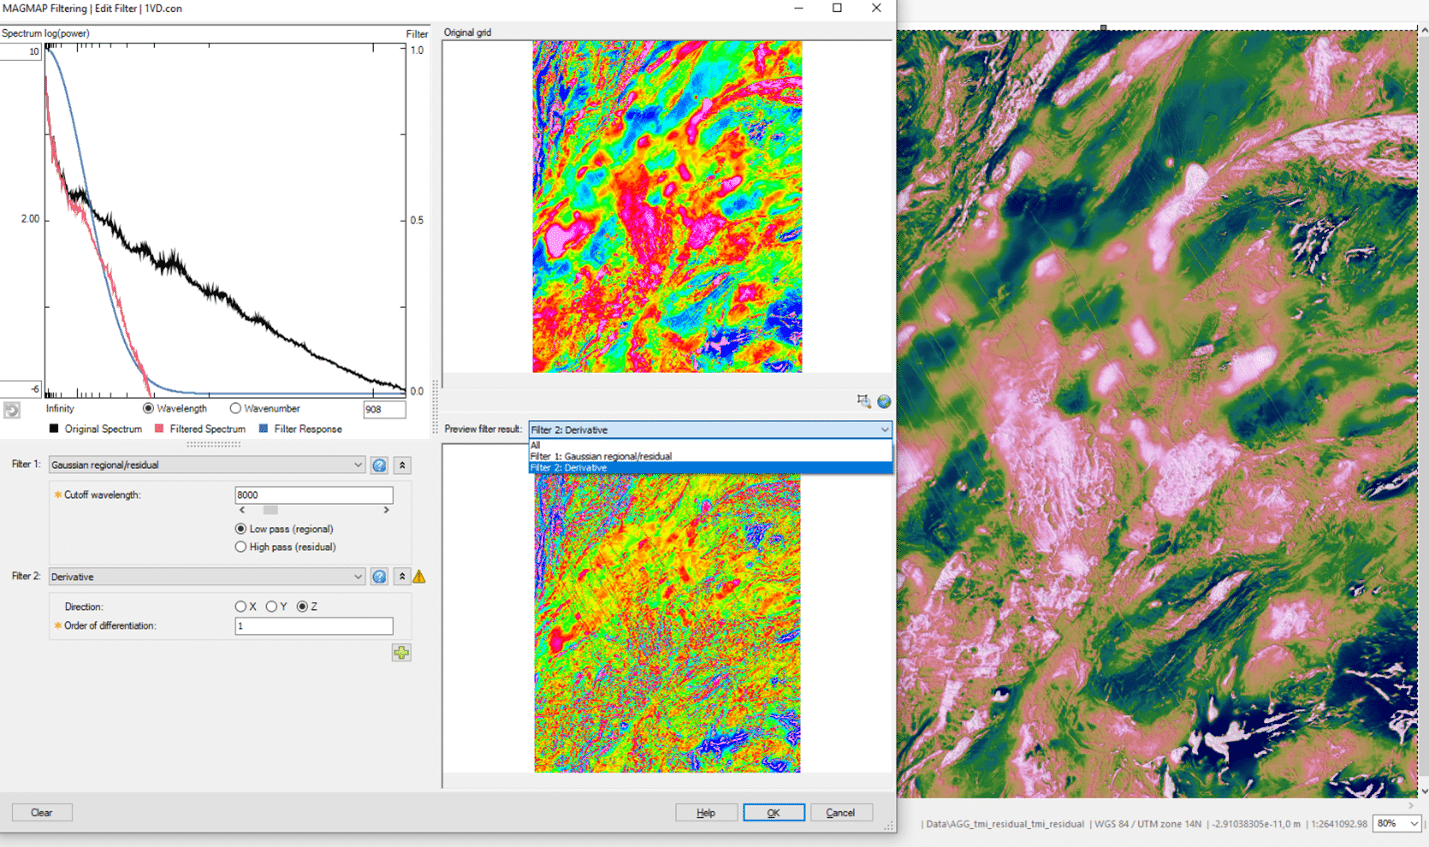
Looking at the spectrum you’ll see there’s a legend that details each profile, (original spectrum, filtered spectrum, filter response), which are colour coded on the graph. You’ll also see that as you add more filters they are plotted in different colours and are added to the legend.
If you want to zoom into specific sections of the graph – e.g. the long wavelengths, you can do that by changing your scale in the right hand box at the bottom. You can also do this on the vertical logarithmic scale. These are all tools you can use to fine tune your filter and if you want to go back, there’s a button that resets the profile to the entire extent of the data.
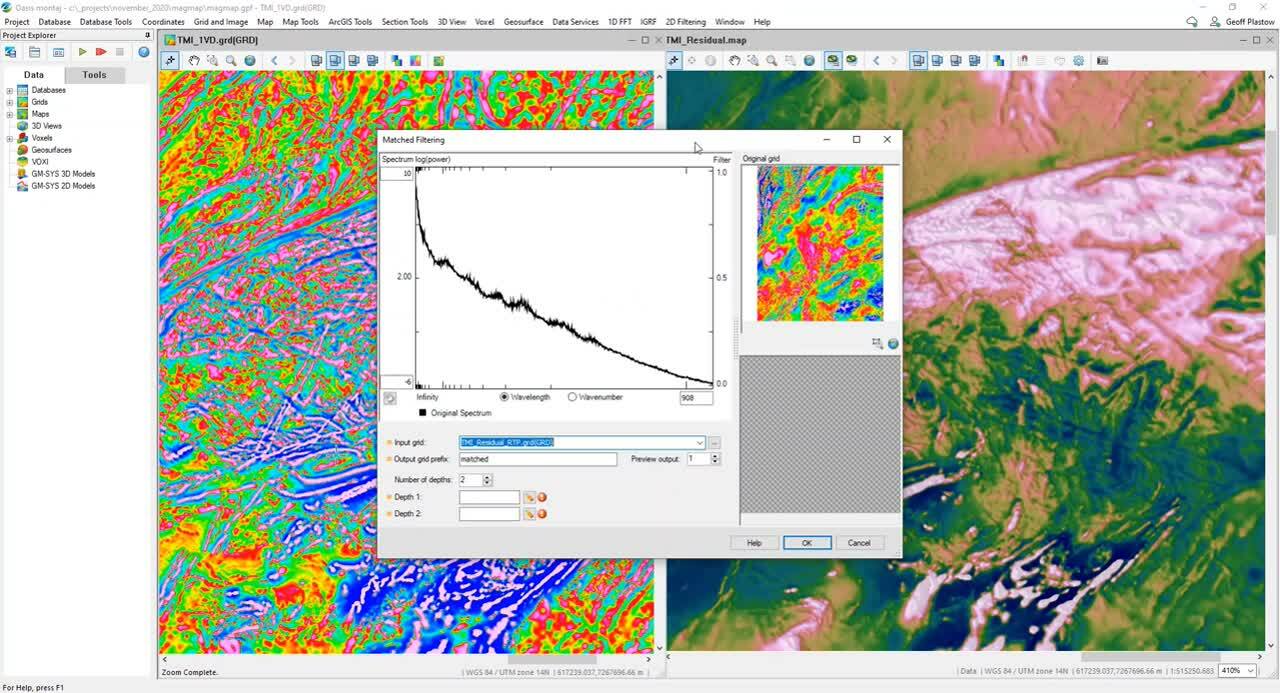
The new Matched Filtering
This brand new filter allows you to design complementary matched filters for simplified magnetic field interpretation. The aim of matched filtering is to attempt to isolate the magnetic sources from an ideal layer of a given depth. Matched filtering is a quick and easy way to extract qualitive information from your magnetic data and enhance your interpretation project.
The new Matched Filtering has a similar look and feel as the main 2D Filtering window. The power spectrum is visible front and centre along with a preview of your input data. The matched filters are tapered filters that collectively cover the entire power spectrum.
You can define up to a set of 4 complementary matched filters to separate the equivalent magnetic response of different depths.
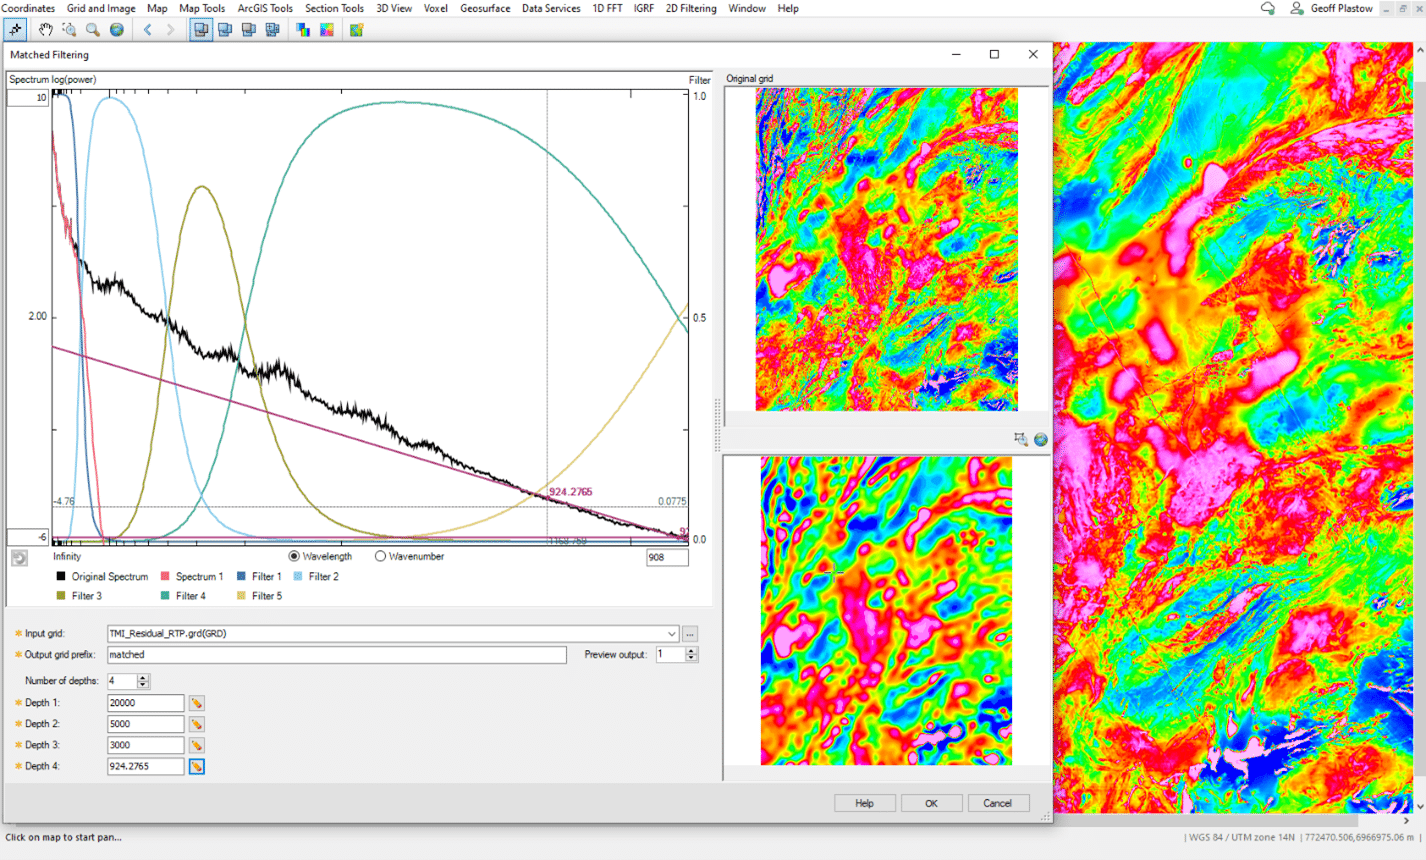
You can also preview the individual equivalent source depth layers. You can examine each one by changing the preview output and then fine tuning. You can also interactively adjust your equivalent depth by clicking the edit pencil next to a specific depth. By moving your mouse in the power spectrum window you can click an area of interest to select a new depth.
Once you are ready click ok and the tool will create all grids and number them accordingly, with calculations performed in the background.
Take a look at this video for a quick introduction to the new filter.
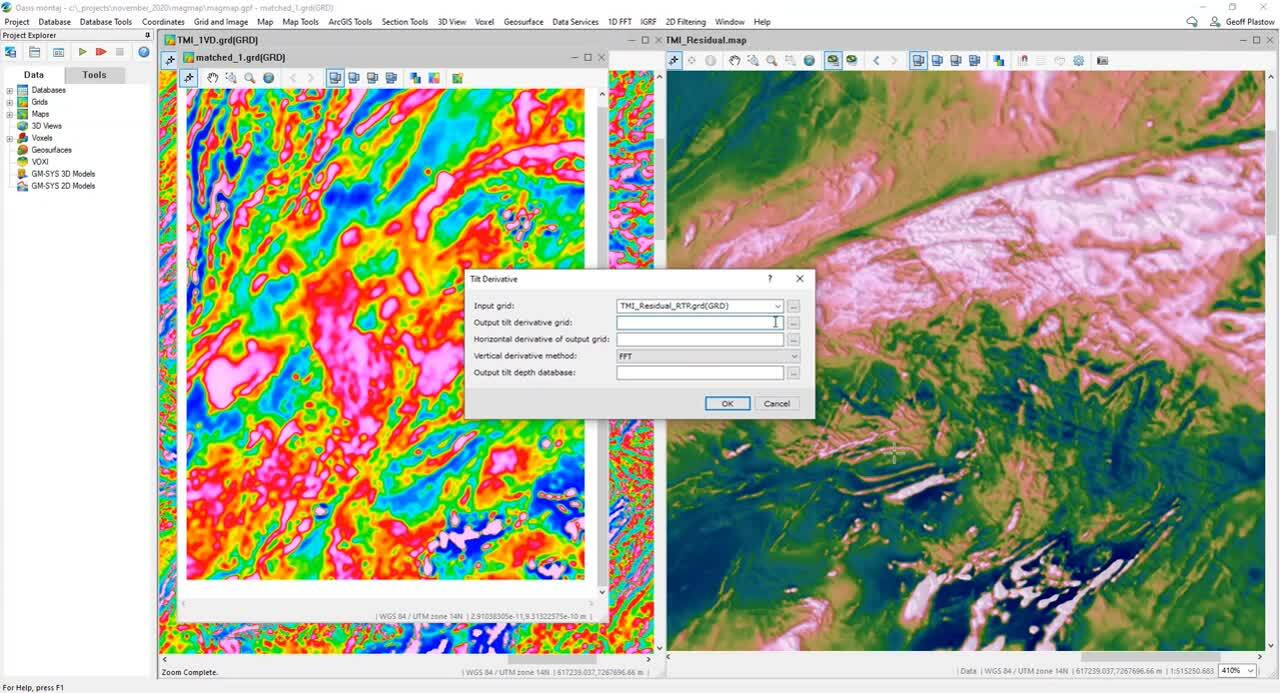
New Tilt Depth Calculation
We have added a new Tilt Depth Calculation to 2D Filtering. This is a simple and fast method to locate vertical contacts from Reduced to the Pole (RTP) magnetic data.
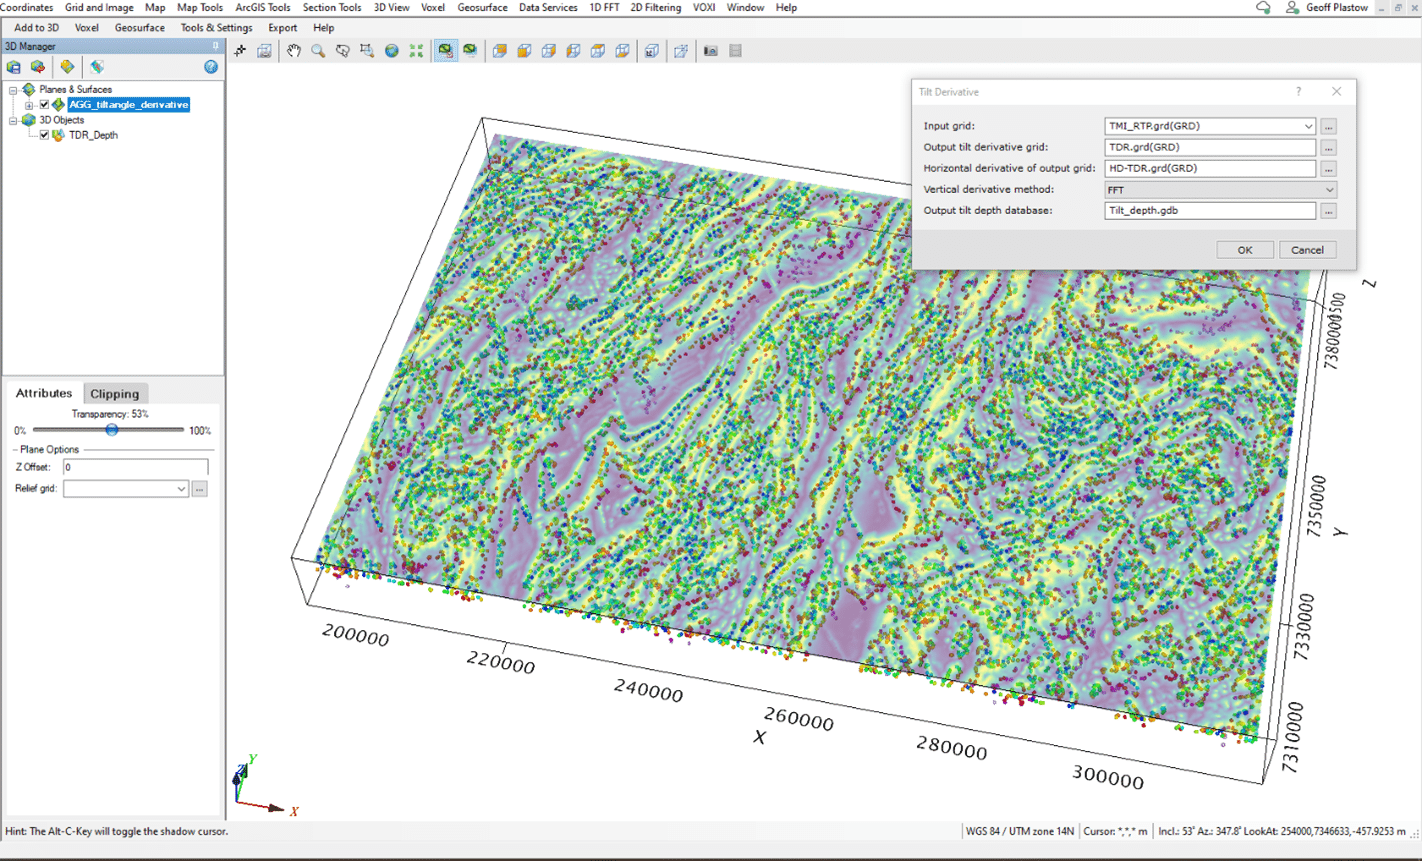
The two principle advantages of the method are its simplicity, both in its theoretical derivation and in its practical application, and that it provides both a qualitative and quantitative approach to interpretation. This technique uses first order derivatives, so it is potentially less sensitive to noise in the data compared to methods relying on higher order derivatives. Unlike Euler deconvolution there is also no need to choose window size, nor is there a problem of solution clusters to contend with.
Take a look at this video for a quick introduction to the new Tilt Depth Calculation.
We hope you enjoy this vastly improved tool! 2D Filtering represents some big changes, we’ve worked hard to improve the efficiency with how you work with the tool to provide a much more logical approach to meeting your workflow challenges.
We’ve had some great feedback so far, users are really enjoying how the tool enables them to deconstruct their filter creation in a logical way.
If you’d like to get hands on with this new feature, you can try out the tutorial. We’d love to hear your feedback!