


Introduction
SLOPE/W can be used to complete a stability analysis with the objective being to check an ultimate limit state in accordance with various limit state design approaches such as Eurocode 7, Norwegian Standard NS 3480, and British Standard 8006. The stability analysis is completed with partial factors applied to characteristic loads and soil strength parameters. The calculated Factor of Safety (FS), which is interpreted as an over-design factor, must be greater than or equal to 1.0 for the design to be deemed safe. The purpose of this example is to demonstrate how to conduct a stability analysis in accordance with one particular implementation of the limit state design philosophy: Eurocode 7 (Orr and Farrell, 1999; Bond and Harris, 2008). The principles, however, apply to all codes that adopt a limit state design philosophy. Three cases are considered to explore the effect of factoring shear strength, surcharge loads, unit weight, and reinforcement loads is explored.
Numerical Experiments
Three cases were considered in the context of the limit state design philosophy prescribed by Eurocode 7. Each case was analyzed first using characteristic values for the loads and soil strengths. The analysis was then cloned multiple times and completed with partial factors applied according to the various design approaches (DA) and combinations (C) of Eurocode 7 (Table 1). Figure 1 presents the geometry and loading conditions for Case 1, which comprises a silt-clay cut slope with a surcharge load on the crest and a shallow phreatic surface. The soil strength was defined using a Mohr-Coulomb failure law with a cohesion and friction angle of 10 kPa and 25 degrees, respectively. The surcharge was deemed permanent and equal to 10 kN/m2. An Entry and Exit slip surface search was employed.
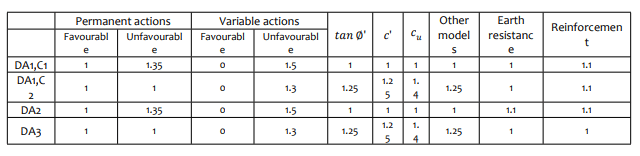
Table 1. Partial factors for Eurocode 7.
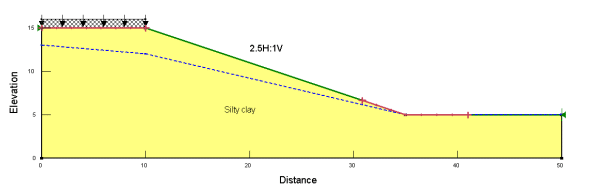
Figure 1. The geometry of the cut slope.
Figure 2 presents the geometry and loading conditions for Case 2, which comprises a 1H:2.5V slope excavated in limestone. The slope supports a permanent surcharge of 450 kPa and is reinforced with four rows of anchors. The anchor loads are set as distributed and factor of safety independent. The details of the reinforcement inputs can be reviewed in the GeoStudio file. An Entry and Exit slip surface search was employed. The exit point was set at the toe of the slope. The strength of the limestone is defined using a Generalized Hoek-Brown material model.
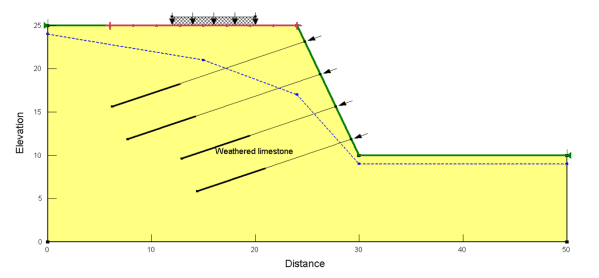
Figure 2. Geometry of the limestone slope.
Figure 3 presents the geometry and stratigraphy for Case 3, which comprises a sand embankment constructed on a 2 m desiccated layer overlying soft clay. The phreatic surface was located at the contact between the desiccated layer and the underlying soft clay. The embankment was 6 m in height with a side slope of 2H:1V. Construction of the sand fill embankment is proposed to generate excess pore-water pressure in the soft clay. This scenario was modeled using a piezometric line with a B-bar definition of 1.0 for the soft clay. The in situ piezoemetric line was drawn at the contact between the desiccated crust and soft clay. An Entry and Exit slip surface search was employed. The shear strength of the soft clay was defined using the S=f(overburden) model.
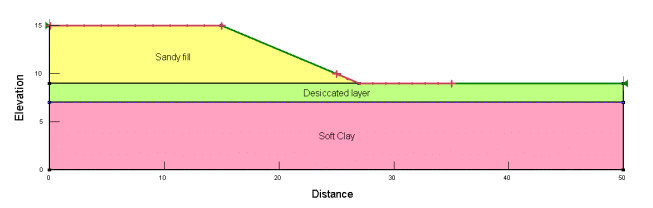
Figure 3. The geometry of the embankment on soft clay.
Results and Discussion
Case 1: Cut Slope
The calculated FS for Case 1 was 1.389 using characteristic values (i.e. no partial factors applied) and with no consideration to suction strength (Figure 4). The critical slip surface was #274.
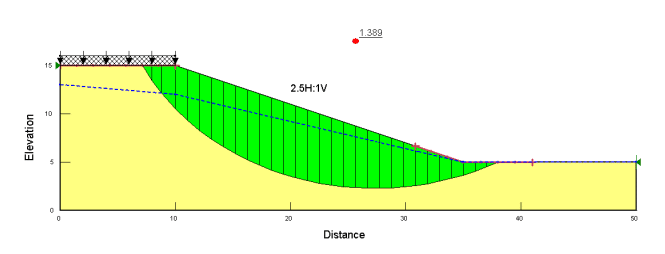
Figure 4. SLOPE/W calculated FS of the cut slope using characteristic values.
Using the default Eurocode 7 templates, the lowest over-design factor was 1.111 for DA1-C2 and DA3, (Figure 5). The critical slip surface was also #274. It is noted that DA1-C2 and DA3 are essentially the same for this example because of an absence of reinforcement (Table 1).
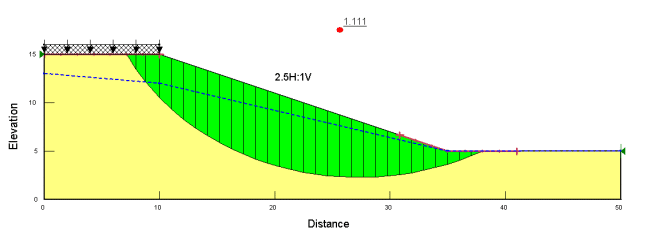
Figure 5. SLOPE/W calculated over-design factor of the cut slope using DA1-C2 and DA3.
Figure 6 compares the slice weights using characteristic values and DA1-C1. The partial factor increased the weight of slices 1 to 20 that were deemed unfavourable. Starting from Slice 21, the slice base angle changed from negative to positive and the slices were in the passive zone. The slice weights in the passive zone were deemed favourable and hence there was no increase in slice weights (i.e., partial factor =1).
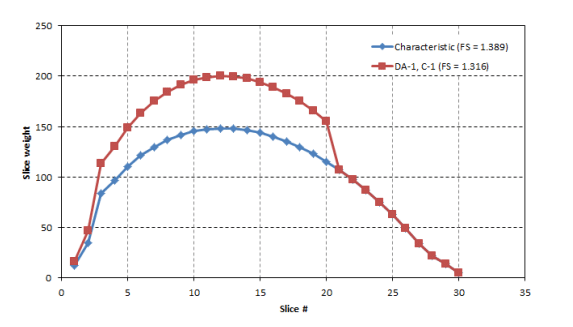
Figure 6. Effect of DA1-C1 on the slice weights for Case 1 (Slip # 274).
Partial factors are applied to slice weights, point loads, and surcharge loads in essentially the same manner. A load is deemed favourable or unfavourable based on the relative angle between the direction of action and the slice base angle. For example, the characteristic weight of Slice 3 (Figure 7) was 83.88 kN and the design slice weight using DA1-C1 was 113.24 kN (83.88 × 1.35). The width of Slice 3 was 1.1982 m. The characteristic and design surcharge loads were 11.982 kN (1.1982 × 10) and 16.176 kN (1.1982 × 10 × 1.35), respectively.
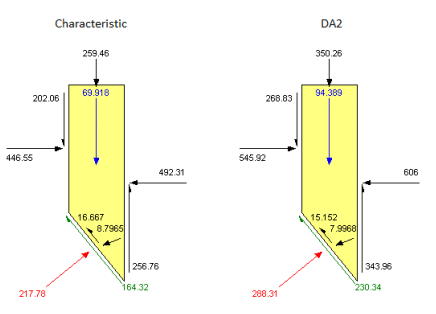
Figure 7. Slice weights and surcharge loads of Slice 3.
The input effective strength parameters, cohesion, and coefficient of friction can also be factored depending on the design approach. The difference in the parameters due to the applied partial factors of DA1-C2 is shown in Figure 8 and Figure 9. The design friction angle was 20.458 degrees (𝑡𝑎𝑛 ‒ 1[(𝑡𝑎𝑛 25°)/1.25]) and the design cohesion was 8 kPa (10/1.25 ).
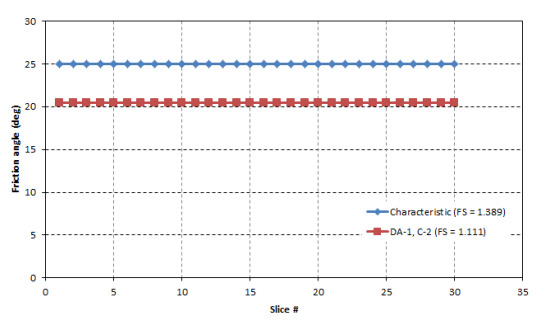
Figure 8. Partial factor applied to effective friction coefficient/angle (Slip # 274).
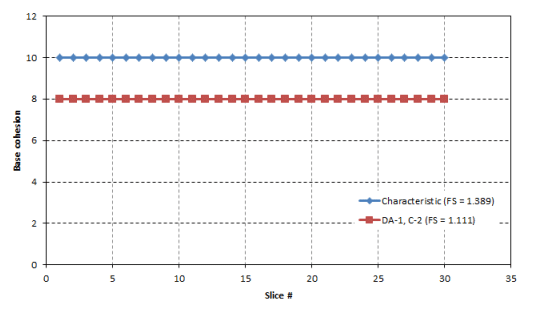
Figure 9. Partial factor applied to effective cohesion (Slip # 274).
The partial factor values of DA2 are the same as DA1-C2 with the exception of the resistance factor, which is applied to the shear strength at the slice base. The shear strength is the sum of cohesive strength, frictional strength, and suction strength at the base of each slice. The influence of the resistance factor can be seen in Figure 10.
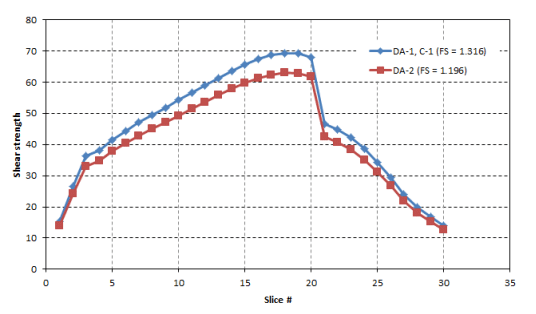
Figure 10. Resistance factor applied to shear strength (Slip # 274).
In SLOPE/W, the partial factor for 𝑡𝑎𝑛 ∅’ is also applied to 𝑡𝑎𝑛 ∅𝑏 when suction strength is considered. As shown in Figure 11, the characteristic ∅ was 10 degrees and the design value was 8.029 degrees (𝑡𝑎𝑛 ‒ 1[(𝑡𝑎𝑛 10°) 1.25] ) using DA1-C2. The factor will be applied to 𝑡𝑎𝑛 ∅’ instead of 𝑡𝑎𝑛 ∅𝑏 if suction strength is computed using the volumetric water content function (see SLOPE/W Engineering Book).
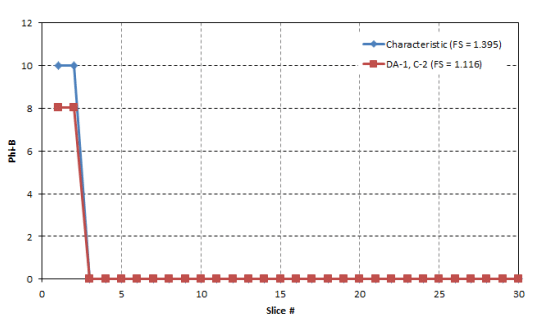
Figure 11. Resistance factor applied to shear strength (Slip # 274).
The pore water pressures at the slice bases were computed from a piezometric line and were therefore not affected by the applied partial factors.
Case 2: Limestone Slope
The calculated FS using characteristic values was 1.592 (Figure 12). The critical slip surface was #21. The reinforcement load in the upper two anchors was governed by the pullout resistance while the tensile capacity governed for the lower two anchors. Figure 13 summarizes the Object Information for the upper and lower anchors. The lowest over-design factor was achieved using DA2 as shown in Figure 14. The critical slip surface was also #21.
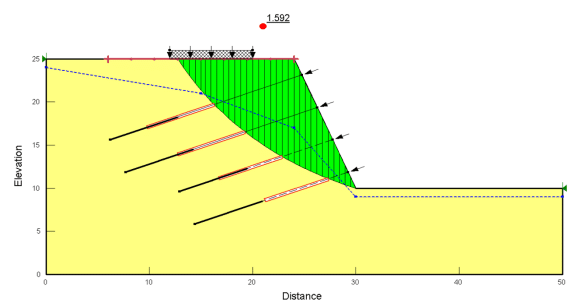
Figure 12. SLOPE/W calculated FS of the limestone slope using characteristic values.
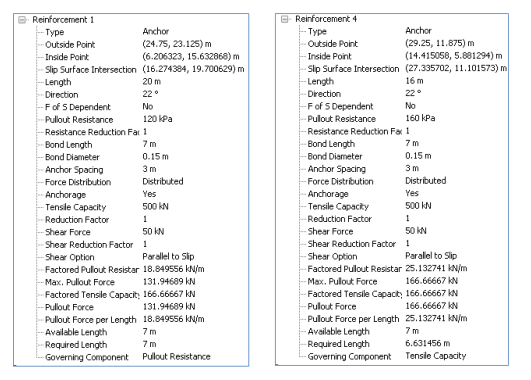
Figure 13. Anchor information using characteristic values.
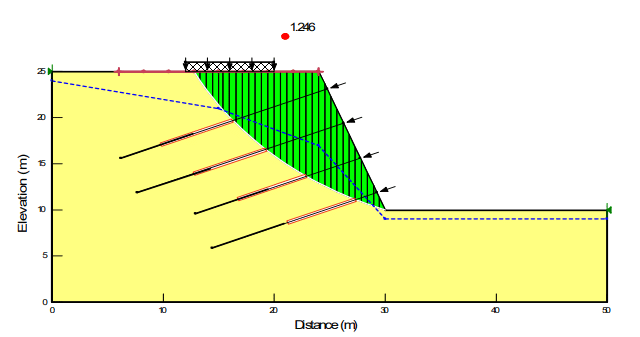
Figure 14. SLOPE/W calculated FS of the limestone slope using DA2.
Figure 15 presents a comparison of the Free Body Diagram of Slice 7 for the analysis completed with DA2 partial factors and characteristic values. The characteristic and design slice weights were 69.916kN and 94.389 kN (69.916 × 1.35), respectively. The characteristic and design surcharge loads were 259.46 kN (0.57657 × 450) and 350.26 kN (0.57657 × 450 × 1.35), respectively. The reinforcement loads acting on Slice 7 were due to Anchor 1 only. The tensile load of Anchor 1 was evenly distributed in Slices 7 through 21 for a total of 15 slices. Using the characteristic values, the magnitude of the Pullout Force was 131.947 kN (Figure 13). The characteristic tensile load acting on Slice 7 was therefore 8.7965 kN (131.947 15) and the design value was 7.9968 kN (131.947 15 1.1) as shown in Figure 15. Finally, the characteristic and design reinforcement shear forces were 16.667 kN (50 3) and 15.152 kN (50 3 1.1), respectively.
Figure 15. Slice weights, surcharge loads, and reinforcement loads of Slice 7.
A Generalized Hoek-Brown material model was used for the limestone, which is categorized as an ‘Other Material’ in the partial factors table (Table 1). The analyses completed using characteristic values and DA3 partial factors are different because the computed shear strength at the base of every slice is different by a factor of 1.25 (Figure 16).
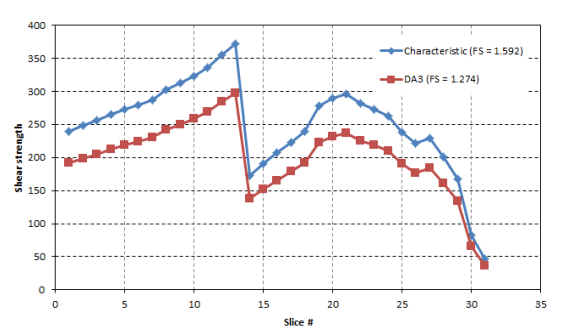
Figure 16. Partial factor applied to the Generalized Hoek-Brown model (Other Models).
Case 3: Embankment on Soft Clay
The calculated FS using characteristic values was 1.338 as shown in Figure 17. The critical slip surface was #281. Using the default Eurocode 7 templates, the lowest over-design factor of 0.989 was found using DA2 (Figure 18). The critical slip surface was #287. An “over-design” factor less than one indicates that the design does not meet the prescribed requirement.
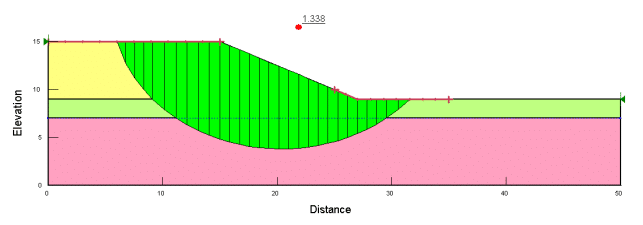
Figure 17. SLOPE/W calculated FS of the embankment using characteristic values.
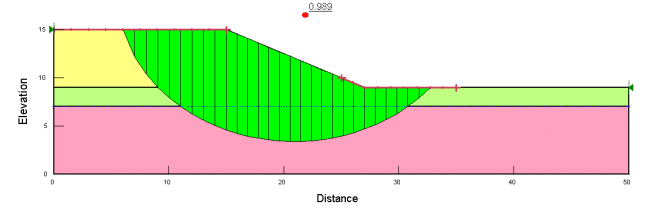
Figure 18. SLOPE/W calculated FS of the embankment using DA2.
The pore water pressures in the clay comprise the initial value characterized by the piezometric line and the excess value resulting from the additional weight of the sand fill. Consider Slice 9 as an example (Figure 19). The pore water pressure at the base of the slice was 135.06 kPa using the characteristic values, equal to the sum of 15.06 kPa (1.536 × 9.807) and 120 kPa (6 × 20 × 1).
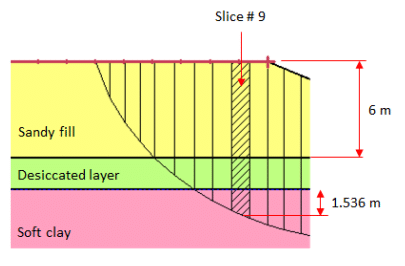
Figure 19. Geometry used for slice base PWP calculation (Slip # 281).
The pore water pressure calculated from the piezometric line is not influenced by partial factors, as noted in Example 1. However, the excess pressure calculated using B-Bar can be affected by the partial factor. Figure 20 compares the pore-water pressure for the characteristic and DA-C1 analyses. Slices 7 to 16 were located in the active zone of the sliding mass and within the soft clay. According to DA1-C1, a partial factor of 1.35 was applied to the slice weights, including the weight of the fill. Slice 9 had the same pore-water pressure of 15.06 kPa from the piezometric line, but the excess from the fill changed to 162 kPa (6 × 20 × 1.35). The total pore water pressure was therefore equal to 177.06 kPa.
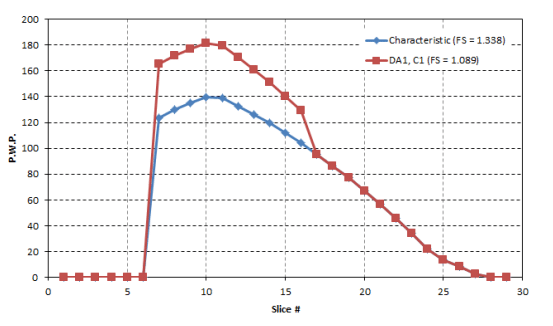
Figure 20. SLOPE/W calculated PWPs at the base of slices (Slip # 281).
The shear strength of the soft clay was defined using the S=f(overburden) model. As such, the undrained shear strength 𝐶𝑢 partial factor was applied. Figure 21 presents the shear strengths at the base of the slices in the soft clay. The difference between the two curves is a factor of 1.4 when DA1-C2is used.
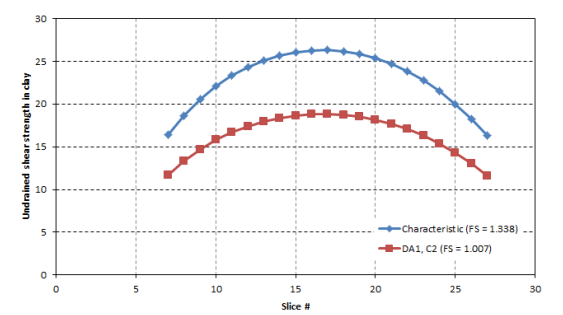
Figure 21. Partial factor applied to the S=f(overburden) model (undrained shear strength, Slip # 281).
Commentary: Partial Factors and the Location of the Critical Slip Surface
The application of partial factors can change the location of the critical surface relative to an analysis completed using characteristic values. It may be desirable to check the over-design factor of the critical slip surface located using characteristic values. Such an analysis can be facilitated by a parent-child relationship in which the slip surface search option is set to obtain the critical slip surfaces from the parent (Figure 22).
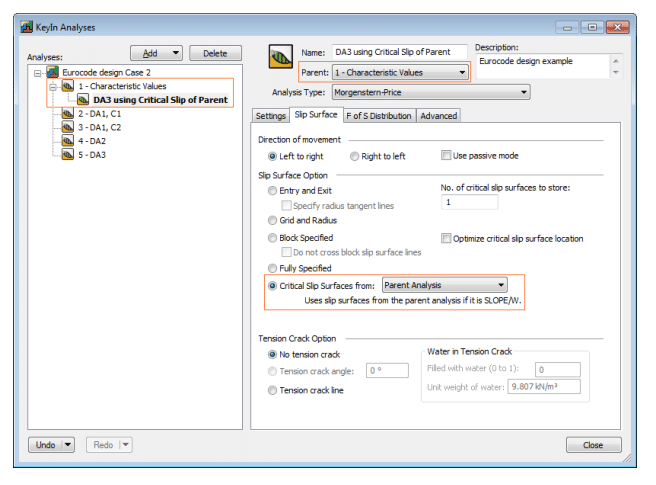
Figure 22. Analysis definition for completing a limit state design check on the critical slip surface located using characteristic values.
Summary
Three different cases were analyzed multiple times using characteristic loads and soil strength properties and subsequently derived values calculated by application of the partial factors prescribed by Eurocode 7. The ability to clone analyses in GeoStudio allows for rapid comparison between conventional stability analyses and those completed in accordance with limit state concepts. Parent-child relationships can be used to complete limit state design checks on critical slip surfaces located by an analysis completed using characteristic values.
References
Bond, A. J. and Harris, A. J., 2008. “Decoding Eurocode 7”, Taylor & Francis.
Comité Européen de Normalisation (1994). Eurocode 7: geotechnical design – part 1: general rules. European Prestandard ENV 1997–1. Comité Européen de Normalisation, Brussels, 123 pgs.
Orr, T. L.L. and Farrell, E. R., 1999. “Geotechnical Design to Eurocode 7”, Springer.
Norwegian Council for Building Standardization (1997). National Application Document (NAD) for NS-ENV 1997–1 : 1997 Eurocode 7: geotechnical design. Norwegian Council for Building Standardization, Oslo, 14 pgs.