


Is your data an asset for your organization or a liability?
We are digitizing the world around us. The amount and types of environmental and engineering data that we now collect about the earth and infrastructure assets is growing exponentially. International Data Corporation estimates that the size of the global “datasphere” will be 175 Zettabytes by the year 2025. What are you doing to ensure your data is connected as an asset, and not a liability, for your organization?
This webinar will provide you key information about:
- How global world trends are driving the need for digital transformation
- How you can mitigate risk for you and the company you work for
- How to connect your data to ensure it is an asset for you and your company.
And discover how Seequent solutions are allowing you and your team to connect, integrate, visualise, evaluate and share your geoscience data from any location to help you better understand the Earth, as we provide an overview of the capabilities that Central, Oasis montaj, Leapfrog & GeoStudio can bring to your organisation.
Overview
Speakers
Lorraine Goodwin
Director Near Surface – Seequent
Duration
22 min
See more on demand videos
VideosFind out more about Seequent's civil solution
Learn moreVideo Transcript
[00:00:00.363](gentle music)
[00:00:10.970]<v Lorraine>Hello, I’d like to welcome everyone</v>
[00:00:12.570]to today’s presentation.
[00:00:13.920]And on behalf of Seequent,
[00:00:16.060]I thank you very much for joining us for this presentation
[00:00:19.180]on Connecting the Unconnected:
[00:00:20.940]Seequent Solutions for Civil and Environmental Projects.
[00:00:24.220]My name is Lorraine Godwin,
[00:00:25.750]I’m the director of Seequent’s Near Surface Division,
[00:00:28.320]and I’ve worked with environmental
[00:00:29.550]and engineering organizations for over 20 years.
[00:00:32.860]So before we go ahead and jump into the webinar,
[00:00:35.870]I just want to briefly introduce who we are as Seequent,
[00:00:38.580]because some of you may have heard of us
[00:00:40.040]through one of our applications,
[00:00:41.700]such as Oasis montaj, or Leapfrog or GeoStudio,
[00:00:46.200]and others of you may never have had a touch point
[00:00:48.530]in the past.
[00:00:49.630]By way of introduction, we are a software company
[00:00:52.240]that builds solutions for the geoscientific community.
[00:00:55.650]And our goal is to give data and insights a voice
[00:00:58.310]to tell a story through a connected ecosystem.
[00:01:01.530]It’s our mission to enable our customers
[00:01:03.360]to make better decisions about the earth, infrastructure,
[00:01:06.270]environment and energy challenges.
[00:01:10.260]We live in a world where things like population growth,
[00:01:13.410]aging infrastructure, environmental sustainability,
[00:01:16.390]and technological developments in geoscience
[00:01:19.410]are really pushing the limits
[00:01:20.660]of what we believed was possible.
[00:01:22.610]So today we’re going to talk about how these world trends
[00:01:24.940]and the growing data sphere of geoscience data
[00:01:27.330]are challenging the way that we’re thinking
[00:01:29.480]and working and collaborating.
[00:01:31.640]And we’re going to talk about the topic of
[00:01:33.640]why connected data is an asset to the organization,
[00:01:37.210]and how Seequent solutions help connect organizations
[00:01:41.220]in the civil and environmental industries
[00:01:43.710]to connect and tie their disparate data sets together
[00:01:46.460]so that they can mitigate risk
[00:01:48.330]and empower knowledge and insight
[00:01:49.970]related to their asset or a project
[00:01:53.870]and create a deeper understanding
[00:01:55.340]of the subsurface of the earth
[00:01:57.200]or their infrastructure project.
[00:02:00.190]At Seequent we follow global megatrends
[00:02:02.260]that are impacting the civil and environmental industries.
[00:02:06.090]And groups like Global Infrastructure Hub
[00:02:08.470]are surveying leaders in over 70 countries
[00:02:10.830]on the megatrends that are causing
[00:02:12.910]both a rapid and profound disruption
[00:02:14.950]of the industry overall.
[00:02:16.950]So trends like:
[00:02:17.783]Population growth, water scarcity,
[00:02:20.680]and natural disasters and the resilience of infrastructure
[00:02:23.580]to stand up to those disasters.
[00:02:25.840]Things like:
[00:02:26.673]The aging infrastructure in different countries,
[00:02:28.840]sensor advancement, and the Internet of Things,
[00:02:32.290]as well as what we’re experiencing now
[00:02:34.120]with the unprecedented event of COVID-19 pandemic,
[00:02:38.370]these things are all interrupting and disrupting
[00:02:41.320]environmental and engineering projects
[00:02:43.260]in ways that are more profound and rapid
[00:02:46.320]than experienced in the past.
[00:02:50.880]At the same time,
[00:02:52.140]these megatrends are challenging the way we think
[00:02:54.300]and work and collaborate.
[00:02:55.800]We’re also digitizing the world around us at rapid rates.
[00:02:59.160]The use of data today is transforming the way we live
[00:03:02.147]and the way we work and how we even spend our free time.
[00:03:05.470]In the world of environmental engineering,
[00:03:07.660]the amount and types of data that we can now collect
[00:03:09.860]about the earth and infrastructure assets
[00:03:11.900]is growing exponentially.
[00:03:15.490]We look at the number and types of sensors
[00:03:18.290]that are available now to measure data about the earth,
[00:03:21.290]both in non-intrusive and intrusive ways,
[00:03:24.140]and that’s also growing exponentially.
[00:03:26.590]If we look at what we can measure both onshore and offshore,
[00:03:31.880]the number of sensors is staggering.
[00:03:34.090]So I’m going to just show you
[00:03:35.370]a portion of what’s possible today.
[00:03:37.890]So if we first look at the types of vehicles or places
[00:03:42.690]where we can mount sensors, we have things like satellites,
[00:03:46.530]aircraft, helicopters, and ships.
[00:03:49.580]And now today we have drones,
[00:03:52.170]where you can mount these different types of sensors
[00:03:54.380]and fly them or sail them over the earth surface.
[00:04:00.090]The satellite technology continues to advance,
[00:04:02.480]we have advanced Global Positioning Systems,
[00:04:04.810]things like Landsat Imagery.
[00:04:06.720]And earlier this year, Elon Musk’s company SpaceX
[00:04:10.110]began launching a chain of satellites
[00:04:12.210]that are forming a massive network of 12,000 satellites
[00:04:15.590]around the world.
[00:04:18.180]To these things we can mount photo cameras
[00:04:21.610]and video cameras.
[00:04:23.430]And these give us high definition photo geological mapping
[00:04:26.880]and digital surface models.
[00:04:28.960]Data sensors that measure infrared or shortwave infrared
[00:04:34.190]and gamma ray spectrometry or bathymetry
[00:04:36.980]can give us information about the soil and rock types
[00:04:39.650]or alterations zones,
[00:04:41.170]or even things like thermal radiation differences
[00:04:44.310]and vegetation stress.
[00:04:46.280]And LiDAR and bathymetry can measure,
[00:04:48.390]again, high definition digital elevation models
[00:04:51.750]and structure and alteration.
[00:04:54.100]And then we have geophysical methods
[00:04:55.660]that can measure lithology,
[00:04:57.200]alteration zones, and stratigraphy.
[00:04:59.610]And these are all non-intrusive methods,
[00:05:02.080]which can then be mounted into intrusive methods
[00:05:04.830]that go in down boreholes or drillholes.
[00:05:08.160]We can sample the soil and the water
[00:05:11.000]through geochemical testing.
[00:05:12.820]And these give us more information
[00:05:14.760]than physical measurements about the soil and rock types
[00:05:17.710]that we’re dealing with.
[00:05:19.580]Again, this is just a small portion of the types of data
[00:05:22.270]that we can collect today.
[00:05:26.110]Now, with the advancement of all these sensors
[00:05:28.860]and the amount of data that we can now store,
[00:05:32.760]the global data sphere is also growing.
[00:05:35.780]So groups like International Data Corporation
[00:05:38.060]have been tracking trends over the past 10 years
[00:05:40.590]and how this global data sphere is growing,
[00:05:43.290]and they’re predicting that it will grow
[00:05:45.200]to a size of 175 zettabytes by the year 2025.
[00:05:50.010]And that represents an increase of 300% over last year.
[00:05:54.250]And it’s showing no signs of slowing down.
[00:05:57.440]Some of the reasons for this is,
[00:05:58.620]our technology keeps advancing, the ability for us
[00:06:01.560]to store and collect data keeps advancing.
[00:06:05.590]So we’ve had the advancement of cloud technology introduced,
[00:06:09.130]the Internet of Things,
[00:06:10.750]artificial intelligence is on the rise,
[00:06:12.970]and now we see the Internet of Everything
[00:06:14.960]where more and more devices
[00:06:16.280]are being connected to the Internet.
[00:06:20.080]So when we think about Internet connectivity,
[00:06:22.990]it’s really changed our world.
[00:06:24.990]The Internet has enabled us
[00:06:26.810]to connect our devices and our smartphones,
[00:06:29.420]and now the Internet of Things has expanded the connectivity
[00:06:33.530]to even further types of devices.
[00:06:35.820]So for example, I can now adjust my house lights and heat
[00:06:38.710]from my smartphone without being anywhere near my home.
[00:06:43.110]Further to that, the Internet of Everything
[00:06:45.460]is connecting billions of new things
[00:06:47.160]to the Internet every day.
[00:06:48.890]And these connections are changing our world rapidly.
[00:06:52.110]And the real power starts coming from
[00:06:54.770]connecting these different data sets together.
[00:06:57.280]So you start gaining knowledge and insight
[00:06:59.370]when we bring these data types together.
[00:07:02.950]So again, a real-world example:
[00:07:05.480]I’ve got my apple watch on,
[00:07:07.280]and that’s connected to my iPhone,
[00:07:09.210]which is gathering insights about my heart rate.
[00:07:11.800]And in the future,
[00:07:12.633]that could be linked to healthcare devices
[00:07:16.560]and predict and prevent early stage heart failures.
[00:07:20.760]So now, if we think about the applications
[00:07:22.650]of this connectivity and the data that we’re collecting
[00:07:27.060]and think about the possibilities for smart infrastructure
[00:07:30.070]or precision agriculture, the possibilities are endless.
[00:07:37.530]Geoscience data is really key.
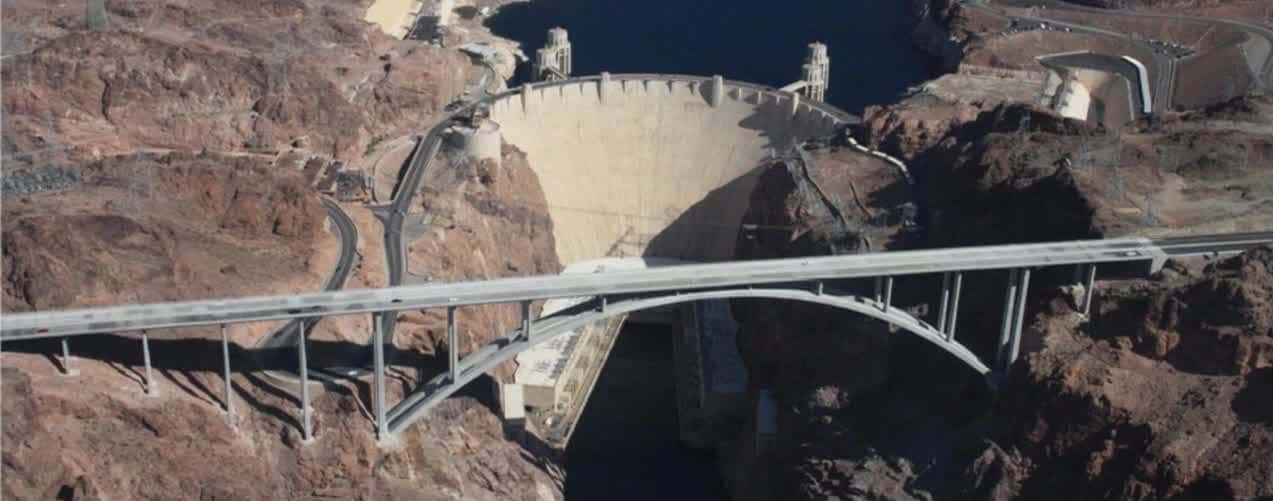
[00:07:41.730]If we look at aging infrastructure assets like dams,
[00:07:45.800]these have been in the news lately
[00:07:47.010]because of structural failures
[00:07:48.630]and the impact it’s had on communities
[00:07:52.040]and deaths and lives that have been lost.
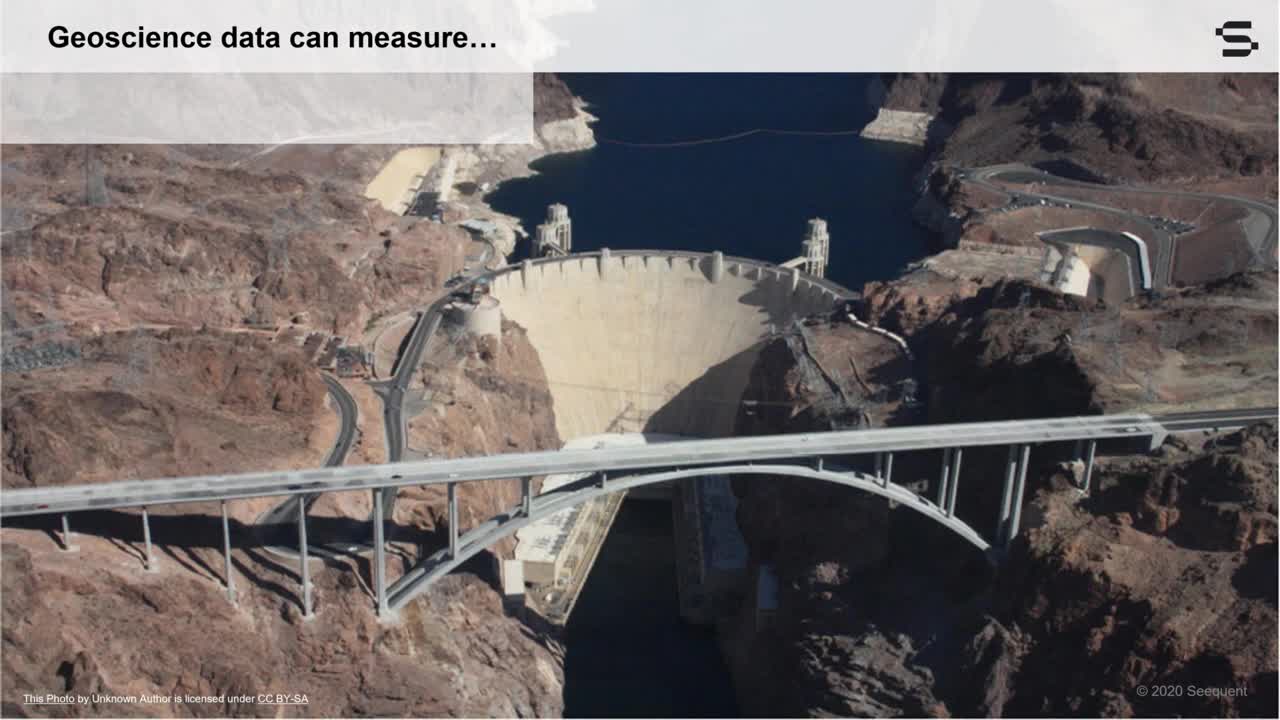
[00:07:55.150]So here, I thought I’d raise an example
[00:07:57.840]of the Hoover Dam in the U.S., which was built in the 1930s.
[00:08:01.730]Structural health monitoring systems
[00:08:03.470]are really, really important for the life of the dam.
[00:08:06.700]The sensors and various types of data,
[00:08:08.280]all help monitor the dam.
[00:08:10.040]And using geoscience, we can measure so much
[00:08:12.870]about what’s happening in and around the dam itself.
[00:08:19.082]We can measure the structural geology
[00:08:21.730]of the surrounding bedrock,
[00:08:23.770]we can measure the hydrogeology, the water flow,
[00:08:27.340]how water’s flowing in and around and through the dam,
[00:08:30.350]as well as the groundwater levels
[00:08:32.100]in the surrounding bedrock.
[00:08:34.380]And geophysics can help us measure
[00:08:36.570]the weaknesses in the structure or potential geo hazards,
[00:08:39.820]such as faults in earthquake zones.
[00:08:43.300]And we can look at the impact of temperature and weather
[00:08:46.200]and climate change,
[00:08:47.090]so meteorology impacts on the dam and how that changes.
[00:08:51.430]And geotechnical data can help us build the dam
[00:08:55.410]in the first place,
[00:08:56.270]but it can also help us look at the stability of the slope,
[00:08:59.240]the valley walls around it,
[00:09:01.290]and any stresses and strains on the dam.
[00:09:04.730]And the ultimate goal here
[00:09:05.840]is to connect all of this data together
[00:09:07.700]to determine the longevity and safety of the dam
[00:09:11.230]and detect potential behaviors that can deteriorate it.
[00:09:14.420]And we do this by bringing all the data together
[00:09:16.900]into a 3D digital model,
[00:09:18.840]or what’s known as a digital twin in the engineering world.
[00:09:22.220]So rather than waiting for an earthquake
[00:09:24.130]or infrastructure deterioration to take place,
[00:09:26.870]we can model and predict future outcomes
[00:09:29.570]and prevent disasters from occurring.
[00:09:33.450]Looking at example from the environmental world,
[00:09:36.130]a hot environmental topic being discussed around the world
[00:09:38.840]is the impact of per-
[00:09:40.400]and polyfluoroalkyl substances or PFAS.
[00:09:44.410]Now, these are found in a wide range
[00:09:46.370]of consumer and industrial products like firefighting foam
[00:09:50.190]or the liners in the disposable coffee cups
[00:09:52.980]and other products.
[00:09:54.320]So manufacturing and processing facilities,
[00:09:56.950]or places like airports and military installations,
[00:09:59.910]are some of the contributors of PFAS releases
[00:10:02.090]into our air and our soil and our water.
[00:10:04.510]And because of their widespread use
[00:10:06.140]and persistence in the environment,
[00:10:08.010]most of us have been exposed to these chemicals already.
[00:10:12.530]There’s evidence that continued exposure
[00:10:14.680]above specific levels to certain PFAS
[00:10:17.790]may lead to adverse health effects.
[00:10:19.770]So we want to clean this stuff up.
[00:10:21.650]We want to know where it is and understand it
[00:10:24.160]and help to fix the problem.
[00:10:27.060]So once again, we can tie historical data
[00:10:30.020]about existing factories and farmlands
[00:10:32.550]to understand where leachates
[00:10:35.140]might be getting into our soil and water,
[00:10:37.950]and then we can understand and model
[00:10:40.160]the transport of contaminants into our soil and groundwater
[00:10:44.210]to understand the impact of this on our farmlands,
[00:10:47.880]our agriculture, our homes and offices,
[00:10:51.160]and the water that we’re drinking.
[00:10:53.020]And it can help us model and predict this impact
[00:10:55.710]and how to remediate the problem.
[00:11:00.970]A major challenge facing the digital transformation
[00:11:03.870]of environmental engineering organizations is silo data
[00:11:07.700]and legacy systems which badly need to be modernized.
[00:11:11.260]The most significant obstacle to digital transformation
[00:11:14.120]is that data is unconnected.
[00:11:16.200]If you think about it this way,
[00:11:17.710]you can’t transform digitally or otherwise
[00:11:20.260]what you can’t manage,
[00:11:21.730]and you can’t manage what you cannot measure,
[00:11:24.020]and you definitely can’t measure what you can’t see.
[00:11:26.760]The digital transformation hinges on finding a better way
[00:11:29.530]of doing enterprise scale data and system integration.
[00:11:32.790]So practically speaking, what this means
[00:11:34.900]is that organizations must learn to connect data and systems
[00:11:38.200]in a way that releases the inherent value of that data,
[00:11:41.330]rather than stifles it.
[00:11:44.850]As we continue to digitize our world
[00:11:46.860]and introduce new sensors and data types,
[00:11:50.120]our unconnected data becomes a real liability
[00:11:52.370]to the organization.
[00:11:54.130]And that’s because we have an incomplete view of our assets.
[00:11:58.240]When you think about environmental pollution,
[00:12:00.530]it’s defined as the introduction of contaminants
[00:12:03.040]into a natural environment,
[00:12:04.600]which causes instability or disorder or harm
[00:12:07.090]to an ecosystem.
[00:12:08.660]So similarly, this sheer amount of data
[00:12:11.300]being generated today
[00:12:12.330]can contaminate the corporate environment
[00:12:14.710]and cause instability and harm to businesses.
[00:12:17.460]This phenomena has been termed infolution,
[00:12:20.800]and that’s pollution caused
[00:12:21.890]by the rapid proliferation of data.
[00:12:24.490]The financial impact of infolution
[00:12:26.600]can be seen in the amount of money corporations are spending
[00:12:29.970]to store excess data.
[00:12:32.060]So groups like Gartner are estimating
[00:12:34.120]that more than 70% of all data in a typical enterprise
[00:12:37.780]has not been accessed within the past year.
[00:12:40.430]So companies are paying to store data
[00:12:42.410]that they’re not even accessing.
[00:12:44.570]Isolated unmanageable data assets can’t be queried,
[00:12:49.430]their contents are unseen by reporting analytics
[00:12:52.680]or even AI and machine learning.
[00:12:55.460]So this is a threat to the organization.
[00:12:58.860]And these data silos are a liability
[00:13:01.210]in terms of regulatory compliance.
[00:13:03.310]If you can’t see or manage all of your data,
[00:13:05.560]you could fail to neutralize any existential threats
[00:13:08.360]to the ongoing viability of your organization.
[00:13:11.780]So unconnected data is increasingly
[00:13:14.020]a literal legal liability as well.
[00:13:17.480]Organizations who are connecting
[00:13:19.030]their disparate data together today
[00:13:20.880]are able to digitally transform faster than the competitors,
[00:13:24.180]and in doing so, they’re pulling ahead of the competition.
[00:13:27.940]Their connected data becomes an asset and not a liability.
[00:13:32.010]So another challenge organizations are faced with
[00:13:35.340]is learning how to convert these mountains of data
[00:13:37.910]into information that’s creating knowledge.
[00:13:40.230]So the data by itself isn’t useful.
[00:13:42.280]The data has to be tagged and organized
[00:13:44.320]so that you can search and combine it
[00:13:45.740]and be able to filter it
[00:13:47.190]before it can be considered information.
[00:13:49.580]And information must be processed
[00:13:51.660]into a form that helps people do something productive,
[00:13:54.140]such as making important business decisions.
[00:13:56.970]By connecting data together,
[00:13:58.230]it allows teams to work collaboratively
[00:14:01.788]from a single source of truth to create up-to-date 3D models
[00:14:05.210]or digital twins of an infrastructure asset or the earth.
[00:14:11.110]So we look at how we can connect geology,
[00:14:13.470]geotechnical, geophysics and hydrogeology data together.
[00:14:17.750]And by doing so, we can create that 3D model
[00:14:20.810]or the digital twin of the subsurface
[00:14:23.930]or our infrastructure asset,
[00:14:26.560]and we can share that amongst all the stakeholders
[00:14:29.250]on the project.
[00:14:30.083]So not just the technical people, but all the stakeholders.
[00:14:33.180]So if I think about an environmental project,
[00:14:35.360]we have environmental protection agency groups
[00:14:38.800]like the EPA in the U.S.,
[00:14:40.750]we have groups like the U.S. Army Corps
[00:14:42.490]who are managing a lot of cleanup projects,
[00:14:44.370]again, in countries like the U.S.
[00:14:46.560]and other groups like that,
[00:14:47.890]as well as the consultants and the contractors
[00:14:49.950]who are doing the physical monitoring
[00:14:52.620]and work of the project.
[00:14:56.800]So I’m now going to talk about how the Seequent ecosystem,
[00:14:59.500]which we call Evo, connects data together.
[00:15:02.407]And what we do
[00:15:03.290]is we provide powerful technical modeling software solutions
[00:15:07.210]to address the analytical needs of geologists,
[00:15:09.770]geophysicists and geotechnical engineers.
[00:15:12.330]So we have platforms like Oasis montaj,
[00:15:14.930]Leapfrog, and GeoStudio.
[00:15:17.910]And we also partner
[00:15:18.750]with industry standard software providers
[00:15:20.630]like Bentley, QPS, BFLOW, and Esri to name a few
[00:15:24.560]as well as others to support various different types
[00:15:27.730]of essential spatial data.
[00:15:30.410]Now, connecting these all together…
[00:15:33.810]These platforms allow us to do the technical geophysical,
[00:15:36.720]geological, geotechnical or environmental modeling
[00:15:40.440]of the subsurface of the earth or the asset
[00:15:44.730]in terms of infrastructure.
[00:15:46.690]And sitting on top of all of this,
[00:15:48.650]we have what we call Central,
[00:15:50.490]that’s connecting all of these platforms together
[00:15:53.150]and all of the data together.
[00:15:54.970]So Central is our cloud-hosted data management system,
[00:15:58.320]and it underpins and enables
[00:16:00.070]the collaborative analytical and decision-making process
[00:16:03.240]by providing a platform for active communication
[00:16:06.050]and data tracking.
[00:16:07.570]So Central ensures an organization’s data
[00:16:10.310]is consistently accessible no matter where stakeholders are.
[00:16:14.200]If you think about our work environment today
[00:16:17.150]during COVID-19, a lot of us are still working from home,
[00:16:20.870]we’re not even back in our offices.
[00:16:22.700]And this aspect is more important than ever.
[00:16:25.320]So Central allows data to exist in a singular place,
[00:16:28.780]rather than being scattered over multiple servers,
[00:16:32.219]external hard drives, computers,
[00:16:34.070]or even just, in some cases,
[00:16:35.950]it still sits in people’s minds, in that tacit knowledge.
[00:16:39.700]So finally, we have our Central Web Visualization tools,
[00:16:45.230]which provide the tools to collaborate
[00:16:47.110]around the common view of the project
[00:16:49.040]to reach a broader non-technical audience
[00:16:52.150]and enable better decision-making.
[00:16:55.746]This ecosystem of products
[00:16:57.100]allows for a transparent flow of information,
[00:17:00.200]so both physical and intellectual,
[00:17:02.330]from all of the stakeholders, across all of the stakeholders
[00:17:05.940]in that particular project’s life cycle.
[00:17:08.720]And it breaks down the barriers
[00:17:10.440]between perceived silos in the organization
[00:17:13.320]or on the project,
[00:17:15.000]allowing the collective team to act as a cohesive unit.
[00:17:22.830]I’m going to dig a little bit more
[00:17:23.920]into the three platforms on the technology side
[00:17:28.890]of what we enable for the modeling.
[00:17:31.370]So we have Oasis montaj, which has become the standard
[00:17:34.000]in geophysical modeling software,
[00:17:36.420]and it can be used to integrate geophysics, geology, GIS,
[00:17:42.300]and geochemistry data together all in one environment.
[00:17:46.010]These geophysical models can then be incorporated
[00:17:48.920]with drillhole and borehole data, or other types of data
[00:17:51.990]such as hydrogeological and geothermal wells
[00:17:55.290]to build a 3D geological model in Leapfrog,
[00:17:58.890]which gives you a complete picture of the subsurface
[00:18:01.170]for geotechnical analysis, hydrogeological
[00:18:04.460]or contamination modeling,
[00:18:06.168]or in geothermal resource estimation.
[00:18:11.030]And then we can tie this 3D geological model
[00:18:14.510]and integrate it together with GeoStudio products,
[00:18:17.680]which enable you to work across a broad range
[00:18:20.010]of engineering use cases,
[00:18:21.770]including reinforced walls and slopes, dams, levies,
[00:18:25.770]excavations, open pit mines, ground freezing,
[00:18:28.640]and climate change problems.
[00:18:31.590]And we have interoperability
[00:18:32.980]across these three different platforms,
[00:18:35.830]and they’re all connected, as I mentioned before,
[00:18:38.360]through our central data management system in the cloud.
[00:18:43.580]So if we just go back and revisit the Hoover Dam project,
[00:18:47.100]Seequent’s Evo system connects geoscience engineering
[00:18:53.450]and other types of data together
[00:18:54.970]to create a 3D digital twin of the assets
[00:18:58.300]and enables geoscientists engineers and other stakeholders
[00:19:01.280]to work collaboratively from a single source of truth.
[00:19:04.910]And they can work collectively as a team,
[00:19:07.650]iterably refining the model
[00:19:09.660]and allowing for the robust review
[00:19:11.630]and decision making processes
[00:19:12.970]through the life cycle of the project.
[00:19:16.640]So now I’m just going to run a short video
[00:19:20.430]that shows how it can be all brought together.
[00:19:23.310]Okay, so this model is of an aquifer
[00:19:26.470]and it’s located close to the Southern Alps
[00:19:28.430]in Canterbury, New Zealand in an agricultural setting.
[00:19:32.330]So here we see the boreholes and the geological environment.
[00:19:36.430]It’s comprised of a series of inter-
[00:19:38.340]and intraglacial outwash alluvial deposits,
[00:19:41.170]which overlay bedrock, faulted bedrock.
[00:19:45.660]So here we are integrating geophysics data
[00:19:48.670]with the borehole data,
[00:19:50.760]and we’re understanding the transition to the basement rocks
[00:19:56.680]and aquifers and faults.
[00:19:59.560]So we can see how the aquitard layers
[00:20:01.990]and how the faults are affecting the basement in the model.
[00:20:05.760]We also add in a free flow grid,
[00:20:08.090]and we can see the refinement around the wells,
[00:20:11.020]and slice through to see how the aquifers
[00:20:13.160]are visible in the grid.
[00:20:15.400]This is an example.
[00:20:16.790]This was created in our Leapfrog product,
[00:20:19.530]integrating different types of data together
[00:20:21.530]to understand this aquifer model.
[00:20:26.400]So just as I start wrapping up here, these are some
[00:20:28.930]of the other environmental engineering organizations
[00:20:31.380]who are using the Seequent Evo ecosystem
[00:20:34.170]to connect their data together today.
[00:20:36.560]And I want to just share this quote from Mike Black,
[00:20:39.820]who works on the Crossrail project in London.
[00:20:44.050]He said, “We want to spend less time processing the data,
[00:20:46.990]more time understanding the data.”
[00:20:49.140]And he felt it was really a step change
[00:20:51.260]to what he has seen previously.
[00:20:56.380]So just in summary, what we’ve talked about today
[00:20:59.680]is how the global world trends
[00:21:01.250]are disrupting environmental and engineering projects
[00:21:04.450]in ways that are more rapid and profound
[00:21:06.590]than we’ve experienced in the past.
[00:21:08.820]And big data is only going to keep getting bigger.
[00:21:11.800]The global data sphere is not slowing down
[00:21:14.010]as the number and type of sensors continues to grow.
[00:21:17.020]And the liability
[00:21:18.733]that unconnected data exposes organizations to
[00:21:23.400]is a real threat to an organization.
[00:21:26.620]The organizations who are connecting their data
[00:21:28.660]together as an asset
[00:21:29.670]are pulling ahead of their competitions.
[00:21:33.470]And we also talked about
[00:21:34.680]how the Seequent ecosystem known as Evo
[00:21:37.850]connects data together to give a single source of the truth
[00:21:40.770]and allows teams to truly collaborate and gain insight
[00:21:43.600]and make confident decisions together.
[00:21:45.490]So thank you very much for joining us today.
[00:21:47.570]It’s been a pleasure being your host.