


Introduction
Halim and Wong (2005) presented a paper titled “Evaluation of Modified Cam Clay Parameters for Deep Excavation Analysis” in a publication called Underground Singapore 2005. This paper presents six case histories where deflections of the shoring walls were measured during construction. Each of the cases was re-analyzed with the software SAGE CRISP. Their prime interest was to determine if the Cam Clay constitutive model could be used to numerically model the behavior of the excavation shoring walls.
The SAGE-CRISP computed deflections and field measurements presented in the paper are a useful source of information which can be used to verifying the performance and capability of GeoStudio for cases like this. Each one of the six case histories is briefly described here together with comparative graphs of the wall deflections. Included as well are comments pertinent to the GeoStudio modeling procedures and techniques.
The included GeoStudio data file “Braced deep excavation in soft ground.gsz” presents only the analysis of the Lavender MRT Station. Data files for the other five analyses are available upon request, if necessary.
Numerical Simulation
This section presents some general thoughts on the modeling techniques and procedures used in analyzing the six cases histories. The details are different for each case. They can be examined by opening each of the related GeoStudio data files and stepping though each of the stages.
Excavation forces
In a finite element analysis, the excavation process is simulated with the application of boundary stresses on the excavation. Before excavation, there are stresses on a future excavation face. Once the soil has been removed, the stress on the excavation face is zero. The changes in the stresses on the excavation face are applied as a boundary condition.
The change in stress on the excavation face is a total stress change (unless the excavation is done below water). Physically, this means that removing the material removes both the soil and the water. The implication is that we need to know the total stress distribution in the ground before the excavation construction begins.
A typical distribution of the total x- and y-stress distribution with depth at the wall location is presented in Figure 1. Over the wall length (14 m), the horizontal stress accumulates at an average rate of 12.5 kPa per metre. This value can be used as a Hydraulic Pressure boundary condition.
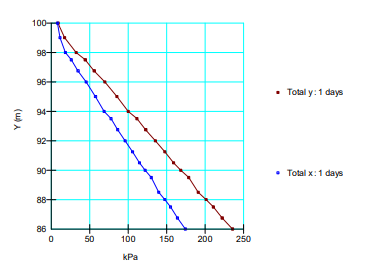
Figure 1. Total x-stress and y-stress profiles at a wall location.
In this illustrative case, the specified elevation would be 100 m and the unit weight per depth would be -12.5. The negative sign means the computed equivalent nodal forces pull on the wall, as illustrated in Figure 2. Note how the three horizontal arrows point away from the wall, meaning the forces are pulling on the wall.
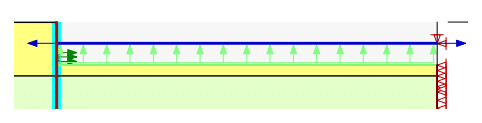
Figure 2. Excavation boundary conditions on the excavation face.
The total vertical stress in Figure 1 increases at a rate of 16.8 kPa. This means that removing 1 m of soil is equivalent to an upward applied stress of 16.8 kPa, removing 2 m of soil is equivalent to an upward applied stress of 33.6 kPa, and so forth. Separate boundary conditions are, consequently required for each excavation layer of a specific thickness. The resulting uplift pressure on the base of the excavation is illustrated in Figure 2.
The area under the x-stress profile in Figure 1 represents the total force that will be acting on the wall once the excavation is complete. Or, stated another way, the structural shoring system will have to pick up the equivalent force. In this illustrative example, the total lateral force (𝐹ℎ ) would be approximately:
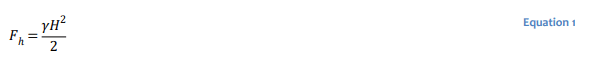
with 𝛾 equal to 12.5 and 𝐻 equal to 14 m, the total lateral force is 1,225 kN. The struts and the wall will have to pick up this force by the time all the soil is excavated.
Due the soil structure interaction, the 1,225 kN is not necessarily the exact amount of force that the shoring system will have to pick up, but it is a reasonable approximation useful for spot checking the results of the GeoStudio analysis.
As is clearly evident from this discussion, the excavation forces are directly related to the stress state that exists in the ground before the excavation process begins. This is why it is absolutely mandatory to establish the correct starting in situ stress conditions.
It is also vitally important to understand that the groundwater conditions affect the in situ horizontal total stresses. The presence of a water table significantly increases the total horizontal stress, and this is how the groundwater comes into play in the analysis. Water pressures are not dealt with separately – they are included indirectly in the total in situ stresses.
SIGMA/W will automatically compute the excavation boundary forces if a boundary condition is not specified on the excavation face.
The in situ stress profiles, such as illustrated in Figure 1, are unique to each site-specific case. This type of graph was created for each of the case histories discussed in this document. The boundary condition values used to represent the excavation forces can be examined in each of the related GeoStudio data files.
Structural wall
The flexural stiffness of the wall is included in the analysis as a beam element, which requires the specification of the moment of inertia (𝐼), the cross-sectional area per metre of wall, and the elastic Young’s modulus.
For a diaphragm wall, the moment of inertia (𝐼) about the bending axis is:
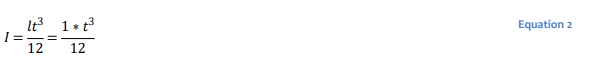
where 𝑡 is the wall thickness.
For sheet piling, 𝐼 and the area are generally available from the steel manufacture. The Young’s modulii are generally representative of values for concrete and steel or some combination of these.
The properties of the sheet piling used in two of the cases are approximations. Halim and Wong (2005) do not provide details on these values.
Struts and braces
Struts or braces are best modeled as bar elements, which have only axial forces and no resistance to bending. The connection between the wall and the strut is consequently analogous to a pin connection. Pre-loads are specified as part of the strut definition.
Constitutive models
The soft clay is modeled using the Modified Cam-Clay (MCC) constitutive relationship. The sandier and more competent layers are modeled as linear-elastic or elastic-plastic materials.
The water table for all six cases is just below the ground surface. Consequently, to correctly model the pore-water pressure changes resulting from the construction of the excavations and, in turn, the correct effective stress paths, it is necessary to do a fully coupled stress-pore-water pressure type of analysis. This means that hydraulic boundary conditions, as well as stress-strain boundary conditions, must be applied at each stage.
The analyses are based on the assumption that there will be no drainage of the groundwater conditions behind the wall during the excavation phase of the project and that the water table will be at the base of the excavation as the construction proceeds. This is accommodated in the analyses with the specification of zero pressure at the original water table behind the wall and zero water pressure along the base of the excavations.
A fully coupled analysis requires the definition of time. Assuming that there will be no drainage can be accommodated by making the time step small for each construction stage. In this case, an arbitrary value of 1-day was selected. This is a time step long enough to allow the calculations to proceed, but short enough that there is no long term pore-water pressure dissipation and consolidation. The time steps are evident in the related analysis trees.
Poisson’s Ratio and Ko
Halim and Wong (2005) used a Poisson’s ratio 0.495 for undrained behavior. The thinking behind this is that there will be no volume change when the soil behaves in an undrained manner, and the no-volume change condition can be simulated with 𝑣 = 0.5. A value of 0.5 cannot be used for numerical reasons and so a value close to 0.5 is used.
In a fully coupled effective stress/pore-water pressure type of analysis in GeoStudio, there is no need to simulate a no-volume change condition through an artificial Poisson’s ratio. A value of Poisson’s Ratio equal to 0.334 is used for all materials in the analyses presented here.
Setting 𝑣 to 0.334, even at the in situ stage, represents a Ko condition equal to 0.5. How close this is to the actual field conditions is somewhat uncertain. On average, it is likely not an unreasonable value for soft normal or slightly over-consolidated soil.
The initial Ko conditions could likely be refined somewhat, but such refinement would likely not affect the results significantly.
Wall-soil interface
To prevent water from leaking through the wall, it is necessary to use interface elements along the wall with a special interface material. The easiest way to do this is to make the interface material a total stress material. Total stress materials do not consider pore-water pressures in the calculations; that is, the seepage continuity equations are not formed at the nodes, which have only total stress materials in common. This has the effect of not allowing seepage to cross the interface. Also, the interface material in these analyses is modeled as an elastic-plastic soil with an arbitrarily- specified undrained shear strength of 100 kPa.
Judging by the favorable match obtained between the GeoStudio computed and measured wall deflections, slippage between the soil and the wall is not an important issue. A lower undrained strength could be used for the interface to investigate this further, but this has not been done for the presentation here.
Surcharge load
Note that in all of the analyses, a surcharge of 10 kPa has been applied to the ground surface 10 m beyond the wall. The reason for the surcharge is not clear. Does it represent light structures that were present long before the excavation was constructed or does it represent a surcharge that comes about during the construction? In the analyses here, it has been assumed the latter is the case.
Regardless of the actual field situation, the surcharge only has a minor effect on the magnitude of the wall deflection. It has no significant effect on the shape of the deflection profile, which is the key to structural stresses induced by the excavation process.
Dimensions
In the six cases analyzed here, all of the geometric dimensions are rounded off to the nearest metre or nearest half metre. This makes the numerical modeling easier and the mental interpretation of the results easier. Working with dimensions to the nearest 10th or 100th of a metre does not increase the accuracy of the analysis in cases like this, especially in light of the accuracy with which the soil properties can be defined. Refined geometric dimensions can unnecessarily complicate the numerical modeling.
Results and Discussion
The wall deflections profiles as computed with GeoStudio are compared with the ones presented by Halim and Wong (2005). The measured and SAGE CRISP lateral deflections presented graphically in the paper have been re-plotted for convenient comparison. A configuration diagram and the associated wall deflection graphs are presented below for each of the six case histories.
In summary, the GeoStudio computed lateral wall deflections are in remarkably good agreement with the field measured values, and the GeoStudio deflection profiles match the measured profiles as well or better than SAGE CRISP computed profiles.
Taipei Basin in Taiwan
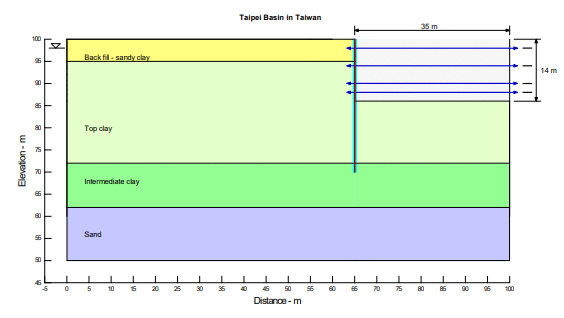
Figure 3. Problem configuration for the Taipei Basin in Taiwan.
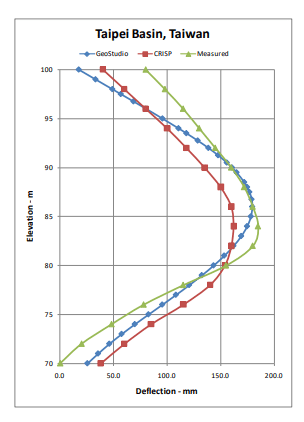
Figure 4. Comparison of deflection profiles for the Taipei Basin, Taiwan.
Farrer Park – Kandang Kerbau MRT Line
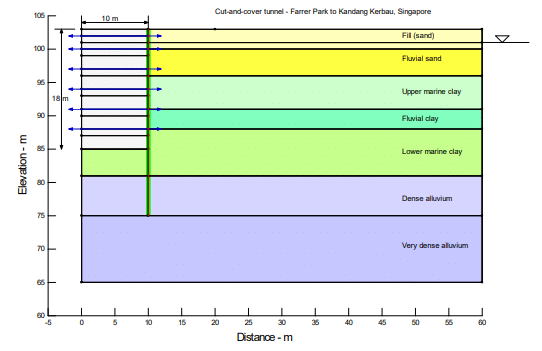
Figure 5. Problem configuration for the Kandang Kerbau MRT Line.
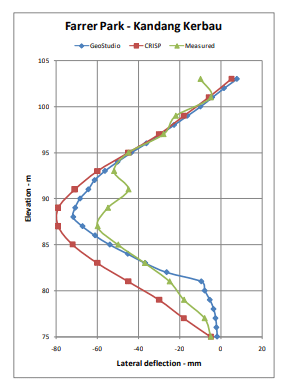
Figure 6. Comparison of deflection profiles for the Kandang Kerbau MRT Line.
Ministry of Environment (MOE) Building
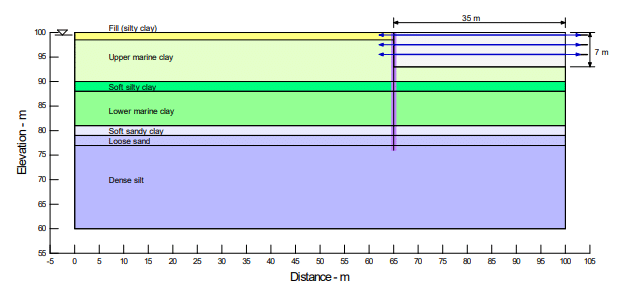
Figure 7. Problem configuration for the Ministry of Environment Building.
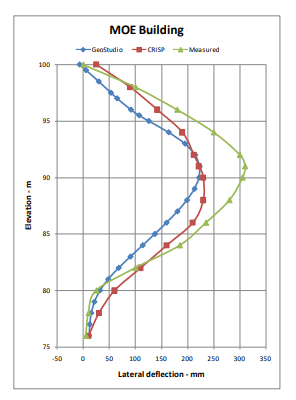
Figure 8. Comparison of deflection profiles for the Ministry of Environment Building.
Rochor Complex
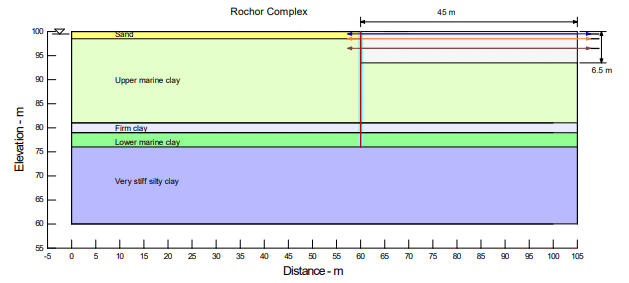
Figure 9. Problem configuration for the Rochor Complex.
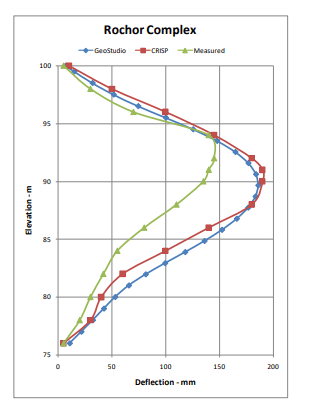
Figure 10. Comparison of deflection profiles for the Rochor Complex.
Syed Alwi Project
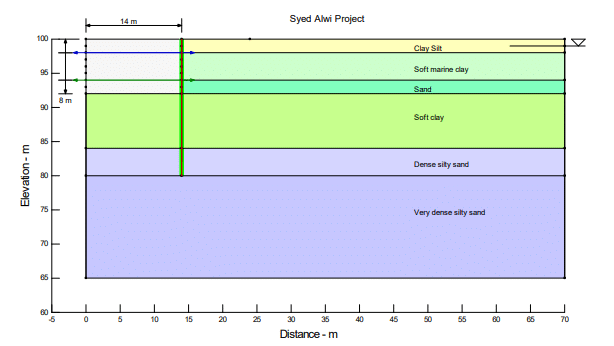
Figure 11. Problem configuration for the Syed Alwi Project.
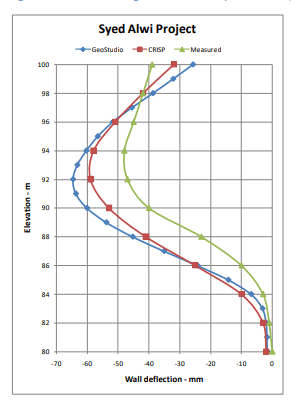
Figure 12. Comparison of deflection profiles for the Syed Alwi Project.
Lavender MRT Station
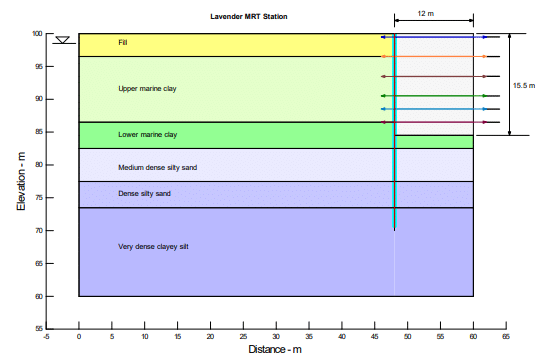
Figure 13. Problem configuration for the Lavendar MRT Station.
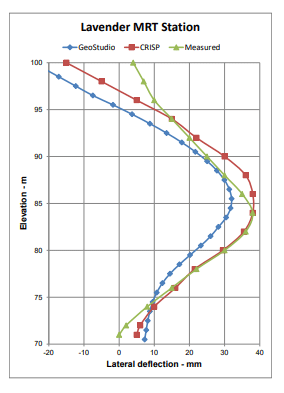
Figure 14. Comparison of deflection profiles for the Lavendar MRT Station.
Surface settlements back of the wall
The settlement behind a shored excavation wall is always a key issue. A GeoStudio analysis makes it possible to obtain a picture of the possible magnitude and trend.
Figure 15 and Figure 16 show the surface settlements for two cases. These are typical of all the six cases.
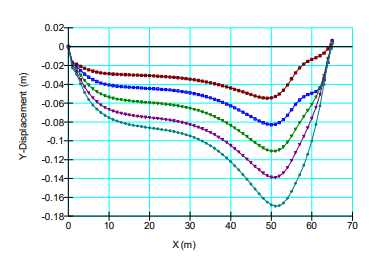
Figure 15. Surface settlement profiles at the MOE Building.
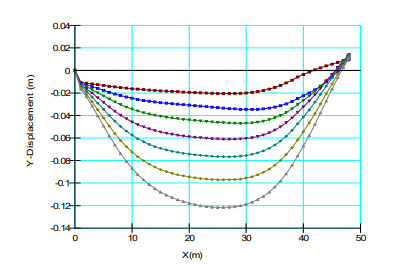
Figure 16. Surface settlement profiles at the Lavender MRT Station.
There are several features in these profiles that are of significance. The surface surcharge has an influence on the settlements and, consequently, it is necessary to have an understanding as to why and when the surcharge is applied.
Probably the most significant observation is that the maximum settlement takes place some distance behind the wall and not immediately behind the wall. This is logical and consistent with the overall behavior of the walls. Once the top strut is in place, the walls tend to bow out near the bottom of the excavation. This, in essence, causes the wall and soil wedge behind the wall to rotate about the top strut. The maximum settlements are, consequently, towards the far side of the rotating soil wedge behind the wall.
The tendency for the retained soil wedge to rotate further suggests that slippage between the soil and the wall is not a serious issue in the numerical analysis.
These comments and observations, of course, infer that there is no loss of ground from behind the wall, as would be the case for a diaphragm wall or a sheet-piling wall. In the case of a pile-and-lagging shoring system, this may not be always true – depending on the ground conditions there may be some loss of ground from behind the wall, which could significantly influence the settlement behind the wall. The numerical analysis cannot consider such loss of ground. The point here is that the computed settlements behind the wall must be judged in light of the actual events during construction.
Strut loads
Above discussions described how the lateral excavation forces are applied and how they are defined. The area under the x-stress profile is a representation of the total lateral force that will be acting on the over excavated height of the wall. As noted earlier, the struts or wall have to pick up this load. Table 1 compares the total lateral force as computed from the initial in situ horizontal total stress with the summation of the strut loads at the end of the excavation. As is evident from these values, the summation of the loads in the struts does reflect the pressure on the wall.
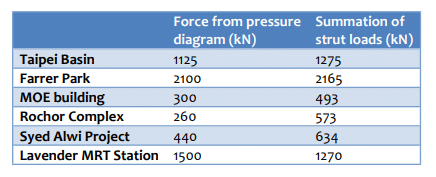
Table 1. Total lateral force from pressure diagram and summation of the strut loads at the end of the excavation.
The flexural rigidity of diaphragm wall or sheet pile wall itself will pick up some of the applied loads, so the strut loads will not necessarily be exactly equal to pressures based on the initial in situ stresses. There should, however, be a rough correlation. If there is no correlation, then it would be advisable to carefully check the input parameters and numerical model design.
Bending moments
One of the significant benefits of numerically modeling structures, such as the braced excavations, is that it is possible to investigate the bending moments and structural forces, which can be used to check that they have sufficient capacity to withstand the resulting stresses. A typical result is presented in Figure 17. Such diagrams can be plotted for all the cases.
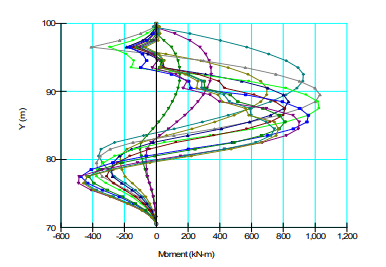
Figure 17. Bending moments in the Lavender diaphragm wall.
Summary and Conclusions
The analysis here of six Case Histories demonstrates that GeoStudio has all the features and capabilities for modeling the behavior of deep shored excavations in soft ground. Also, the favorable agreement in the computed results between GeoStudio and a completely independently developed software product, SAGE CRISP, lends credence to the fact that GeoStudio has been formulated and implemented correctly.
References
Halim, D. and Wong K.S. (2005). Evaluation of Modified Cam Clay Parameters for Deep Excavations Analysis, Underground Singapore 2005, pp. 188 – 199.