


Kathryn Gall, BSc, GradCert Geostats, MAusIMM – Senior Technical Lead, Seequent
Nick Anderson, BSc(Hons), MSc, MAusIMM – Product Manager – Geotools, Deswik
In mining geology, robust mine mapping and interpretation of ore-controlling features are important to reduce risk associated with geological uncertainty and ensure that ore value and mining operational revenue are maximized.
Improved accuracy and efficiency of the ore control process, as well as increasing orebody knowledge has downstream effects leading to a more informed resource model. In an underground mine, this can also help improve development and stope planning, as well as drill targeting.
In the not so distant past,
underground mapping has been drawn on paper, neatened up in the office, maybe scanned,
and possibly digitised in a 3D environment to create explicit 3D meshes. Sometimes it’s just left in a folder! Paper-based mine geology methods and physical
modelling techniques need to be updated for the age of the digital 3D mine. Two
tools at the forefront of this are Seequent’s Leapfrog Geo software as well as
Deswik.Mapping.
Deswik’s GeoTools portfolio is designed for
mine geologists to improve efficiency by eliminating the double handling of
data. Geologists can bring their designs, photography, and sample data into
their 3D mine design environment and capture their observations directly in 3D
space. If a site is using Deswik for
other actions such as design and survey, data transfer between disciplines
becomes seamless and automatic such that geologists always have the latest
design and as-built information at their fingertips.
Seequent’s Leapfrog Geo software is
s a workflow-based
3D geological modelling tool. Leapfrog Geo’s advanced implicit modelling engine
bypasses time-consuming wireframing and lets you build models directly from
various sources including drillholes, points and surfaces. Models update dynamically when new data is
added to a project, making it easy to keep models current. This reduces the
risk of making key decisions based on out-of-date information.
The following workflow demonstrates how you can
create a robust geological map of your underground mine using Deswik.Mapping and
use this to inform your implicit Leapfrog Geological Model. Pairing Seequent’s Leapfrog Geo and Deswik.Mapping creates an industry leading workflow for smarter mining.
Underground
Geological Mapping
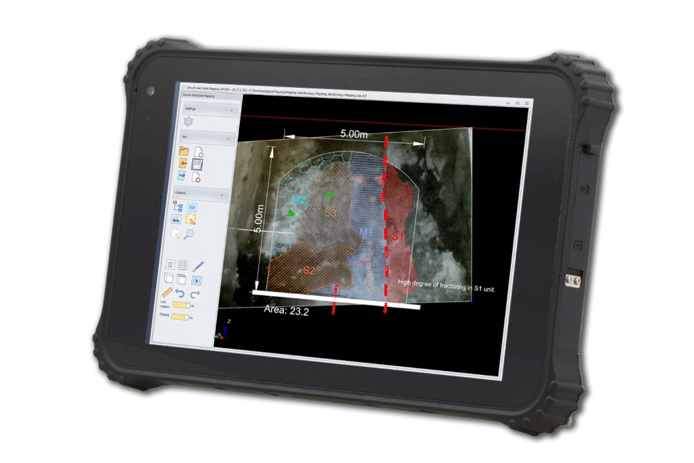
Deswik.Mapping is a Windows tablet app that
allows geologists to create geological maps and photography while offline and
underground. Users can establish their location in 3D space, using survey
markers and tunnel design, before they begin the mapping process. Photographs
can be overlaid with geological mapping, to create a rich representation of the
geology being mapped. The geological mapping work can then be imported in
Deswik.CAD and made available for other users to view and use within their 3D
mine design environment.
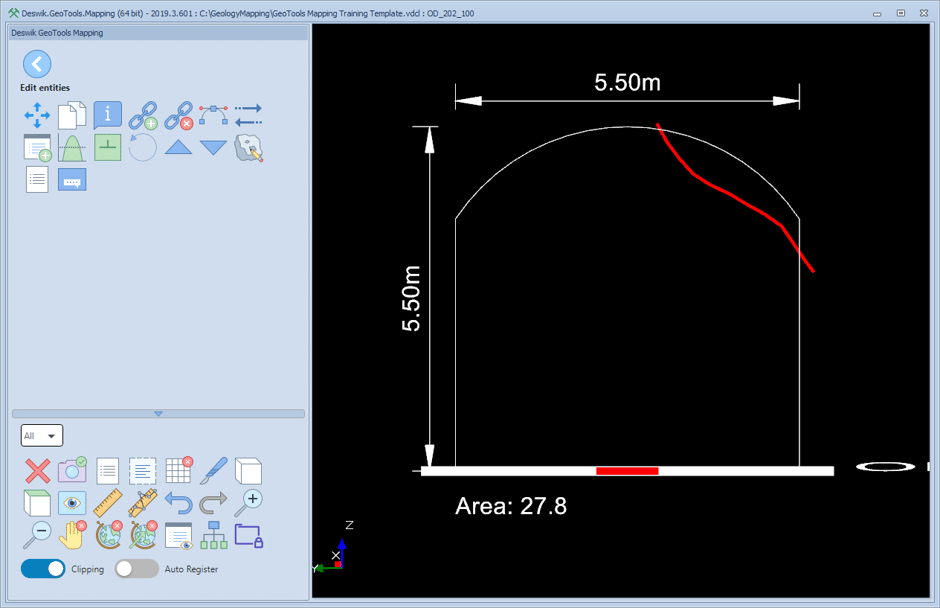
To begin this example, From Deswik.Mapping we
open the relevant level, create a new Face section to map. Deswik mapping is configurable to every site
and as such the features available to draw can be specific to each site. For this example, a vein hangingwall and
footwall feature have been configured both of which prompt users to specify
which lode the HW/FW belongs to.
Sketching
contacts
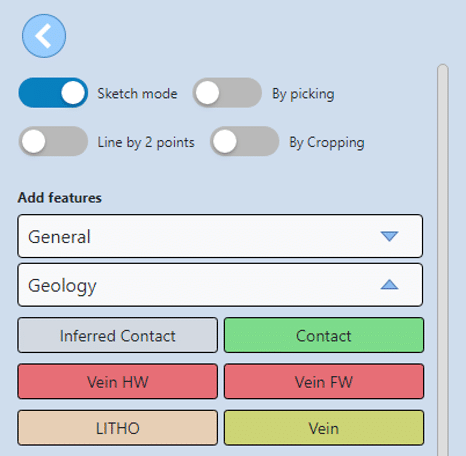
Once the face is setup, go into the Drawing Tools menu, select the Sketch toggle, then tap the Vein HW button.
Using your tablet’s stylus, draw on the screen
the hanging wall of lode
Tip: When sketching and you want to finish a line segment, lift the stylus off the screen a tiny amount, then tap at the end of the line – like writing a full stop! This stop’s sketching the current segment.
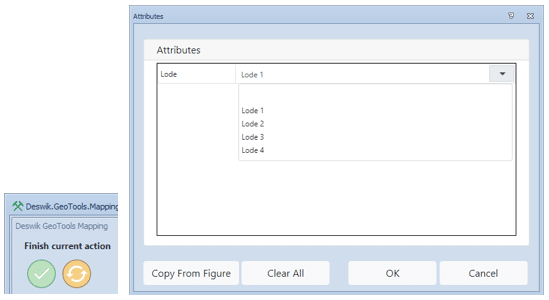
Tap the Finish button to end sketching, and when prompted, enter Lode 1 as the lode.
The Lode 1 hangingwall is now on screen, in its 3D position.
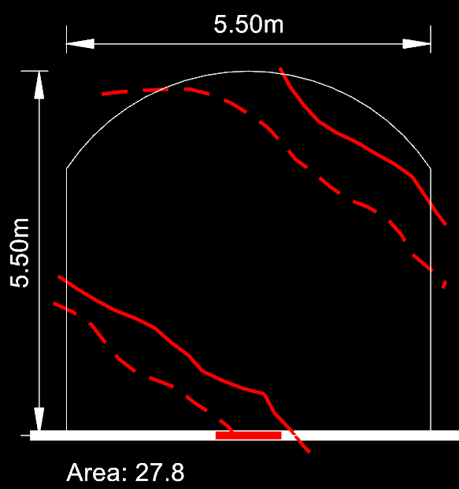
Use the same process to sketch on the footwall
contact of load 1, using the Vein FW feature, making sure to select Lode 1 when prompted.
Repeat the process to digitize other lodes –
in this case, we digitize a second lode, making sure to set the HW and FW to
Lode 2 when prompted.
Creating polygons
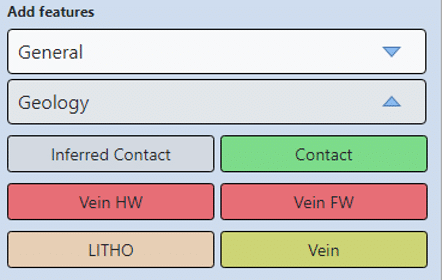
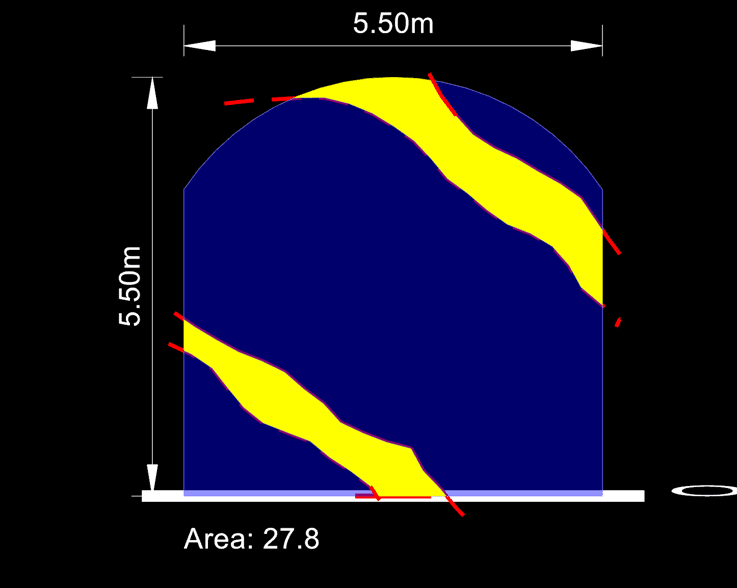
Once the veins are digitized, create polygons between the contacts to make the geology apparent in the drawing. The fastest tool for this task is called ‘picking’ – somewhat similar to the ‘flood fill’ action in Paint. In the drawing tools menu, toggle the By Picking option:

then select the Vein feature under the Geology features:
Tap the stylus inside the vein, and some hatching will appear to indicate the area selected. You can digitize multiple polygons, so go ahead and tap in the second vein too, then tap the finish button. Next, we want to define the host rock, so with the picking option still toggled, tap the Litho feature, then tap in the space above Lode 1, then between the veins, then below vein two, then tap finish. You will be prompted to select a lithology code for the host rock – select M2. The screen will redraw and you will see a very typical looking face map.
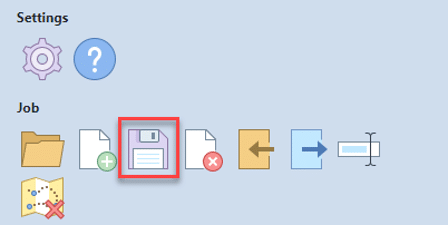
Save the current document in the mapping app from the home menu:
Exporting Data
To model the vein in Leapfrog Geo we first need
to export the vein data from Deswik.CAD.
Open Deswik.CAD, then open the mapping document where the
veins were created.
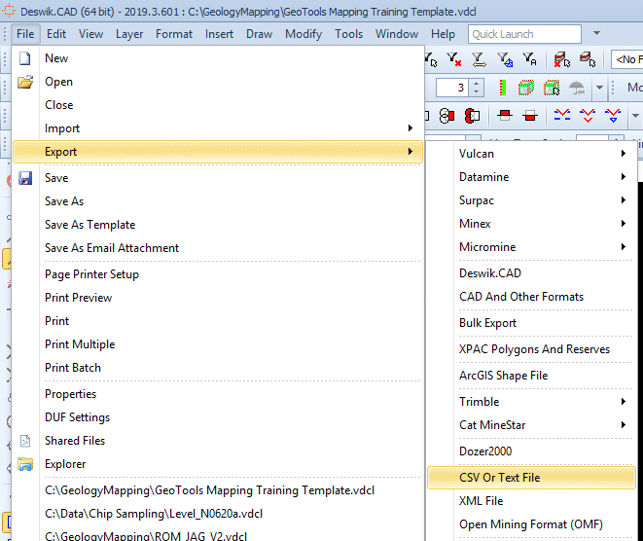
To export the vein data, menu to: File | Export
| CSV or Text file
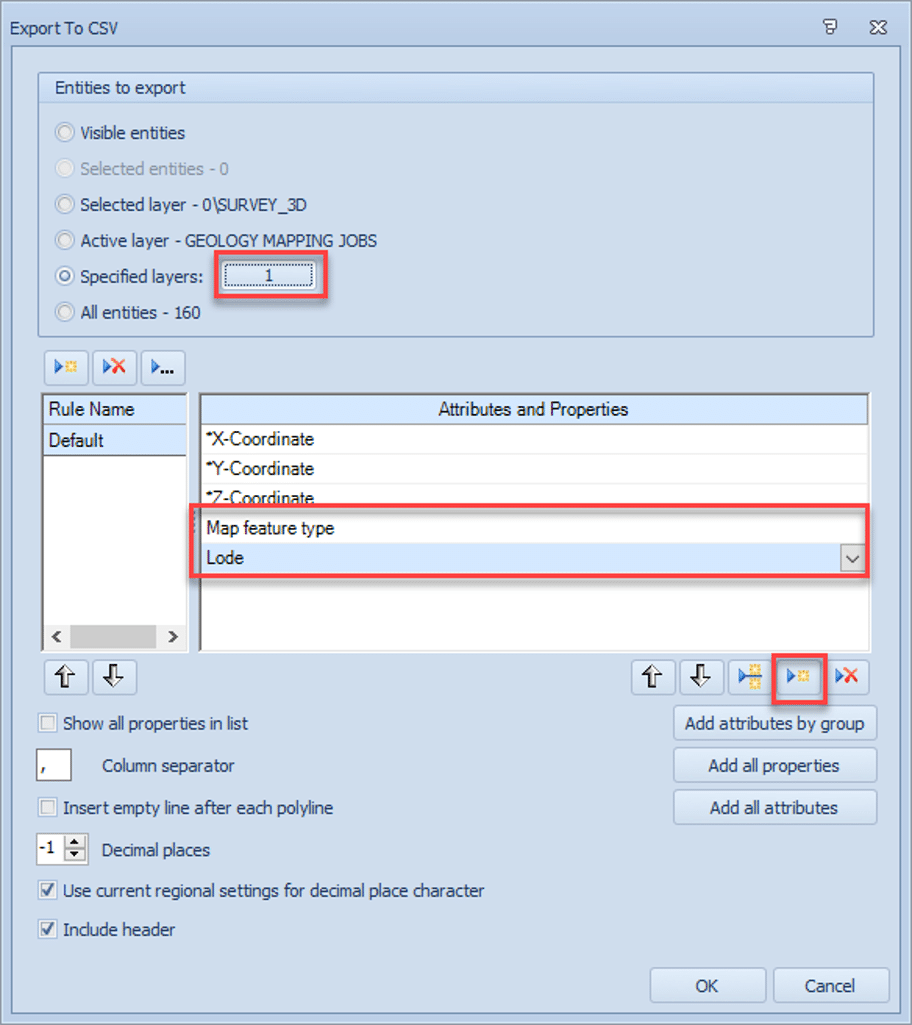
The Export to CSV dialog box appears. In the Entities to Export section, we need to specify the layer in the CAD document where the veins are. In this case, click the ‘Specified layers radio button, then click the button to the right of the radio button.
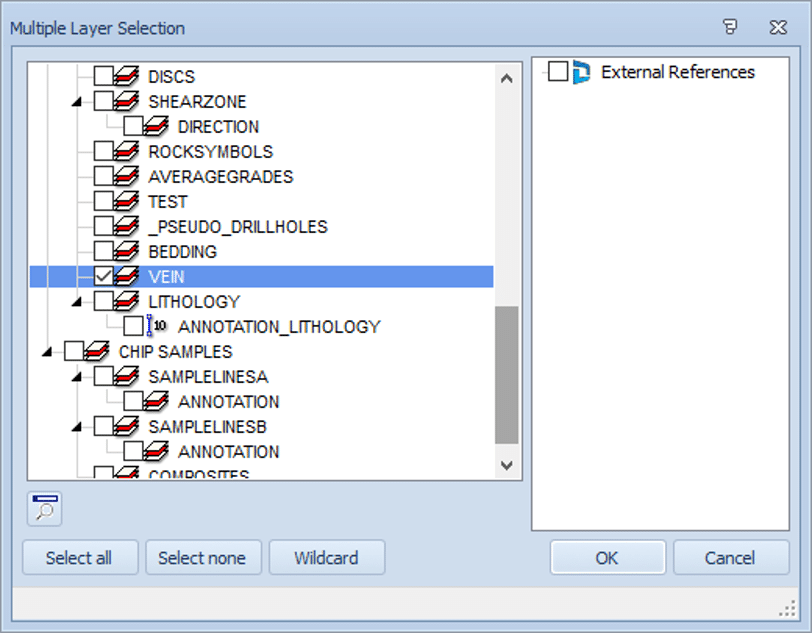
Once prompted to select a layer from the list to export, scroll down to the layer called VEIN and click OK.
Next, the attributes (data) to export with the veins must be selected. Just below the Attributes and properties table, click the ‘new’ button

which adds a new record to the table. In the table, select the new cell and choose Map Feature
Type from the
list. Add another row and select Lode from the list.
Click OK where you will be presented with a
Save As dialog, enter the name of the file destination – name the file Veins.csv
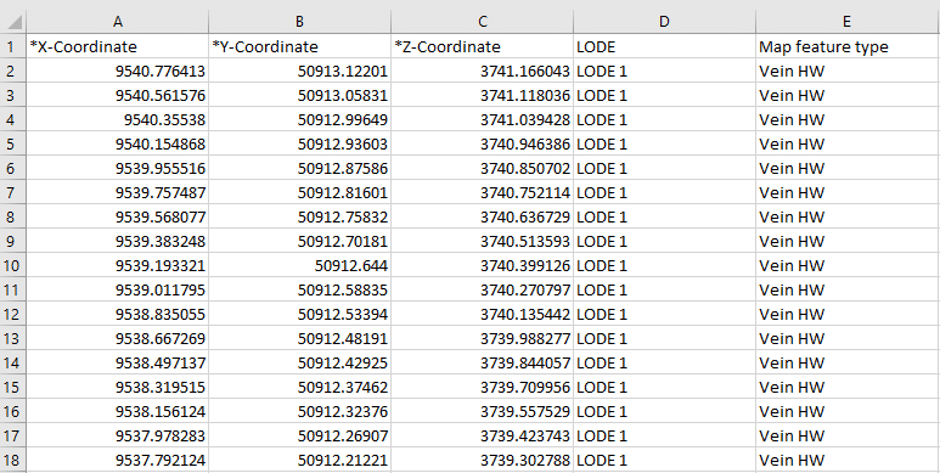
This will create a CSV file of the vein
polylines, with the associated data, which in this case is the lode name and
whether the feature is a footwall or hanging wall.
Underground
Geological Modelling
With Leapfrog Geo, you
can rapidly build complex underground geological models from drillhole data,
structural data, points, polylines and meshes in the project. Leapfrog Geo’s
powerful implicit modelling engine and unrivalled processing power can use
millions of points. Here, we will be using the geological mapping conducted
above in Deswik.Mapping to update a series of vein meshes in Leapfrog Geo.
The exported data can be
imported into Leapfrog Geo as points.
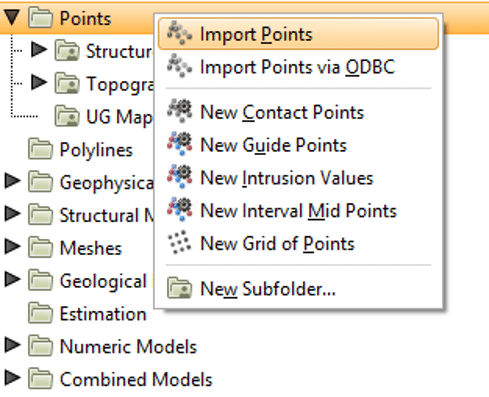
Right-Click Points >
Import Points
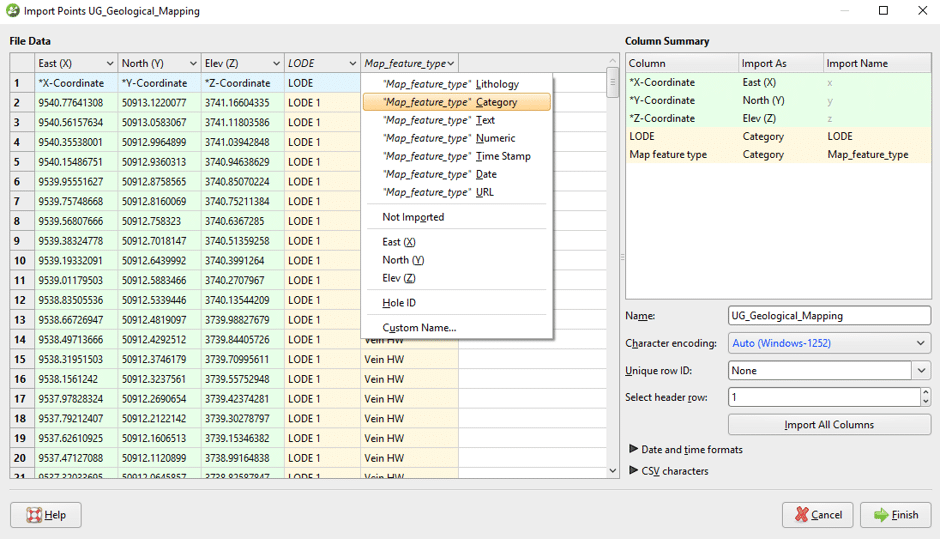
When the data is imported the Lode and Map Feature columns can be imported as categories. Using the drop-down menu, attributes can be assigned an Import As type of Category.
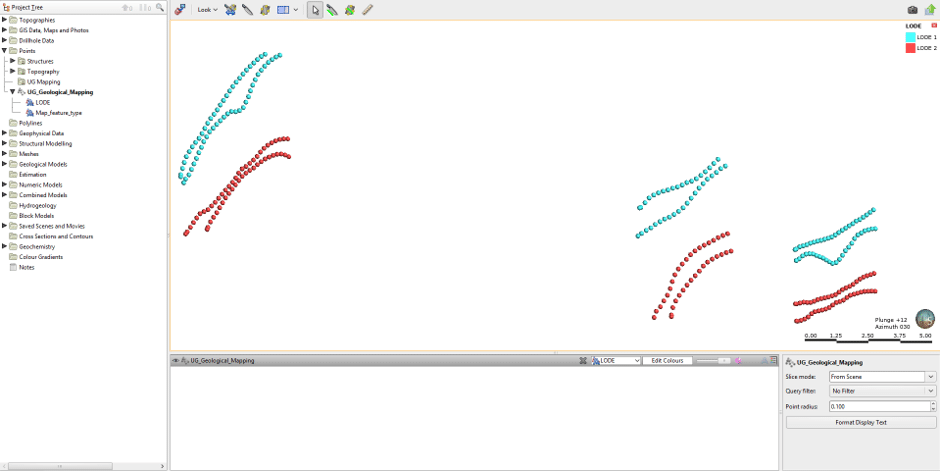
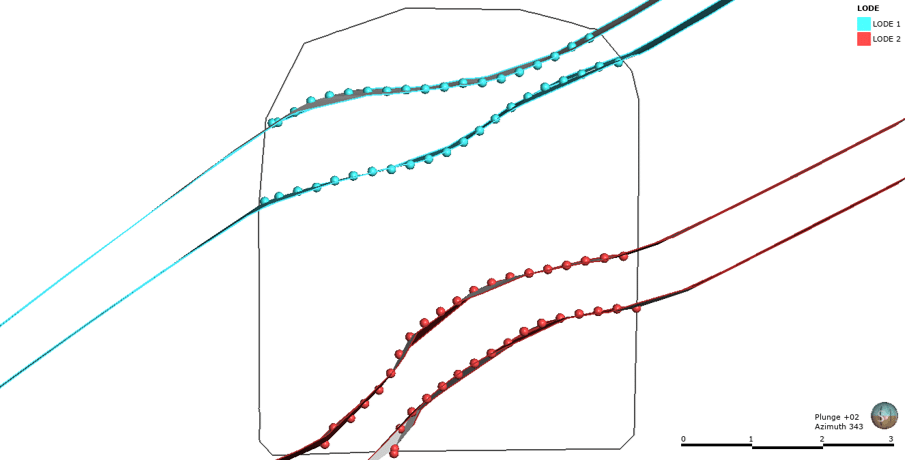
Once imported, the underground mapping can be viewed, by dragging the points into the 3D scene from the Project Tree. The drop-down display can be toggled to view the assigned Lode as well as whether the map feature is HW or FW.
Next, we will create a series of New Selections,
allowing for the extraction of subsets of points. This will allow each
geological feature to be modelled separately.
Right Click the Underground Mapping points
> New Selection
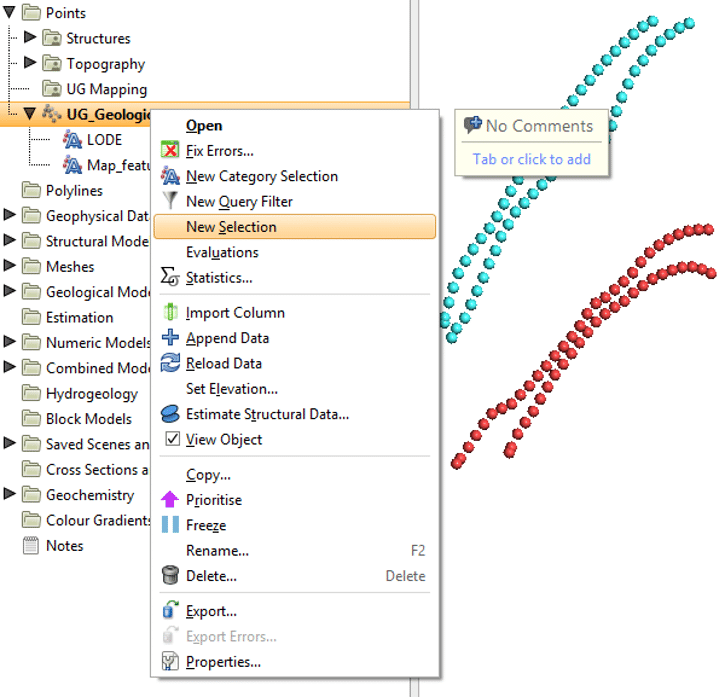
Use the ‘…’ to build a query. In this first example, we want to create a query for extracting just the HW points for Lode 1.
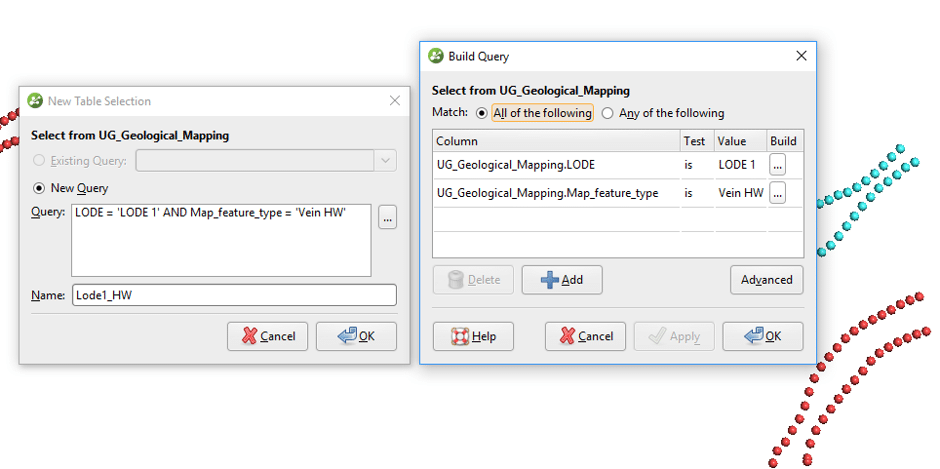
Click OK.
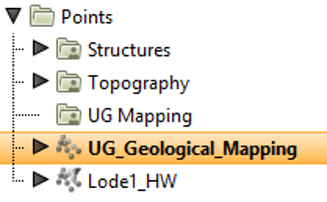
This will create another object in the Project
Tree for the selected points.
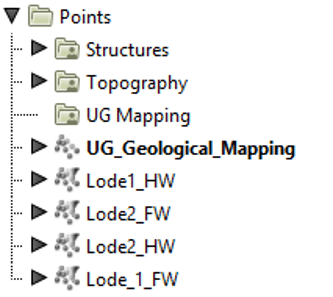
For veins, the HW and FW of each lode need to be independently extracted. Repeat the above process for each HW and FW.
In
Leapfrog Geo, a vein is a type of
contact surface which crosscuts and removes existing lithologies and replaces
them with the vein lithology inside the
boundary defined by the HW and FW surfaces. These HW and FW surfaces are
constructed from selected input data and can be refined independently of one
another to include additional data such as mapping points.
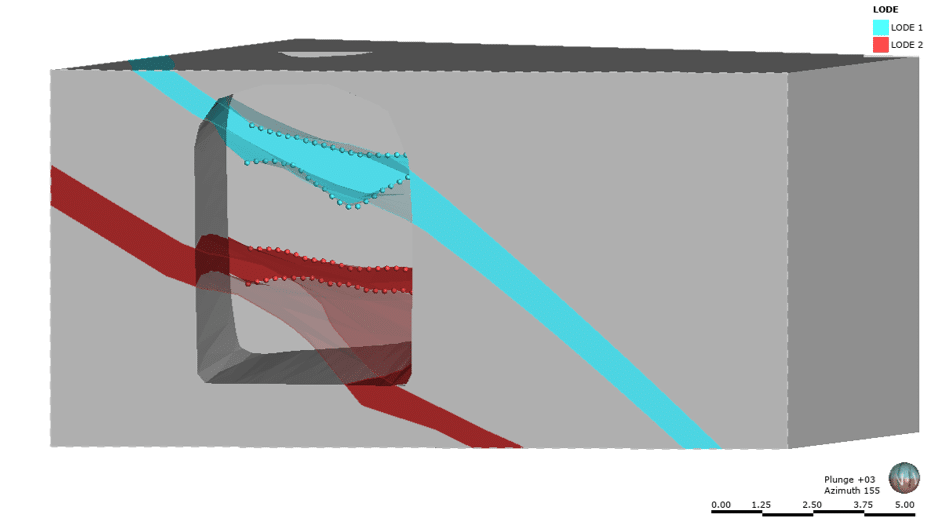
In your geological model, you will have a
series of veins modelled from selected assay and geological intervals from your
drilling. We can now add our mapping data to the hanging wall and footwall
veins to ensure our meshes are made from the latest geological information.
Under the Surface Chronology, Expand the
project tree of Vein 1 to find the Hanging Wall surface.
Right Click the Hanging Wall > Add >
Points
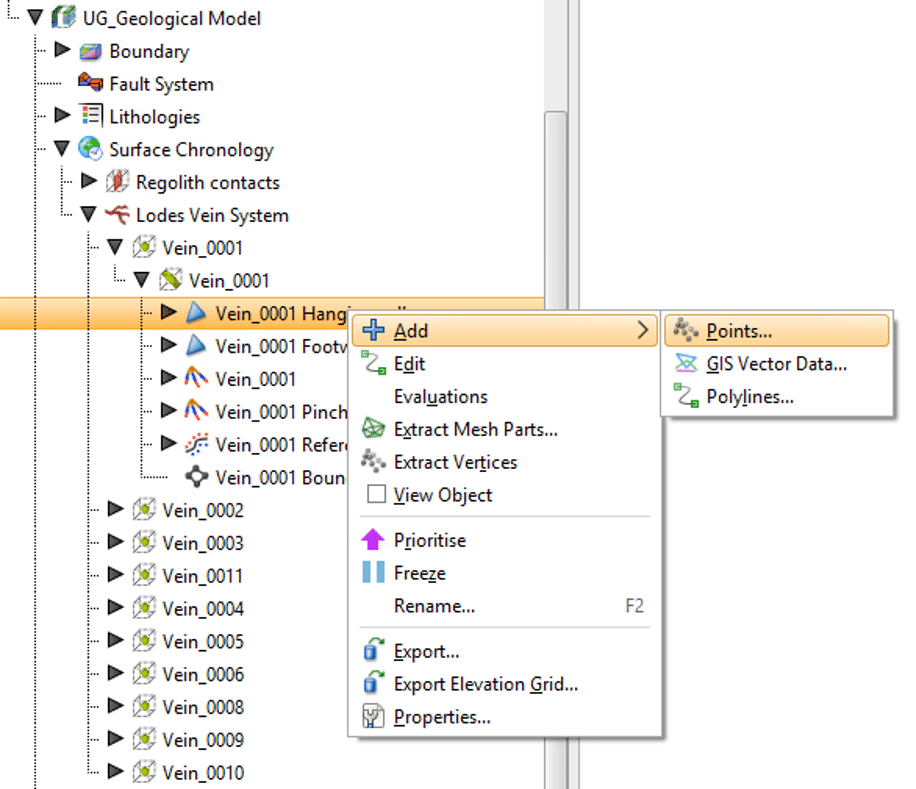
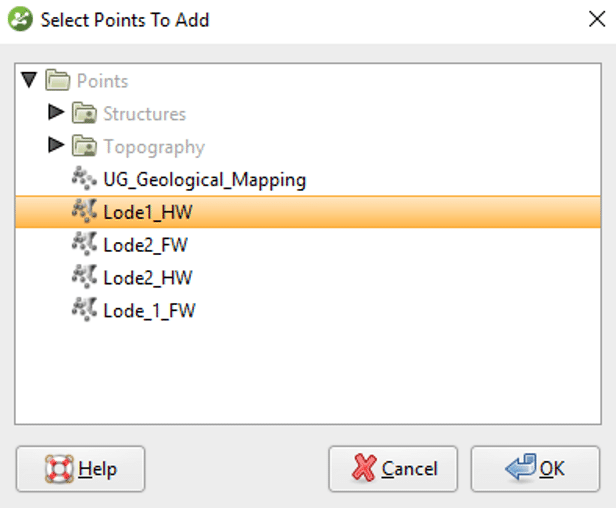
Select the filtered Vein 1 HW points.
The modelling will dynamically update to incorporate the mapped points as
well as any previously included drilling.
Repeat this process for the footwall surface and
for any other vein or geological feature.
You will now have an implicit model of your underground
veins.
To take this information back to Deswik, the
output volumes can be exported from Leapfrog.
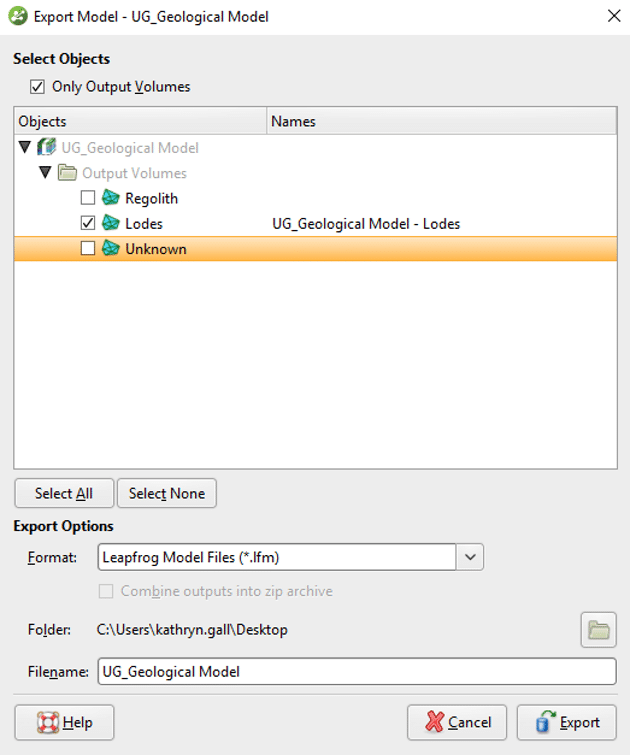
Right click the Geological Model Header in the
project tree > Export
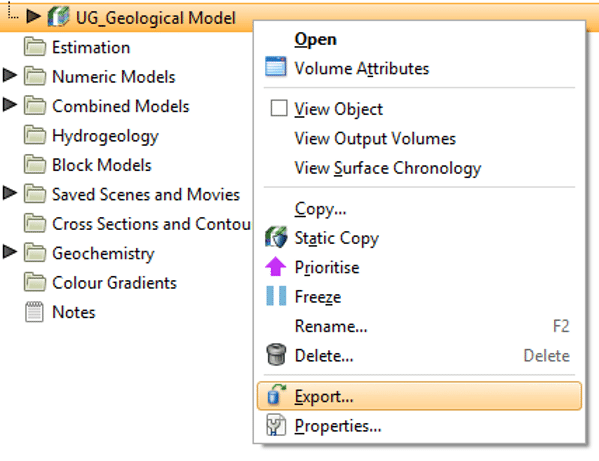
Check the boxes for the outputs that are to be exported and ensure the format is set to Leapfrog Model Files. Click Export.
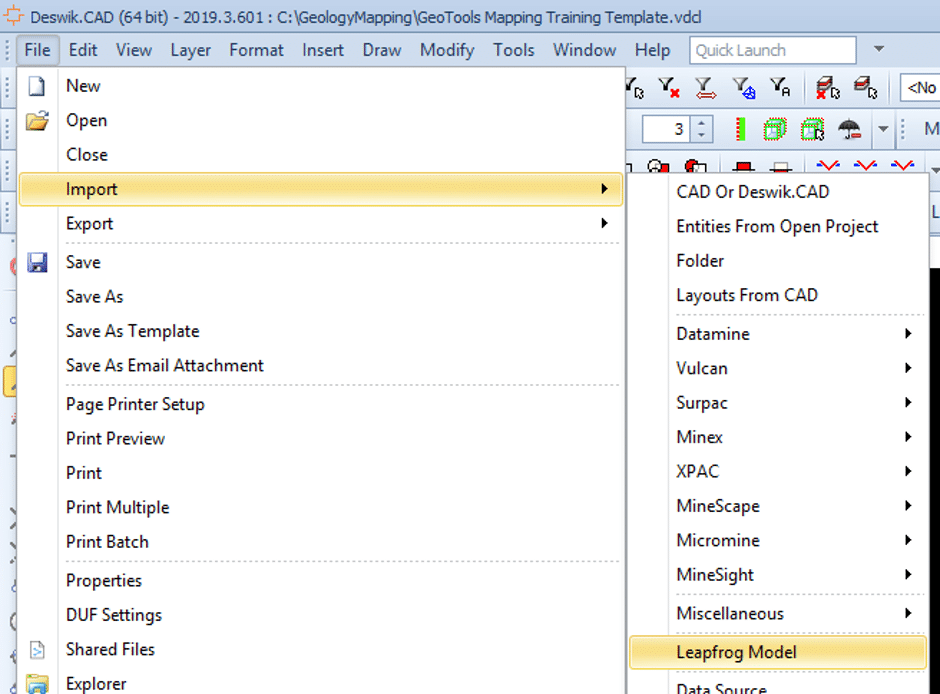
To import the meshes into Deswik.CAD, go to File | Import | Leapfrog Model
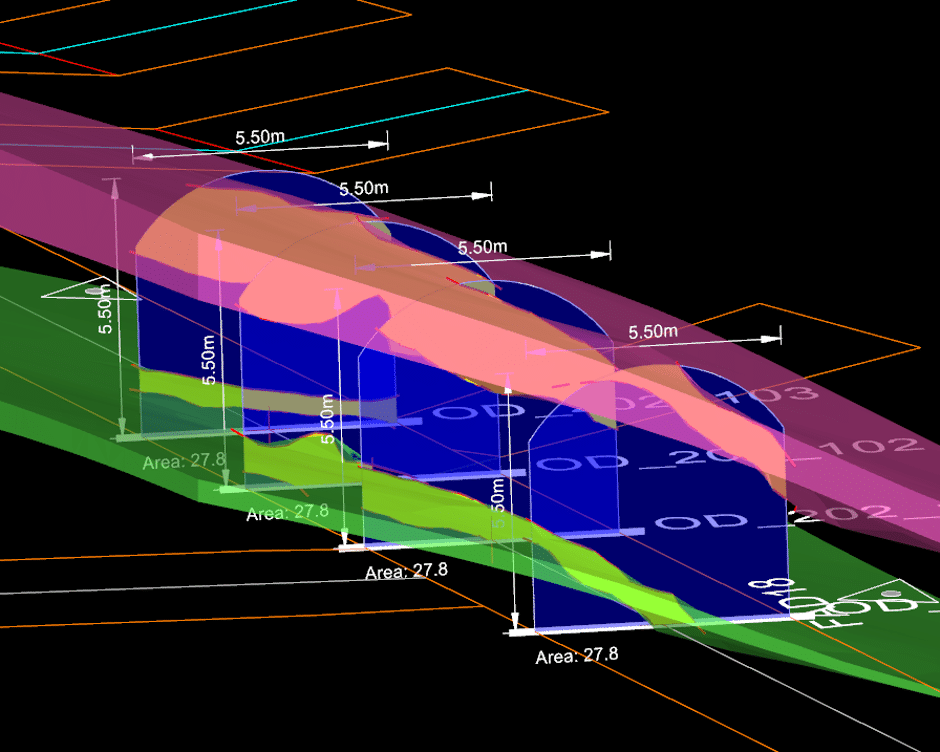
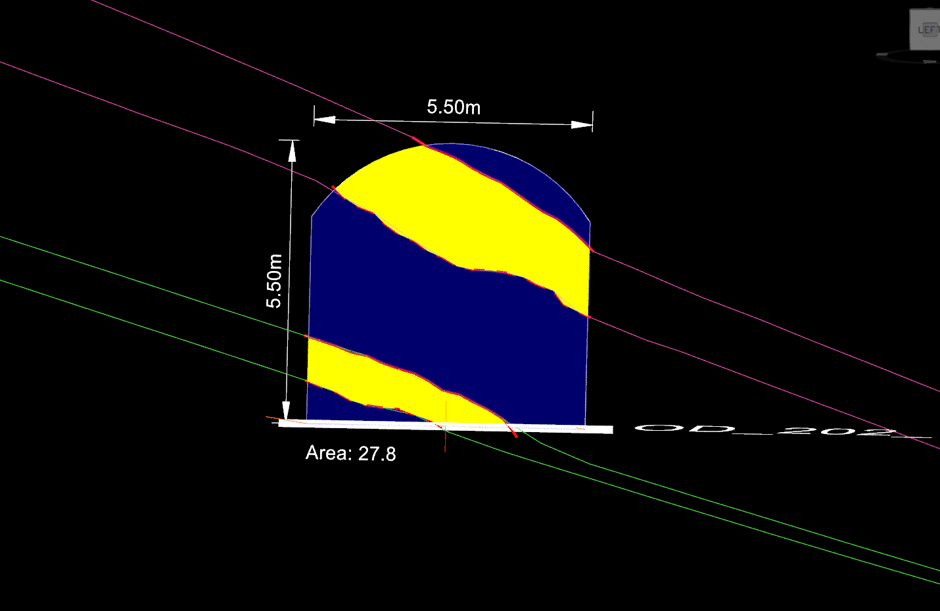
The meshes can be reviewed against all your underground mapping, as well as development and stopes.

Updating your
Underground Model
This Leapfrog Geo workflow allows for dynamic updating of geological
models as your mapping is updated. Once
the selections and filters are set up it is an easy process to reload the raw
mapping data as new information becomes available, ensuring that models are
always up to date.
As new mapping is completed, the updated
mapping information can be exported from Deswik. Inside Leapfrog, your workflow as already been
set up. All you need to do is reload the points information.
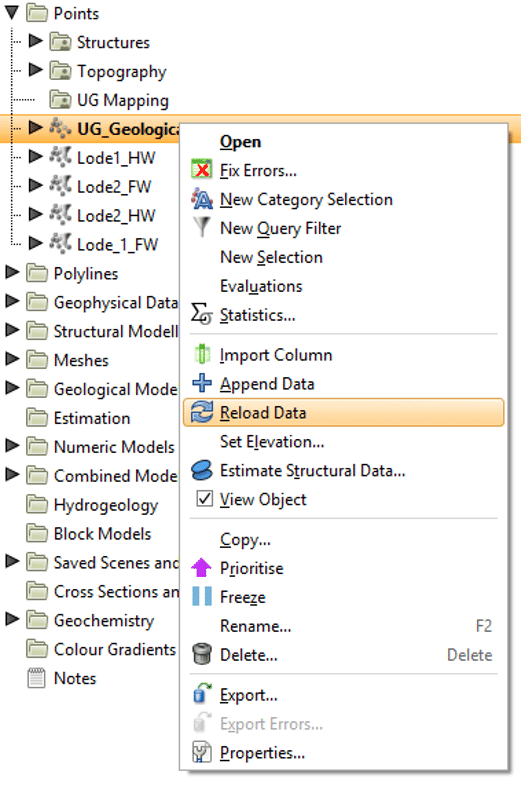
Right Click your Underground Mapping points
> Reload Data
Leapfrog Geo’s dynamic workflows enhance the geological modelling process, allowing geologists to monitor underground vein geometry and position in rapid time to aid with reducing dilution and assist mine development and stope design. Deswik.Mapping improves the consistency of geological mapping by enabling geologists to use standardised methods, styles and formats when recording their observations ensuring that all data is captured to an agreed standard. The above work can be used for Face as well as Backs Mapping.
This dual workflow allows for a robust and consistent underground mine mapping program with up to date implicit geological models. Pair Seequent’s Leapfrog Geo and Deswik.GeoTools into a single industry leading workflow for smarter mining. You can download a copy of the latest version of Leapfrog Geo or Deswik.GeoTools from the website here and try this workflow out for yourself.