


Introduction
This example replicates the “Rapid drawdown” examples illustrated in SEEP/W and SIGMA/W. The purpose of this example is to demonstrate the steps required to conduct a stability analysis using the pore-water pressure results from a SEEP3D analysis. For further information on the background of rapid
drawdown scenarios, please see the SEEP/W or SIGMA/W examples. The stability results obtained using the three-dimensional (3D) pore-water pressures are compared to those from the original two-dimensional (2D) analyses.
Numerical Simulation
The problem configuration for the 2D SEEP/W analysis is shown in Figure 1. The embankment has a height of 10 m with 2:1 side slopes and sits on 10 m of foundation soil. The reservoir depth is 9 m. The downstream toe has a granular under-drain which keeps the water table at the same elevation as the downstream ground surface for a distance of 5 m under the embankment toe. The under-drain is represented with a zero pressure head boundary condition.
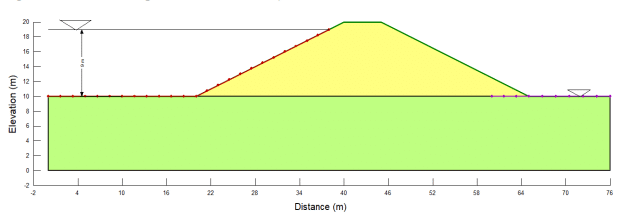
Figure 1. 2D problem configuration including materials and boundary conditions.
For the purposes of this illustrative example, the embankment and foundation soils are defined to have the same material properties. The saturated hydraulic conductivity is 0.1 m/day, with a compressibility of 0.0002 /kPa. In SLOPE/W, the Mohr-Coulomb material model is used, with a unit weight of 20 kN/m3, cohesion of 5 kPa, and Phi of 30⁰.
A steady-state seepage analysis defines the initial conditions, where the reservoir level is set to a total head of 19 m. A child transient seepage analysis simulates the falling reservoir level over a 5 day duration. The time-dependent total head boundary condition used to simulate drawdown is shown in Figure 2. To monitor the pore-water pressure response of the embankment following the reservoir drawdown, the transient analysis duration is set to 30 days.
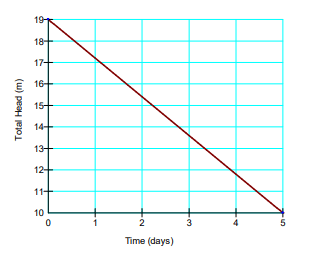
Figure 2. Reservoir elevation with time during drawdown.
The 2D stability analysis is created by adding a SLOPE/W analysis as the child of the transient SEEP/W analysis. The pore-water pressure conditions for the stability analysis are taken from all time steps in the parent SEEP/W analysis. The entry-exit slip surface is defined in the right to left direction to determine the critical Factor of Safety of the upstream slope as the reservoir drains and the pore-water pressures in the embankment change.
After defining the 2D analyses, a 3D geometry is added to the project file with two SEEP3D analyses associated with this geometry. These SEEP3D analyses have the same configuration as the 2D seepage analyses, such that one is the steady-state, parent analysis and the other is a transient child analysis with a duration of 30 days. The 3D geometry is created by importing the 2D steady-state seepage analysis into BUILD3D. This automatically creates a 1 m extrusion of the two-dimensional cross-section. To extend the extrusion to 10 m, the Extrude item in the Design History list has been edited (Figure 3) and the extrusion slice has been set to 10 m.
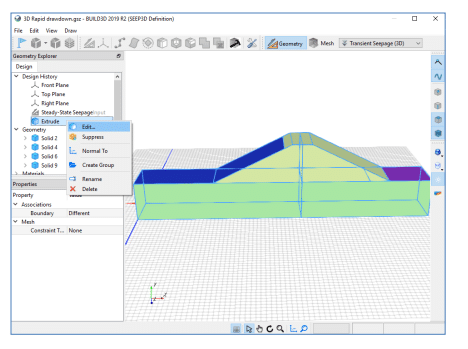
Figure 3. Modifying the default extrusion distance in BUILD3D.
In BUILD3D, the section tool is used to generate a 2D cross-section, which yields the 3D results along that section for use in 2D analyses. In the Section command, a vertical XY plane is defined by setting the Direction X,Y,Z values to {0,0,1}, with an offset of 5 m so that the section runs through the middle of the 3D geometry. The Origin X,Y,Z coordinates are set to {0m, 0m, 0m} to ensure that the 2D cross-section will align with the X,Y origin of {0m ,0m} in the SLOPE/W analysis (Figure 4).
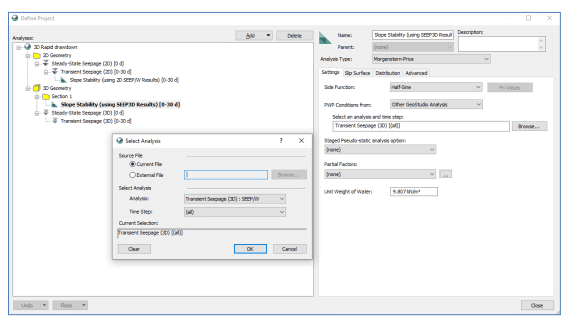
Figure 4. Creating a section in BUILD3D for generating a 2D geometry.
Once created, the section is listed in the Geometry Sections tree of BUILD3D. Selecting the new section and using the Generate command produces a 2D child geometry under the 3D parent geometry. A SLOPE/W analysis can now be added to the 2D geometry section, to simulate the influence of the 3D pore-water pressure response on stability. This SLOPE/W analysis has the same properties as the other SLOPE/W analysis in the project file, except the pore-water pressures are defined from the 3D transient seepage analysis using the “Other GeoStudio Analysis” option in the dropdown menu (Figure 5).

Figure 5. Selecting the SEEP3D analysis pore-water pressure results for the 2D stability analysis.
Results and Discussion
Figures 6 and 7 show the dissipation of excess pore-water pressures 2 days after the start of drawdown in the 2D and 3D transient seepage analyses, respectively. At this time step, flow in both analyses occurs towards the upstream embankment face into the remaining reservoir and in the downstream direction towards the under-drain. The pore-water pressure responses along the center of the embankment in each transient analysis are shown in Figure 8. Similar pore-water pressure responses are seen in both the 2D and 3D analyses, as expected.
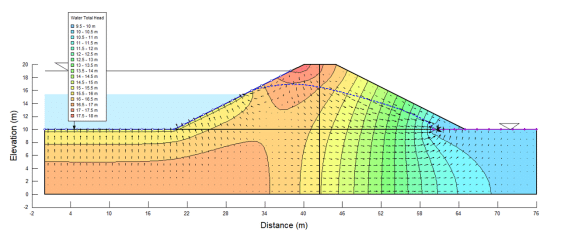
Figure 6. Pore-water pressure conditions 2 days after start of the drawdown in the 2D seepage analysis.
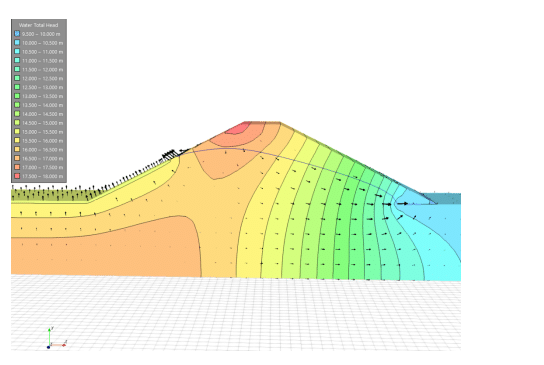
Figure 7. Pore-water pressure conditions 2 days after start of the drawdown in the 3D seepage analysis.
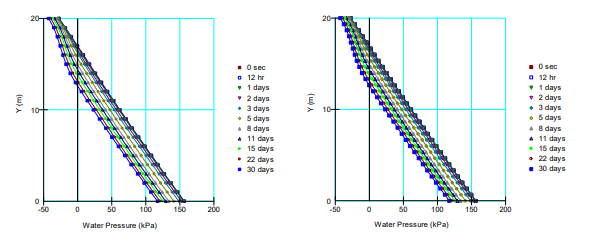
Figure 8. Comparison of the pore-water pressure response over time at the center of the embankment in the 2D (left) and 3D (right) analyses.
The critical Factor of Safety over the modeled duration never falls below 1.0 (Figure 9). Overall, the SLOPE/W analyses produce similar results; however, there is a small difference in the calculated Factor of Safety around days 4 and 5. This is attributed to the coarser mesh that is applied in SLOPE/W when importing pore-water pressure results from a SEEP3D analysis.
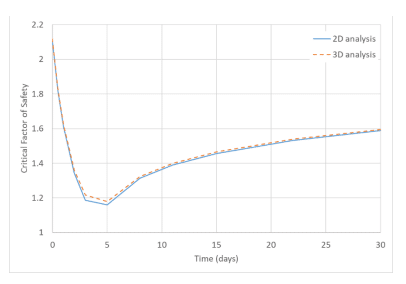
Figure 9. Critical Factor of Safety versus time when using the pore-water pressure conditions from the 2D and 3D seepage analyses.
Summary and Conclusions
This example illustrates the procedure for importing pore-water pressure results from SEEP3D into a two-dimensional SLOPE/W analysis. Comparison of the simulated pore-water pressures and subsequent factor of safety over time, show that the 2D and 3D seepage analyses produce similar results.