Leapfrog Energy 2021.1 is a significant milestone release and sees major enhancements to the Leapfrog engine – building upon previous releases to deliver powerful new features and functionality.
Not only can you now import 2D and 3D SEG-Y seismic data into your workflow (Read more about this here ), the new release also includes a host of new improvements, better performance and greater flexibility. Discover the key highlights in this blog:
Import multiple well data sets
Previous to this release, you could only have a unique well data set, whether you imported it from CSV tables, from Central or a compatible database. In Leapfrog Energy 2021.1, you can now import multiple well data sets in your projects, simplifying your workflows and expanding possibilities for managing your well data.
Several uses of such capability can be envisaged; for example, when drilling a new well in a project with existing wells and where models have been built in Leapfrog Energy based on the existing wells. It becomes easy to create a new well data set for the well being drilled, and frequently update the progress of the drilling and the lithologies encountered without triggering changes in your main model(s). Once the results of the well cuttings analysis and drilling data have been verified and formatted according to your models, they can be appended to the main well data set to dynamically update the models.
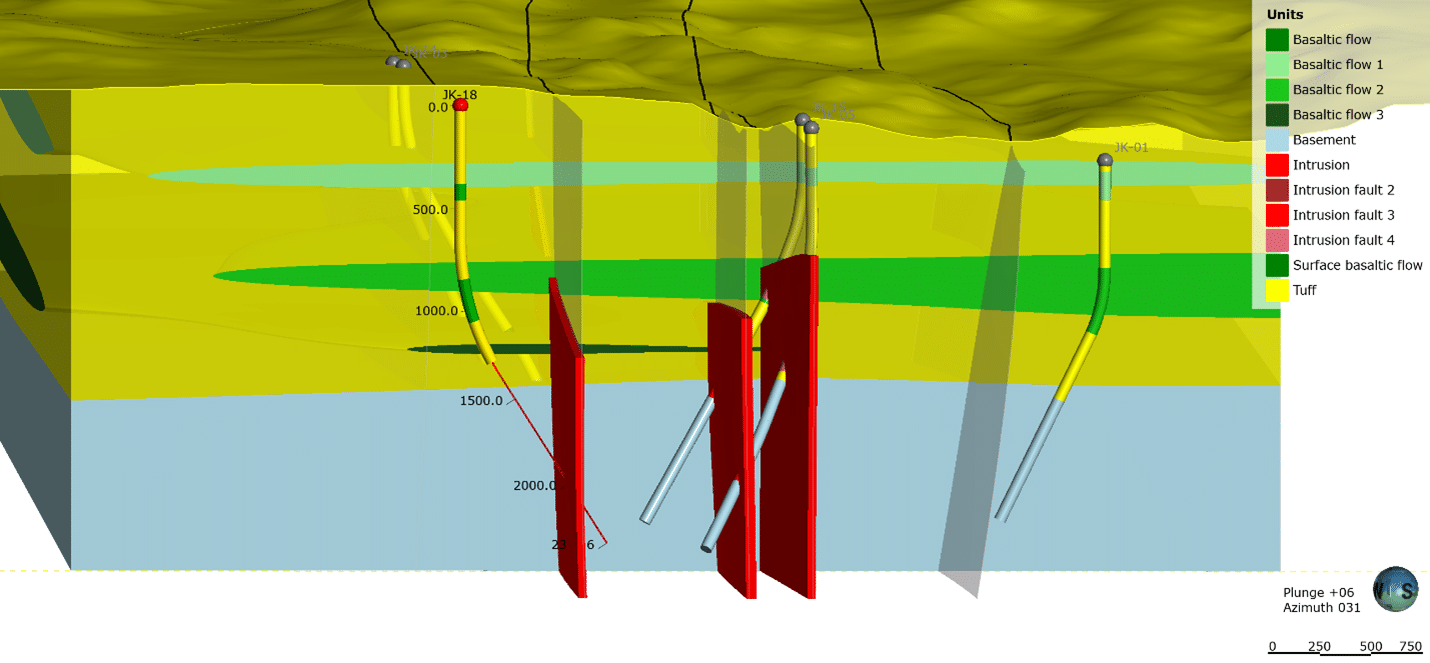
Figure 1: Drilling progress of a new well and planned trajectory
In other cases, this could allow you to separate the wells by types, purpose, data quality or data source. For example, by keeping the shallow water and monitoring wells separated from the deep producers and injectors it will simplify the conception of your geological model by using only the well with relevant/trustworthy data.
Cross section improvements
At each new release, Seequent increases the number of data types that can be visualized on the cross sections in Leapfrog Energy. Previously, we added the blocks models, flow simulation grids, certain formats of geophysical grids and the planned wells; in this new release of Leapfrog Energy we have added the point data as well as the structural data and polylines.
Point data also encompasses the time-dependant point files used to visualize earthquake locations. Visualization setting options include the distance range from the section of the points you want to integrate, value filters, colors and their representation symbol.
Structural data, including those along the well traces can now be visualized onto the cross sections. In the image below, the interpretation of FMI fracture logs is displayed along the well SD-09.
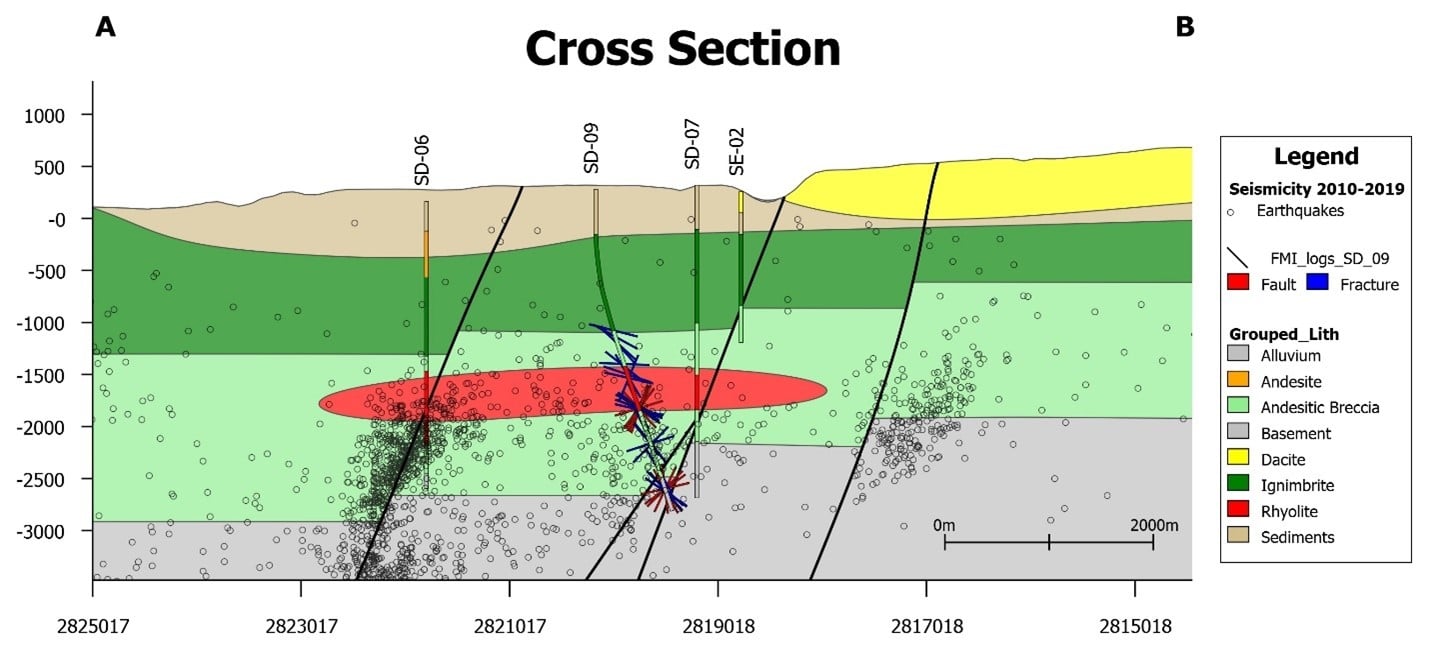
Figure 2: cross section of a geological model with earthquake data and FMI log interpretation from well SD-09
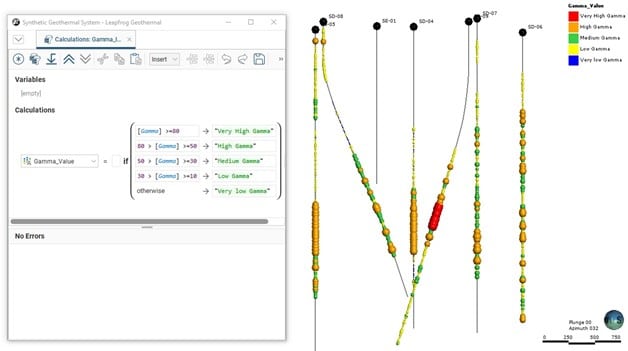
Calculations on point tables
In the previous release of Leapfrog Energy, new architecture of the well database opened a number of new possibilities in the way you interact with your well data tables. You can rename, delete or import columns in your tables, and calculations are available for interval tables. In Leapfrog Energy 2021.1, the calculations are now available for Point tables, including LAS files.
Doing some calculations on your Point tables in Leapfrog directly will save you from having to reload or add columns in your tables each time you want to do simple operations on your data.
The functionalities included in the calculations are of various types, from basic operations to complex comparison, conditional testing (IF/THEN), mathematics operations and unit conversion.
For example, it is now simple to create a column for temperature in degrees Celcius from a temperature log in degrees Farenheit, to apply a correction to measured physical properties of the formations, or to separate numeric value into categories for better visualization of data.