


During this demo, we show you how you can easily visualize your geoscientific data in Target for ArcGIS Pro.
We will show you various ways of importing data combined with 2D and 3D visualization. Come check out what’s included in the latest release of Target for ArcGIS Pro!
Overview
Speakers
Kanita Khaled
Geophysicist – Seequent
Duration
25 min
See more on demand videos
VideosFind out more about Seequent's mining solution
Learn moreVideo Transcript
[00:00:00.348]
(calm music)
[00:00:10.040]
<v Kanita>My name is Kanita Khaled.</v>
[00:00:11.900]
Welcome to our live demo
[00:00:13.530]
for Target for ArcGIS Pro importing and visualizing data.
[00:00:18.710]
So, today we’ll be talking about how to import
[00:00:21.210]
and visualize your drillhole and subsurface data
[00:00:23.910]
in Target for ArcGIS Pro.
[00:00:26.160]
We’re going to keep it fairly high level,
[00:00:28.250]
give you the highlights,
[00:00:29.210]
but I’d be happy to go over any specific functionalities,
[00:00:33.750]
either one-on-one, afterward as well.
[00:00:36.120]
Okay. So, my name is Kanita Khaled.
[00:00:38.330]
I’m a Geophysicist here at Seequent
[00:00:40.350]
based in our North America branch, in Toronto.
[00:00:45.500]
My training is in geophysics,
[00:00:47.160]
primarily out of the mining and exploration industries,
[00:00:51.200]
and here at Seequent,
[00:00:52.300]
I work within our technical team for most parts,
[00:00:56.300]
but I do often also collaborate
[00:00:58.510]
with our other business units.
[00:01:02.340]
Okay, so with introductions now out of the way
[00:01:04.930]
let’s dive right into the demo.
[00:01:06.950]
I am going to turn off my video camera here
[00:01:09.830]
just to accommodate a bit more bandwidth while this streams.
[00:01:17.550]
And I’m going to dive right into the application, ArcGIS Pro.
[00:01:24.500]
Okay. So, here is a blank map of ArcGIS Pro.
[00:01:28.460]
I can see that I have my Target pane up at the top
[00:01:32.550]
and I am signed in with my Seequent ID
[00:01:35.920]
and that’s required to access the functions
[00:01:38.870]
that are within the Target ribbon.
[00:01:42.335]
(clears throat)
[00:01:43.660]
On the left hand side of the Target ribbon,
[00:01:46.740]
I can see the import group
[00:01:49.110]
and this import group is what allows me
[00:01:51.950]
to import in a variety of data types into my project.
[00:01:57.470]
I can import in Geosoft Grids
[00:01:59.910]
and convert them into raster files.
[00:02:02.420]
I can import in subsurface mesh data
[00:02:05.540]
in the format of OMF or Geosoft surface files.
[00:02:11.070]
And the last category here is drillhole data,
[00:02:13.720]
which is what we will be importing in to start off today.
[00:02:19.620]
The first way to import drillhole data
[00:02:22.540]
is to import either as an Excel
[00:02:25.620]
or an Access file, pretty common format.
[00:02:30.050]
You can also import drillhole data with an ODBC connection,
[00:02:34.780]
either hosted locally or on your network.
[00:02:39.130]
And you can also import in text files
[00:02:42.110]
in the format of ASCII or CSV files.
[00:02:48.000]
Now, if your organization logs your drillhole data
[00:02:50.840]
using programs like acQuire or MX Deposit,
[00:02:55.130]
you can import data directly from those programs in
[00:02:58.770]
right into the ArcGIS Pro environment as well.
[00:03:02.170]
And finally, if you have preexisting Geosoft Target project,
[00:03:07.850]
the entire project can be directly imported into ArcGIS Pro.
[00:03:13.360]
So, today let’s focus on the import process
[00:03:17.690]
from MX Deposit into Target for ArcGIS Pro.
[00:03:21.980]
I’m going to flip over to my browser
[00:03:25.450]
where I have MX Deposit
[00:03:30.730]
and load it up.
[00:03:31.910]
So, we’ll sidestep a little bit here
[00:03:35.650]
to talk about MX Deposit very briefly.
[00:03:38.870]
Here I’m logged into the MX Deposit program online
[00:03:43.550]
on my browser.
[00:03:44.740]
If you’re unfamiliar with MX Deposit
[00:03:47.340]
it’s a cloud-based logging application.
[00:03:50.880]
It is an offering within the Seequent family of products
[00:03:54.420]
and it’s designed to help mining and exploration companies
[00:03:58.730]
simplify and modernize their drilling program.
[00:04:02.790]
It allows you to log drillhole data anywhere in the world,
[00:04:06.450]
as long as you have internet
[00:04:08.840]
and it also has remote capture options
[00:04:10.810]
if you don’t have internet access.
[00:04:14.420]
And the integration of Target for ArcGIS Pro with Deposit,
[00:04:19.110]
essentially allows you to very efficiently
[00:04:21.790]
import in drillhole projects
[00:04:23.410]
from this cloud-based environment
[00:04:26.210]
directly into the ArcGIS Pro environment.
[00:04:29.910]
And so for this to work,
[00:04:31.840]
you need to ensure that you’re logged in
[00:04:33.350]
with your Seequent ID
[00:04:35.140]
that contains the subscription for both Deposit
[00:04:37.880]
and Target for ArcGIS Pro.
[00:04:40.840]
So here I’m logged in to my web browser
[00:04:43.130]
with my Seequent ID
[00:04:44.740]
and from the project summary page,
[00:04:47.960]
I can see all of the drillhole projects
[00:04:52.040]
that I’ve been given access to by my organization.
[00:04:56.450]
So, these projects listed up here,
[00:04:59.380]
these are projects that I’ve been granted access to.
[00:05:03.460]
And on this list I can see Wolfpass,
[00:05:07.200]
is listed as one of the projects.
[00:05:09.160]
And this is the project that I want to bring
[00:05:11.190]
into Target for ArcGIS Pro today.
[00:05:15.050]
Below I can see a few filters
[00:05:18.310]
and these are simply different activities
[00:05:21.130]
associated with each of these drilling programs,
[00:05:23.600]
so core logging, RC logging and so on.
[00:05:29.020]
Okay. Let’s switch back to ArcGIS Pro.
[00:05:32.740]
So I have my data in MX Deposit
[00:05:34.810]
or logged in MX deposit
[00:05:36.210]
and I want to bring all of that in to ArcGIS Pro.
[00:05:39.200]
So to do that I would head over to the import group
[00:05:42.940]
and under drillhole data
[00:05:44.860]
I can select MX Deposit
[00:05:48.750]
and this brings up the MX Deposit importing function.
[00:05:54.470]
I can type in the name of my project,
[00:05:56.790]
so the project I’m bringing in is Wolfpass,
[00:06:00.130]
and type that in.
[00:06:03.490]
And because this is connected to my Seequent ID,
[00:06:06.840]
when I select this dropdown list here
[00:06:09.260]
of the Deposit projects,
[00:06:11.020]
I can see indeed Wolfpass is listed as one of the projects.
[00:06:15.590]
Great.
[00:06:16.620]
So, now I simply have to go in
[00:06:18.870]
and choose one of the activities that are listed
[00:06:22.170]
and for our purposes we’re going to bring in core logging,
[00:06:24.910]
so the drillholes.
[00:06:27.440]
And finally, because this is a coordinates aware system
[00:06:31.730]
you’ll need to spatially reference your project
[00:06:34.590]
before bringing it in.
[00:06:38.130]
So once I click run,
[00:06:40.350]
this will essentially start the import process.
[00:06:43.030]
It’s going to go ahead and look the project up on the cloud
[00:06:47.150]
logged in MX Deposit
[00:06:48.660]
and then import it into the ArcGIS Pro environment here.
[00:06:53.420]
So, keeping in mind time here,
[00:06:55.640]
I’ve already imported this project in to ArcGIS Pro.
[00:07:00.460]
And if I were to click on run,
[00:07:02.260]
this would finish that import
[00:07:03.580]
and then I would be able to visualize my drillhole data.
[00:07:08.090]
So let me zoom in.
[00:07:14.700]
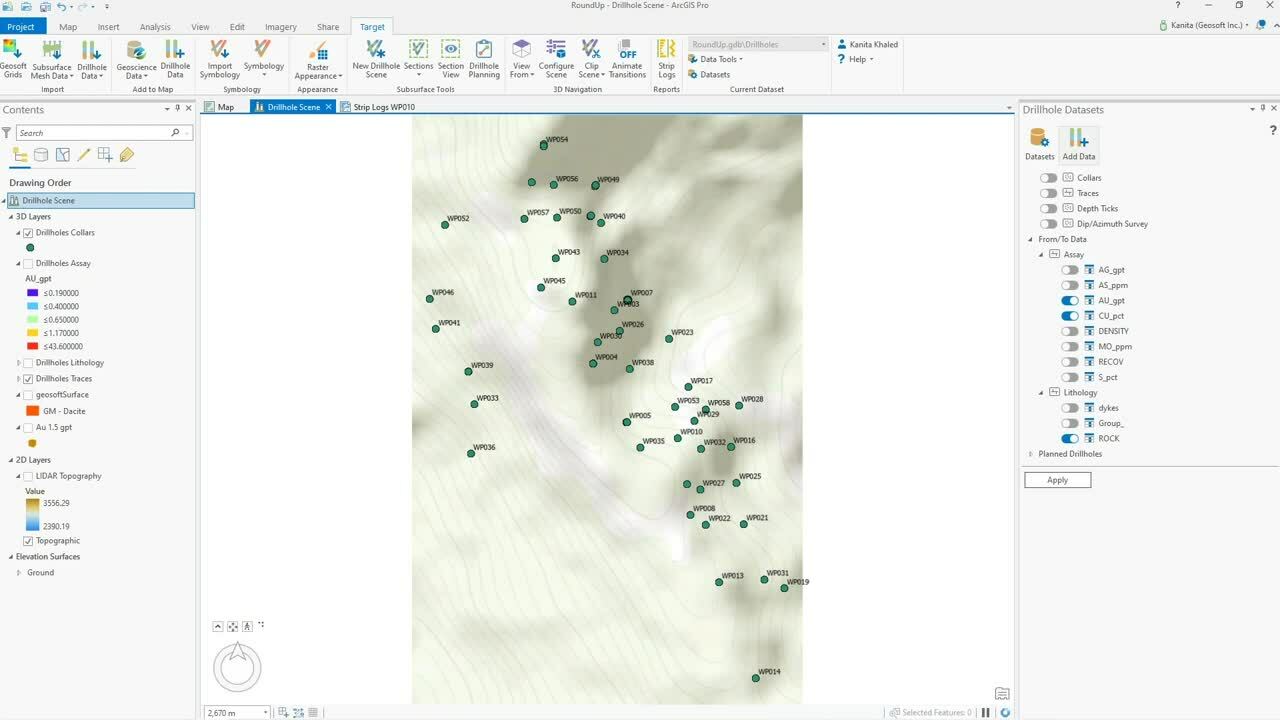
And so here I can see in 2D view.
[00:07:17.550]
I have my colors, I have my drill traces in plan view
[00:07:22.080]
and I can see the color names as well.
[00:07:24.480]
So this is somewhere in Colombia.
[00:07:28.190]
If I wanted to, I could take the scene from this 2D map view
[00:07:32.950]
and select this new drillhole scene option
[00:07:36.480]
that would take me into a 3D view.
[00:07:40.030]
So here we’re working with both 2D and 3D environments
[00:07:44.980]
and so here in the 3D view
[00:07:47.300]
I can then rotate
[00:07:50.220]
my project scene
[00:07:53.340]
and visualize that project there in 3D.
[00:07:55.510]
I can turn around, inspect my data from various angles
[00:07:59.850]
from top, north, south, et cetera.
[00:08:03.850]
There’s a couple of handy preset options
[00:08:06.370]
that you can select to set your view.
[00:08:10.960]
So at this point I’ve also brought in things
[00:08:13.470]
like my drillhole data that are categorical or numerical.
[00:08:17.330]
I can start to load those things as well
[00:08:19.880]
from the add to map, drillhole data tool.
[00:08:25.850]
And this essentially gives me a dropdown
[00:08:28.140]
of all the down hole attributes
[00:08:32.146]
that I have with this project.
[00:08:33.290]
So, my lithology, my assay.
[00:08:36.630]
So if I wanted to start visualizing these attributes
[00:08:39.810]
I simply toggle it on
[00:08:42.740]
and once I click on apply
[00:08:46.380]
that would then load
[00:08:48.820]
that particular lithology group on my scene.
[00:08:54.310]
So that it’s just taking a second there to load.
[00:08:57.650]
But yeah, all of your data here is organized like this.
[00:09:00.790]
You can see under assay, I have my gold, my copper,
[00:09:04.990]
and the way to visualize these data attributes,
[00:09:10.160]
would simply need to toggle them on and then press apply.
[00:09:14.060]
And that would then load it up to your 3D scene like this.
[00:09:19.360]
So there’s my lithology data
[00:09:21.040]
and of course you can click on each of these segments here
[00:09:26.821]
just to check out exactly what attribute is related
[00:09:29.480]
to the point that you just clicked on your screen.
[00:09:34.530]
And similarly, I could do the same for my assay data.
[00:09:38.620]
Okay. Let’s view this from top.
[00:09:44.780]
What else can I bring in other than drillhole data?
[00:09:47.160]
So other than drillhole data
[00:09:49.240]
I’m also able to visualize raster data
[00:09:53.130]
and I can do this by bringing in Geosoft Grids.
[00:09:57.360]
So, if I click on this Geosoft Grid option
[00:10:01.860]
and I want to bring in topography data
[00:10:03.860]
that I have over this area.
[00:10:06.130]
I could simply browse to my folder
[00:10:08.260]
that contains that topography dataset
[00:10:15.940]
and selecting run would take that topography dataset
[00:10:20.970]
that’s in Oasis montaj grid file format
[00:10:24.910]
and convert it into a raster dataset
[00:10:28.270]
that I can visualize in context with my project.
[00:10:35.270]
So there’s that topography data again,
[00:10:37.490]
because this is in a 3D view
[00:10:38.860]
it’s just draped right on top
[00:10:40.530]
of my 3D high elevation surface here.
[00:10:45.530]
So with the import grid option
[00:10:47.640]
you can bring in other relevant grid of data,
[00:10:49.930]
if you have your physics,
[00:10:51.088]
(indistinct) geophysics survey
[00:10:53.740]
or ground geochemistry for example,
[00:10:57.210]
you could bring that in.
[00:11:02.740]
One other feature that I want to talk to about today
[00:11:07.320]
from the import group here is the subsurface mesh data tool.
[00:11:12.910]
So using the subsurface mesh data tool
[00:11:15.630]
I can import in geological or other subsurface data
[00:11:21.210]
directly into my drillhole scene and project.
[00:11:24.220]
I can do this in the format of OMF files,
[00:11:27.830]
which are open mining format files,
[00:11:30.220]
or Geosoft surface files.
[00:11:33.100]
So, for example, I have my gold grid shells
[00:11:39.050]
that were created in Oasis montaj
[00:11:42.570]
and I can export that out
[00:11:44.500]
from Oasis montaj into an OMF format
[00:11:46.740]
and bring that directly in to Target for ArcGIS Pro.
[00:11:51.580]
So let’s find this file that contains my gold shells.
[00:11:54.810]
So here it is.
[00:11:56.443]
So this is in an OMF format.
[00:12:02.329]
I would need to specify the coordinate system.
[00:12:05.370]
And then once I select run,
[00:12:07.350]
this is going to take this OMF file format
[00:12:10.360]
and convert it into a multi-patch object,
[00:12:14.300]
a 3D multi-patch object
[00:12:19.481]
that can then be visualized in my 3D scene.
[00:12:23.668]
So there’s that gold shell from my project.
[00:12:27.549]
Enclosing grids of 1.5 grams per ton right onto my scene.
[00:12:35.250]
Similarly, I can also visualize geologic surfaces.
[00:12:40.260]
So if you create a geological model,
[00:12:42.050]
for example in Leapfrog Geo,
[00:12:44.110]
and you want to bring that in you could do so.
[00:12:47.460]
For example here in red,
[00:12:49.290]
I have a gold bearing dacite dike bin system
[00:12:54.670]
and this was modeled in Leapfrog Geo
[00:12:57.260]
and then brought into Target for ArcGIS Pro.
[00:13:01.290]
So, with the subsurface mesh data
[00:13:03.730]
I can easily bring in geological data
[00:13:07.120]
that can then add context to my project.
[00:13:13.201]
I’m going to turn off this layer
[00:13:14.570]
and then view my scene from top.
[00:13:17.510]
So, you’ve brought in all of this data,
[00:13:20.310]
you import it all in,
[00:13:21.800]
what else can you do with it?
[00:13:24.220]
One data product that’s really common
[00:13:26.610]
and widely utilized in the industry,
[00:13:28.290]
everyone knows, are cross sections
[00:13:30.970]
and we do have the option to create cross sections
[00:13:33.860]
using the cross section tool here.
[00:13:37.755]
I’m going to close out some of these panels.
[00:13:42.574]
When I select the section create tool
[00:13:45.440]
in the Target’s ribbon here,
[00:13:48.890]
it brings up the section tool
[00:13:50.820]
and I can now create a cross section interactively.
[00:13:56.900]
So I’m just sketching out the outline of the section
[00:13:59.400]
that I want to generate.
[00:14:02.070]
And the spread outline then essentially delineates
[00:14:04.710]
the extent of this particular section.
[00:14:08.470]
And I can create either one
[00:14:10.720]
or I could create multiple offset sections.
[00:14:14.230]
So here I have now five additional offset sections
[00:14:19.050]
and I have these separated at 120 meters.
[00:14:21.430]
I could close that gap up, squeeze these guys together.
[00:14:25.380]
And you can see those extents updating on the fly.
[00:14:29.910]
I can also change other parameters like
[00:14:32.500]
the length of my sections.
[00:14:33.950]
For example say we want these to be slightly longer,
[00:14:38.890]
if I want to change the width of it,
[00:14:41.300]
I could change the thickness.
[00:14:43.180]
So let’s say 45.
[00:14:44.710]
So all of these parameters here are modifiable
[00:14:48.808]
even before you make your cross section.
[00:14:52.750]
And because this is a 3D environment
[00:14:57.450]
you can inspect your cross section
[00:15:00.779]
a little bit more before you actually save it.
[00:15:03.870]
For example if you’re not happy with
[00:15:06.210]
the azimuth of your cross sections
[00:15:07.980]
you could rotate that around.
[00:15:10.250]
You could change those parameters
[00:15:12.150]
and even update the inclination of your cross sections.
[00:15:17.870]
So I can see that taking place on the fly here.
[00:15:22.890]
And once you’re happy with these, you’re ready to save.
[00:15:26.180]
You can go ahead and give it a name.
[00:15:28.040]
You can call it section A, zone A
[00:15:30.470]
or something like that
[00:15:31.720]
and then go ahead and save them.
[00:15:36.020]
Saving them essentially would take you
[00:15:38.330]
to your section manager,
[00:15:40.570]
where you have a host of other sections
[00:15:42.990]
that you’ve previously created.
[00:15:44.300]
So here I have four sections that I’ve already created.
[00:15:48.220]
They’re outlined here in red,
[00:15:50.740]
and yes I have this class actually saved,
[00:15:54.650]
but I can then use my section view tool
[00:15:58.510]
to actually toggle between these sections
[00:16:01.760]
and visualize them in a more familiar cross section view.
[00:16:10.880]
Once you’re in this view,
[00:16:12.790]
you can turn on things like other layers
[00:16:15.240]
that you might have in your scene like your lithology
[00:16:18.080]
or your gold shells for example.
[00:16:21.490]
You’re also able to modify the cross sections.
[00:16:26.960]
For example this section here,
[00:16:29.240]
if I want to change the length of it,
[00:16:32.590]
say I want to make this not as long,
[00:16:35.840]
I’ll do 450,
[00:16:37.040]
I can see the red outline that is showing me
[00:16:39.520]
the new extent that I supplied here.
[00:16:44.980]
And once I save, that goes ahead and it saves that update.
[00:16:52.370]
And once you’re happy with a cross section like this
[00:16:56.490]
you can take this into a layout view
[00:16:58.910]
and you can
[00:17:02.601]
generate a cross section,
[00:17:05.440]
generate a layout that incorporates your cross section
[00:17:07.940]
and so something that’s a little bit more publishable
[00:17:11.190]
and ready to present either at a news release
[00:17:14.050]
or something like that.
[00:17:15.650]
So this is just an example of that.
[00:17:22.520]
Okay, let’s come out here of the section view
[00:17:27.440]
and I wanted to chat with you
[00:17:29.670]
about one last functionality here that’s new.
[00:17:34.250]
It’s been incorporated within the latest release
[00:17:36.570]
of Target for ArcGIS Pro
[00:17:38.470]
and that is strip logs.
[00:17:41.780]
Strip log as you guys might already know
[00:17:44.230]
it’s a down hole plot
[00:17:45.510]
and it’s a sequence of geologic features
[00:17:48.520]
from a single drillhole.
[00:17:51.170]
And by selecting the strip log option here
[00:17:55.430]
from the reporting category,
[00:17:57.440]
I can select a predefined layout template
[00:18:02.960]
for this particular strip log,
[00:18:05.520]
and we include this as an example
[00:18:10.190]
that you can use to build your strip log,
[00:18:12.460]
and from there you simply have to select the hole
[00:18:15.180]
that you want to visualize in your strip log.
[00:18:19.350]
So let’s take a look at an example
[00:18:22.670]
of the kind of strip log report
[00:18:24.950]
that you can generate with this tool.
[00:18:28.730]
So here I have the strip log for hole WP010
[00:18:34.010]
and I can see that using the data strips tool here
[00:18:38.720]
I’ve been able to add multiple chart frames or strips
[00:18:44.760]
that contain my drilling data.
[00:18:47.210]
So, I can visualize my assay results
[00:18:51.220]
as bar plots like I have here
[00:18:53.130]
or if you like as profiles.
[00:18:57.110]
And if you’re looking to visualize their lithology data,
[00:18:59.690]
that can also be done using
[00:19:01.760]
a predefined color template for your lithology.
[00:19:05.220]
And of course each of these charts themes can be modified
[00:19:08.550]
and fine tuned with the appearance tool.
[00:19:13.210]
And because this was built to leverage ESRI functionalities,
[00:19:18.970]
you can add in other things like images or text lines
[00:19:23.280]
to really further (indistinct) your layout
[00:19:26.560]
and make it your own.
[00:19:28.360]
And all of these text, font size,
[00:19:31.400]
all of these are modifiable as well
[00:19:33.240]
because it is using that native ESRI functionality.
[00:19:37.330]
So once you’re happy with your strip log
[00:19:41.420]
you can then share it as a PDF.
[00:19:44.380]
There’s a host of formats that ESRI allows you to export in
[00:19:49.210]
and you can export it out
[00:19:50.990]
to a nice publishable strip log report.
[00:19:58.010]
So with that I would like to conclude my demo for today.
[00:20:03.110]
I’ll just turn on my video here again.
[00:20:06.410]
And there are other new improvements to the latest release
[00:20:09.860]
of Target for ArcGIS Pro, like drillhole planning
[00:20:13.310]
and symbology improvements that I didn’t talk about today.
[00:20:16.210]
If you’d like to know more about these features
[00:20:19.200]
you can check out my.seequent.com/product
[00:20:22.630]
under which you’ll see Target for ArcGIS Pro listed
[00:20:25.770]
and I’m also available to take
[00:20:27.840]
any questions you might have at this time.
[00:20:43.457]
<v Jeff>Hi Kanita, it’s Jeff.</v>
[00:20:45.420]
We have a couple of questions coming in here.
[00:20:49.570]
Just one moment.
[00:20:54.040]
The first question, “Do you need a specific license
[00:20:57.600]
of ArcGIS Pro to use Target for ArcGIS Pro?”
[00:21:02.570]
<v Kanita>You will be able to run Target for ArcGIS Pro</v>
[00:21:05.150]
on all ArcGIS Pro license levels
[00:21:08.400]
including the basic as well.
[00:21:12.550]
<v Jeff>Okay.</v>
[00:21:16.330]
Next question, “You showed some rock color codes.
[00:21:20.010]
Can you use your own rock symbology or customize them?”
[00:21:24.690]
<v Kanita>Yeah, absolutely.</v>
[00:21:26.440]
You are able to import in your own custom rock symbology.
[00:21:31.880]
You can do this either as a layer file
[00:21:35.860]
which you have previously saved
[00:21:37.350]
or you might have it saved in a CSV format.
[00:21:40.970]
Typically CMYK, RGB color codes are used for that.
[00:21:46.207]
If you have something like that saved
[00:21:48.180]
within your rock code library
[00:21:49.890]
you could use that as well
[00:21:51.280]
and then that way your project uses the same convention
[00:21:55.480]
of color codes every time.
[00:22:02.710]
<v Jeff>Okay, excellent.</v>
[00:22:06.410]
One other question, “Can you plan drillholes
[00:22:10.134]
in Target for ArcGIS Pro?”
[00:22:12.985]
<v Kanita>Yes.</v>
[00:22:14.500]
Yeah, that is one of the key features
[00:22:15.900]
of Target for ArcGIS Pro, you can plan drillholes.
[00:22:20.400]
There is a drill hole planning tool
[00:22:23.240]
that allows you to plan your drill hole
[00:22:25.710]
in a variety of different ways.
[00:22:27.970]
You can plan it using a color
[00:22:30.920]
and a known color location and then a target,
[00:22:34.300]
you simply do this interactively
[00:22:35.800]
by clicking right onto your section
[00:22:37.920]
or your 3D drill hole scene.
[00:22:41.660]
And there’s two other methods as well
[00:22:43.410]
that are pretty common.
[00:22:44.640]
So if you know your target
[00:22:46.320]
and you just simply want to back draw the trace
[00:22:49.580]
or the drillhole trace,
[00:22:50.450]
you could do it that way as well.
[00:22:52.010]
So there is a pretty comprehensive
[00:22:54.330]
drill hole planning tool available.
[00:23:02.530]
<v Jeff>That’s great, thank you.</v>
[00:23:04.471]
<v Kanita>Great. Any other questions?</v>
[00:23:11.850]
<v Jeff>One other question just came in.</v>
[00:23:17.671]
“Can you save cross cutting sections?”
[00:23:23.450]
<v Kanita>Yes. So all of the sections</v>
[00:23:25.260]
that you create in Target for ArcGIS Pro are saved
[00:23:30.410]
and you can access them from your section manager tool,
[00:23:35.620]
they’re all saved within here,
[00:23:38.210]
after which you can export them out
[00:23:43.110]
either within a layout view or within a map,
[00:23:46.520]
but all of your sections
[00:23:47.610]
are saved within the section manager.
[00:23:51.640]
If you have other questions that you think of later
[00:23:54.590]
definitely just shoot me an email
[00:23:56.210]
at [email protected]
[00:23:58.940]
or if you’re already using Target for ArcGIS Pro
[00:24:02.700]
you can address any questions related to workflow
[00:24:06.410]
or technical troubleshooting to [email protected].
[00:24:11.890]
Yeah, get in touch with us
[00:24:12.880]
and with that I will end out our presentation.
[00:24:16.100]
Thank you for attending.
[00:24:18.848]
(calm music)