


Learn more about Seequent Central, including the latest updates.
This webinar is the best place to learn how the new functionality can improve efficiency in your workflows, give you more flexibility and help you make decisions faster.
Webinar highlights include:
- Visualise your models directly on the web
- Notify and communicate instantly
- Enhanced modelling workflows through object integration
- Integrate more geophysical data from Oasis montaj
Overview
Speakers
Janina Elliott
Central Technical Lead – Seequent
Duration
36 min
See more on demand videos
VideosFind out more about Seequent Central
Learn moreVideo Transcript
[00:00:01.040]<v Janina>Hello and thank you very much</v>
[00:00:03.020]for joining us today.
[00:00:04.590]My name is Janina Elliott
[00:00:06.430]and I am Seequent’s Central Technical Lead
[00:00:09.200]and it is my pleasure to demonstrate to you today
[00:00:11.800]the latest version of Seequent’s
[00:00:14.060]data and model management system Central 4.
[00:00:18.240]This webinar today is designed to provide you
[00:00:20.640]with a full demonstration of the product,
[00:00:23.410]as well as to present Central 4’s new feature highlights
[00:00:26.880]such as enhanced visualization
[00:00:29.560]and collaboration capabilities in the cloud.
[00:00:32.910]So whether you are new to Central or a veteran user,
[00:00:36.200]this webinar holds valuable information for both parties.
[00:00:40.540]To start off, let’s do a little bit of housekeeping.
[00:00:44.290]The presentation today will utilize
[00:00:46.400]the latest versions of Central, Leapfrog Geo, Edge,
[00:00:50.600]and Oasis montaj.
[00:00:53.030]During the webinar, the audience is muted
[00:00:55.210]to ensure that the presentation doesn’t run over time.
[00:00:58.920]Should you have any questions,
[00:01:00.370]please use the question window in the GoToWebinar dialog
[00:01:04.070]and I will make sure to answer them
[00:01:05.960]either directly after the presentation
[00:01:08.330]or with a personalized email in the following days.
[00:01:12.480]In case you like the presentation so much
[00:01:14.730]you simply must watch it right away again,
[00:01:16.910]or if you would just like to share it with a colleague,
[00:01:19.390]a recording will be made available
[00:01:21.190]to all registered viewers shortly after the presentation.
[00:01:25.620]And if you have a few minutes,
[00:01:27.170]kindly stay online after the webinar
[00:01:29.510]to partake in a short survey.
[00:01:31.670]Okay, let’s get started.
[00:01:34.450]Before we go ahead and jump into the demonstration,
[00:01:37.670]I would like to introduce ourselves.
[00:01:39.570]So who is Seequent?
[00:01:41.800]Some of you may have heard of us
[00:01:43.300]through one of our applications, such as Leapfrog Geo.
[00:01:46.410]Others may have never had a touchpoint.
[00:01:49.040]We are a software company that builds solutions
[00:01:51.810]for the geoscience community.
[00:01:54.090]It is our mission to enable our customers
[00:01:56.510]to make better decisions about the Earth, environment,
[00:02:00.190]and energy challenges
[00:02:02.290]because it is a robust decision-making process
[00:02:05.600]that provide security and longevity to an organization.
[00:02:11.050]Seequent has truly a global presence with over 430 staff.
[00:02:15.630]But not only do we hire geologists from the mining field,
[00:02:18.780]we also bring in experts from other geoscientific fields
[00:02:21.460]and provide active solutions to the civil, energy,
[00:02:24.640]and environmental sectors.
[00:02:26.940]Through this cross-sector engagement
[00:02:28.700]with our global customers,
[00:02:30.620]our team continuously develops new cutting-edge technology
[00:02:34.660]to support you in your daily decision-making process.
[00:02:38.920]To ensure a robust decision-making process,
[00:02:41.940]all the stakeholders in the project,
[00:02:43.800]whether modelers, project managers, or third parties,
[00:02:47.240]such as consultants or JV partners,
[00:02:49.670]need to have access to the latest data
[00:02:51.880]in as near real time as possible.
[00:02:55.040]Everyone needs to work from a single source of truth
[00:02:58.260]to ensure robust analytical results that allow you
[00:03:01.560]to take the next steps in the development of your project.
[00:03:05.300]However, more often than not, the data landscape
[00:03:08.640]looks something like the image we see in front of us,
[00:03:11.790]that is data is scattered over multiple servers,
[00:03:14.780]external hard drives, computers, and even people’s minds.
[00:03:19.349]This is a problem as vital information is inaccessible
[00:03:23.170]when needed or only available in a format
[00:03:25.990]that doesn’t suit the needs of the modeler.
[00:03:28.730]In a situation such as this,
[00:03:30.310]the modeling process is highly ineffective
[00:03:33.250]and overall productivity suffers.
[00:03:35.880]Time and money is lost.
[00:03:39.480]So how can we make sure that our team is truly connected
[00:03:43.230]to build an up-to-date and robust holistic model?
[00:03:47.200]Here’s the ideal case scenario.
[00:03:49.490]For example, all data needs to be consistently accessible
[00:03:53.510]no matter where the stakeholders are.
[00:03:56.020]Particularly in today’s work environment during COVID-19,
[00:03:59.630]this aspect is more important than ever.
[00:04:02.550]The data needs to exist in a singular place.
[00:04:06.500]To build that perfect holistic model,
[00:04:08.420]we also need to understand the data contextually.
[00:04:12.050]Each geoscientific group views
[00:04:13.970]and utilizes raw data differently
[00:04:16.400]and need to be able to trace data
[00:04:18.490]from the origin throughout its transformation process.
[00:04:22.370]And finally, every stakeholder needs to have access
[00:04:25.310]to the team, that is to each other’s thought processes
[00:04:28.580]and expertise to collaboratively analyze
[00:04:32.080]and iteratively refine the holistic model
[00:04:34.680]and then take the next steps together.
[00:04:37.710]Through Central, all project stakeholders,
[00:04:40.140]whether they’re active modelers, reviewers, or third parties
[00:04:43.990]have access to the latest information and intelligence
[00:04:47.770]to inform the next steps in the modeling
[00:04:50.070]and/or decision-making process.
[00:04:52.710]The key to Central is that it provides the means
[00:04:55.330]to work efficiently and productively
[00:04:58.840]in a multifaceted and multidisciplinary team
[00:05:02.840]to arrive collaboratively at a robust model.
[00:05:07.160]So let’s review Central’s key features
[00:05:09.520]from data repository to live notifications
[00:05:13.330]and learn how the system allows you to flexibly structure
[00:05:17.230]and organize your team’s collaborative workflows
[00:05:20.280]at any stage of the project.
[00:05:23.210]Okay, let me tell you a little bit more
[00:05:25.810]about the technology in the background.
[00:05:28.150]Central is a cloud-hosted system
[00:05:30.400]that stores and version tracks your Leapfrog models
[00:05:33.630]and all project-related data no matter its origin
[00:05:37.130]to build a reliable and auditable repository all the time.
[00:05:42.220]Central allows you to navigate and interact with your data
[00:05:45.580]through two different gateways.
[00:05:47.500]The first is the Central Portal that contains a data room
[00:05:51.230]as well as microservices,
[00:05:52.960]such as notification and web visualization.
[00:05:56.950]The second are your Seequent modeling products
[00:06:00.020]such as Leapfrog Suite and Oasis montaj.
[00:06:04.090]So let’s learn how the data flows through the gateways
[00:06:07.670]and enables you and your team to collaboratively work
[00:06:12.010]from a single source of truth in real time.
[00:06:15.260]To do so, let’s imagine a real life scenario.
[00:06:19.810]Imagine the following.
[00:06:21.530]You start your day and the first thing you’ll likely do
[00:06:24.080]after you pour yourself a cup of coffee
[00:06:26.010]is to turn on the computer to check your emails.
[00:06:28.620]In other words, you start communicating, networking,
[00:06:31.860]and immersing yourself in the interactive exchange
[00:06:34.770]of information that will shape your day, weeks,
[00:06:38.000]and months to come.
[00:06:40.230]Let’s say you find an email in your inbox that asks you
[00:06:43.000]to review a Drupal problem at one of the sites
[00:06:45.180]that you supervise or work on.
[00:06:47.560]At this point in time,
[00:06:49.170]you’ll probably shelf the request for later in the day
[00:06:52.330]as it involves opening the modeling software,
[00:06:55.080]finding the right spot in the project,
[00:06:56.940]understanding the context of the issue,
[00:06:59.270]and then search for the correct 3D location
[00:07:02.060]to address the problem at hand.
[00:07:04.170]Now, what if the original email contained a link
[00:07:09.050]that allows you to access the model
[00:07:11.340]and unfolding conversation with one simple click
[00:07:15.360]without having to go through the painstaking journey
[00:07:17.610]I just described?
[00:07:19.310]Literally with one click, you’ll be at the center of it
[00:07:22.810]and can start making decisions right here and now
[00:07:25.930]saving time and progressing the project.
[00:07:29.000]Okay, so let’s do it.
[00:07:31.040]Let’s click on the link.
[00:07:37.340]And here we are in the Central Portal
[00:07:39.780]and right away in the middle of the conversation.
[00:07:43.140]As you can see, it not only provided the deep link access
[00:07:47.040]to our web visualization service,
[00:07:50.220]but opened up the relevant 3D model and comment
[00:07:53.500]that was prepared for your review.
[00:07:55.910]By being able to interactively visualize your project
[00:07:59.300]in the cloud allows you and your key contributors
[00:08:02.270]to gain the same perspective of current ideas, challenges,
[00:08:06.160]and the next steps ahead.
[00:08:08.260]It also provides you with a great opportunity
[00:08:10.350]to invite stakeholders with little
[00:08:12.480]to no technical experience to the round table.
[00:08:15.760]No prior knowledge of the software is required,
[00:08:18.240]or even a software download,
[00:08:20.100]making it easy to partake in the conversation.
[00:08:23.640]All objects are visible in the scene view
[00:08:26.150]were loaded within seconds
[00:08:27.710]and can now be navigated and reviewed
[00:08:29.940]through the intuitive toolbox.
[00:08:32.140]If you’re a veteran Leapfrog user,
[00:08:33.800]you’ll be very familiar with the terminology, layout,
[00:08:36.740]and general functionality.
[00:08:38.790]But even if not, the interface is easy to navigate.
[00:08:42.520]So how is it done?
[00:08:44.320]Use your mouse to rotate the objects and zoom in and out,
[00:08:48.130]or if you prefer, set a particular viewing angle
[00:08:51.090]by clicking on useful hotkeys
[00:08:52.720]such as E for east, S for south,
[00:08:55.760]or D for down or plan view, et cetera.
[00:08:59.190]Return to the original view by clicking on the 3D scene
[00:09:02.950]provided in the comments.
[00:09:05.040]Add more model components by navigating to the project tree
[00:09:09.110]on the left-hand side and click on the plus button
[00:09:12.200]next to the object of interest.
[00:09:14.660]Now, to change the object’s appearance
[00:09:17.370]or the visual information provided in the scene view,
[00:09:20.440]first click on the object itself in the objects tab,
[00:09:24.360]in this case the drill holes,
[00:09:26.340]and modify their shape, add text, a legend, et cetera.
[00:09:32.660]Refine the object’s appearance
[00:09:34.920]by making changes in the properties tab
[00:09:36.900]which open automatically.
[00:09:39.090]If you wish, you can dock these tabs to the right-hand side
[00:09:42.220]to tidy up your window
[00:09:43.640]and go ahead and change the object attribute’s color map
[00:09:47.840]or filter the visual data.
[00:09:50.640]If you prefer a section view,
[00:09:52.550]you can also interrogate your model from the 2D perspective
[00:09:55.770]by using the slicing tool.
[00:09:57.670]Just click on the slicer icon, define a section slice
[00:10:01.130]and view or step through a specific portion of the model.
[00:10:05.620]If you have a particular location in mind,
[00:10:07.950]you can hinge the slicer on a specific XYZ coordinate
[00:10:11.460]and modify the depth and azimuth according to your needs.
[00:10:15.780]If you wish to observe a different version of the model
[00:10:18.890]to follow the overall progress of changes applied,
[00:10:21.910]then you can choose a different revision
[00:10:23.780]right here in the scene.
[00:10:25.830]Click on the top bar above the project tree
[00:10:28.140]and choose a new ID
[00:10:29.670]based on the project stage or date published.
[00:10:34.660]Once you feel ready to add your expertise
[00:10:37.180]to the conversation, leave a comment or reply for your team.
[00:10:41.860]Choose the scene view of your choice to create a 3D view,
[00:10:45.140]which will be reflected in the thumbnail,
[00:10:47.210]add a geo tag and write a comment.
[00:10:50.410]When it comes to comments and annotations,
[00:10:52.710]think outside the box.
[00:10:54.630]Not only can you progress an important conversation,
[00:10:57.520]but also set up weekly reporting structures,
[00:11:00.370]add the latest drill hole updates or quick logs,
[00:11:02.640]and record much more.
[00:11:04.750]All this information usually provided
[00:11:07.150]in tough to track emails, Word documents,
[00:11:09.670]and PDFs can be logged here and creates a permanent
[00:11:13.470]and navigable record of important decisions made.
[00:11:17.930]All comments and 3D thumbnails
[00:11:19.870]also pass through the desktop applications and vice versa,
[00:11:23.420]which surely allows for great collaborative workflow
[00:11:25.920]between reviewers and active modelers.
[00:11:29.400]I will show you an example of this option later on
[00:11:31.640]when we have a look at the Central functions in Leapfrog.
[00:11:35.390]If you wish to address somebody in your team directly,
[00:11:38.470]you can do so by creating an @ mention.
[00:11:41.860]This is how they reach out to us as well.
[00:11:44.640]As soon as you finalize your comments to your colleague,
[00:11:47.430]he or she will be notified in real time,
[00:11:50.150]either in app or through an in-app.
[00:11:52.640]And this is key.
[00:11:54.190]Communication is instant and allows the whole team
[00:11:57.130]to interact when it matters the most.
[00:12:01.080]There’s another option on how to invite
[00:12:02.870]an existing Central user to observe your project.
[00:12:06.210]Simply copy the address line in your web browser
[00:12:09.000]and you’ll automatically create a deep link
[00:12:11.530]you can place either in an email or a report.
[00:12:14.870]Both the deep link and @ mention options
[00:12:17.820]are designed to save time
[00:12:19.530]and make sure that a 3D conversation is succinct
[00:12:22.350]and to the point.
[00:12:24.350]This is essential,
[00:12:25.300]particularly when communicating with a busy supervisor
[00:12:28.350]or even a non-technical C-level executive.
[00:12:31.820]Busy people just don’t have the time of the day to download
[00:12:35.310]and learn how to navigate a new software.
[00:12:38.160]Imagine budget time
[00:12:39.250]when you’re given a minimum amount of time,
[00:12:41.330]that usually feels like about five minutes or less,
[00:12:44.130]to justify why the board should give you $10 million
[00:12:48.460]rather than to somebody else.
[00:12:50.840]A big roll of sections and huge report
[00:12:53.350]may not cut it at that point.
[00:12:56.370]By sending the execs a link or an @ mention,
[00:12:59.690]you can include them directly in the conversation,
[00:13:02.900]paint a clear picture of your needs
[00:13:04.950]and have decisions being made right there on the spot.
[00:13:09.130]You can even use the web visualization option
[00:13:12.000]as an active presentation tool right in your meeting
[00:13:15.500]whether it’s with your supervisors, your team,
[00:13:17.870]or even the public.
[00:13:20.570]Another important aspect of their notification service
[00:13:23.520]is that it can be completely customized
[00:13:26.210]to maintain a streamlined flow of information.
[00:13:29.420]Nobody wants to get even more emails than they already do.
[00:13:33.280]As such, you can decide which projects to subscribe to
[00:13:37.820]and which information to receive
[00:13:40.110]regarding global discussions
[00:13:42.230]or specific project notifications,
[00:13:44.450]such as when new revisions, branches,
[00:13:47.530]or comments were added.
[00:13:49.983]You can also choose whether you prefer an email
[00:13:52.270]or an in-app notification, or both.
[00:13:55.880]Okay, let’s have a look at the other functionality
[00:13:59.170]in the Central Portal.
[00:14:00.950]The portal as easily accessed
[00:14:02.580]through any of your standard web browsers
[00:14:04.570]and represents the digital access point
[00:14:07.060]to your geoscience data and network.
[00:14:11.430]Here we are at the project overview page.
[00:14:14.510]When entering, you are presented
[00:14:16.060]with a customized view of tabs and projects
[00:14:19.850]that relate specifically to you.
[00:14:22.720]Based on your and your company’s needs,
[00:14:25.300]a dedicated Central administrator
[00:14:27.430]can create a personalized profile for each user
[00:14:30.850]that interacts with the geoscientific data stored.
[00:14:33.630]So for example, if you invite third parties to the table,
[00:14:37.350]such as JV partners and consultants,
[00:14:40.110]you can be rest assured that a unique permission setting
[00:14:43.030]will let them see only what they’re supposed to see.
[00:14:46.590]That way, you can engage in a safe exchange of information
[00:14:50.010]between all project stakeholders.
[00:14:53.160]As you can see, I have access to quite a few projects.
[00:14:56.820]Each Central project could be considered a placeholder
[00:14:59.830]that may contain the model history of a full mine site,
[00:15:03.370]a single zone, or satellite deposit,
[00:15:06.330]or even an experimental project.
[00:15:09.190]You can build as many Central projects as you like,
[00:15:12.330]depending on how you wish to structure
[00:15:14.250]and organize your overall assets data.
[00:15:17.640]Let’s have a look at an example or two
[00:15:20.120]that provide the backdrop for our demo today.
[00:15:23.980]And here we are on the overview page
[00:15:26.310]for the project Leader Exploration
[00:15:28.890]where the project stakeholders can gain a quick
[00:15:31.930]and direct insight into the current status of the project,
[00:15:35.420]such as the recent modeling history here in the center
[00:15:38.210]and user activity to the right.
[00:15:41.280]Should you require more detail,
[00:15:42.950]the complete set of information can be accessed
[00:15:45.700]through the tabs at the top.
[00:15:48.060]Let’s start by observing the history of the project.
[00:15:52.680]In Central, an active modeler
[00:15:54.710]can preserve the complete history of a project.
[00:15:57.540]This is visualized here in the form of a version tree
[00:16:00.560]whereby each node represents a model upload.
[00:16:04.340]Each node is outfitted with relevant metadata,
[00:16:07.370]such as the date, the modeler, and most importantly,
[00:16:10.490]a succinct comment that identifies why the model revision
[00:16:14.160]was uploaded in the first place.
[00:16:17.100]This setup makes it very easy to navigate through time
[00:16:20.490]and understand why certain decisions were made.
[00:16:24.280]If you wish to review the various revisions in the cloud,
[00:16:28.040]simply click on the ID or thumbnail image here and here
[00:16:33.010]to instantly visualize the associated 3D model on the web.
[00:16:37.900]To remove revisions and organize your data,
[00:16:40.500]you can utilize the deletion button right here.
[00:16:44.450]You also notice various colored branches
[00:16:47.030]making up the temporal version tree.
[00:16:50.370]Central was designed to allow multidisciplinary teams
[00:16:54.150]to work together and share the load.
[00:16:57.500]Each branch represents an ultimate workspace
[00:17:00.640]where a particular aspect of your master model
[00:17:03.700]can be developed separately.
[00:17:06.460]This could refer to an experimental interpretation
[00:17:09.690]of part of the geology or a specialized aspect,
[00:17:13.640]such as structure, geochemistry, or resource estimation.
[00:17:18.140]The advantage of these spinoff models
[00:17:21.090]is that they are commonly smaller in size
[00:17:23.760]and allow for faster interpretation of the subject matter.
[00:17:28.330]Once peer reviewed by all necessary stakeholders,
[00:17:31.620]they can then be placed back into the master model.
[00:17:35.010]The peer review process in itself can also be recorded
[00:17:38.510]through the application of stage labels.
[00:17:41.640]These labels are completely customizable
[00:17:44.090]to fit your team’s common approval process
[00:17:46.680]and terminology applied.
[00:17:49.020]When used rigorously, this process can greatly improve
[00:17:52.840]the auditability of a project.
[00:17:57.170]A true holistic model needs to take into account
[00:18:00.060]all project-specific data no matter its origin
[00:18:03.630]to deliver robust foundation for further decision-making.
[00:18:07.450]As such, it is essential for teams
[00:18:09.770]to have access to the latest data
[00:18:12.030]and be able to leverage off each other’s work and knowledge.
[00:18:17.450]The Central data room is the first stop
[00:18:19.940]for project-specific data collection, so let’s have a look.
[00:18:23.730]Let’s click here on the files tab.
[00:18:27.440]In the data room, you can build a custom folder structure
[00:18:30.380]that allows you and your team to organize
[00:18:33.090]and version control any primary project data
[00:18:36.770]whether fresh from the field or historic in nature.
[00:18:40.420]This type of data provides the foundation
[00:18:42.730]for a 3D interpretation of the geology.
[00:18:47.250]Another unique aspect of the data room
[00:18:49.780]is that it not only stores and version tracks files
[00:18:53.060]from various GIS or geological modeling software,
[00:18:56.920]the data room also dynamically connects
[00:18:59.700]to the Leapfrog Suite, as well as Oasis montaj,
[00:19:03.610]our premiere geophysical modeling solution,
[00:19:06.370]and allows for files to be linked and actively consumed.
[00:19:11.400]Now, what does that exactly mean?
[00:19:14.530]To support and nurture collaboration
[00:19:17.490]between multidisciplinary groups,
[00:19:20.380]Seequent has begun to integrate Oasis montaj with Central.
[00:19:25.750]Phase one of this integration is now complete
[00:19:28.510]and allows for a direct file upload
[00:19:30.620]from the modeling software into the data room environment.
[00:19:34.360]Let’s have a look what that process entails.
[00:19:38.190]And here we are in an Oasis montaj project
[00:19:40.613]that contains a variety of grids, voxels,
[00:19:42.870]and geoservices to be uploaded to Central.
[00:19:46.950]First, click on the cloud icon to connect to Central.
[00:19:50.210]Choose from the list of service available
[00:19:52.280]to you and connect.
[00:19:54.510]You can accept the terms of service
[00:19:56.241]right here in the software.
[00:19:57.590]And once done, you are then connected to Central
[00:20:00.300]as indicated by the green cloud icon.
[00:20:03.500]There are several different avenues available to you
[00:20:05.990]for file upload to the data room.
[00:20:08.140]For example, I can right-click on the file of interest,
[00:20:11.270]in this case a grid, and choose to upload to Central.
[00:20:15.150]An upload menu appears.
[00:20:16.730]Here, the chosen file format defaults to OMF.
[00:20:20.900]The coordinate system is automatically detected,
[00:20:23.720]but it can be altered
[00:20:24.740]should you have the correct information at hand.
[00:20:27.430]All files are then checked
[00:20:28.950]against the chosen coordinate system,
[00:20:30.860]and the yellow flag will highlight
[00:20:32.360]in case a discrepancy was detected.
[00:20:35.440]You could then choose the specific files you require
[00:20:38.120]for upload either as an old math,
[00:20:40.020]which allows you to bring in 2D and 3D geoservices,
[00:20:44.040]or grids and boxes only.
[00:20:46.240]In this example, this is what we’ll do and publish the files
[00:20:49.620]to their corresponding project on the Central server.
[00:20:55.930]An alternative method to upload to the Central server
[00:20:59.160]is by clicking on the data services menu.
[00:21:01.970]Here, click on upload to Central.
[00:21:05.200]In the corresponding menu,
[00:21:06.770]I will select a few files to then be published in OMF format
[00:21:10.560]and call them data products.
[00:21:13.060]Should you be working with a grid with variable cell size,
[00:21:16.500]you can choose to re-sample your voxels
[00:21:19.160]to a single cell size,
[00:21:20.770]or use the calculate button which will then produce a value
[00:21:24.740]representative of the smallest detectable cell size.
[00:21:29.140]In addition, should your grid have a specific rotation
[00:21:32.260]that requires alteration prior to the upload
[00:21:34.970]to the modeling software,
[00:21:36.600]you can remove the rotation if needed,
[00:21:39.000]then click OK and the files are published
[00:21:41.280]to the Central project.
[00:21:43.430]To observe the files in the data room,
[00:21:45.890]you can return to the data services tab
[00:21:48.240]and choose the option Central Portal.
[00:21:51.090]You are then directed to your web browser
[00:21:53.340]and portals project page.
[00:21:55.470]Now choose the project of interest,
[00:21:57.420]navigate to the files tab and find the grids, voxels,
[00:22:01.079]and OMF files previously published.
[00:22:04.480]If in the later modeling process
[00:22:06.560]an updated file becomes available,
[00:22:08.800]then simply load again from Oasis montaj
[00:22:11.330]and Central will begin to version track
[00:22:13.320]the individual files.
[00:22:15.100]This makes it easy for you and your team
[00:22:17.610]to always choose the latest one
[00:22:19.970]without having to name the file something along the lines
[00:22:22.610]of final, final, final version number two.
[00:22:26.810]Now, when I say choose a file,
[00:22:29.140]I do not refer to the tedious exporting of the file
[00:22:32.630]and reimport into the Leapfrog modeling application.
[00:22:36.560]Central provides a much more elegant solution
[00:22:39.760]that saves time and dramatically reduces the issue
[00:22:43.240]of choosing the wrong revision.
[00:22:46.460]What differentiates Central dramatically
[00:22:49.150]from other version tracking programs
[00:22:51.020]is the ability to access stored files and objects
[00:22:55.440]both from the data room,
[00:22:57.040]as well as previously published Leapfrog models,
[00:23:00.350]and dynamically link them
[00:23:02.430]into your current geological model.
[00:23:05.650]In Leapfrog, all you have to do is to select
[00:23:08.240]a supported file type, load it directly into your model,
[00:23:12.480]and start incorporating the information
[00:23:14.930]in your current geological interpretation.
[00:23:18.570]As soon as a new revision is published by your colleagues,
[00:23:21.670]you’ll be notified and have the option
[00:23:23.690]to instantly refresh the file or object
[00:23:26.990]through the dynamic link,
[00:23:28.590]thus updating your interpretation on the spot.
[00:23:32.400]This capability is called object and file integration
[00:23:36.880]and sits at the heart of many multimodal workflows
[00:23:40.470]that bring your team together, break down barriers,
[00:23:43.610]and allow for a transparent and uninhabited flow of data
[00:23:47.880]to create that perfect holistic master model.
[00:23:52.320]Workflows based on this capability
[00:23:54.750]operate by the idea to share the load
[00:23:57.620]by dividing up the projects into smaller portions
[00:24:01.560]that focus on a specific component of the overall model.
[00:24:05.870]This can refer to a physical location or zone,
[00:24:09.470]or an experimental version of the project,
[00:24:12.580]but also specific aspects of the geology
[00:24:14.980]such as structure, geochemistry, or resource modeling
[00:24:18.770]that is carried out by a specialist.
[00:24:21.640]Through this division, the projects are kept small,
[00:24:24.780]they’re run faster,
[00:24:26.250]and once peer reviewed via an in-app comment,
[00:24:30.010]they can then be integrated
[00:24:31.630]into a representative master model
[00:24:34.460]to provide the complete picture
[00:24:36.590]without having to rebuild the lot.
[00:24:39.520]Let’s have a look at a few examples of common workflows
[00:24:42.820]made possible through object and file integration.
[00:24:47.940]And here we are in Leapfrog Geo,
[00:24:50.270]our prime geological modeling application.
[00:24:53.180]If you’ve used Leapfrog before,
[00:24:55.070]you will notice how the interface has changed
[00:24:57.360]in overall appearance, which is now much more in tandem
[00:25:00.880]with the remaining Central applications
[00:25:03.130]to provide you with a more seamless user experience.
[00:25:06.410]Now, if you are in the process of developing
[00:25:09.270]a new 3D model of your project,
[00:25:11.630]you can begin by importing your drawer tables
[00:25:14.680]directly from the data room.
[00:25:17.440]The importing process is equivalent to what you’re used to
[00:25:20.880]when introducing basic CSV sheets into Leapfrog,
[00:25:24.010]with the exception that your Drupal database
[00:25:26.490]is now dynamically linked to Central
[00:25:29.880]as symbolized with this little C icon.
[00:25:33.770]Other data tables that can be introduced
[00:25:35.950]through the data room relate to points
[00:25:38.260]and planar structural data.
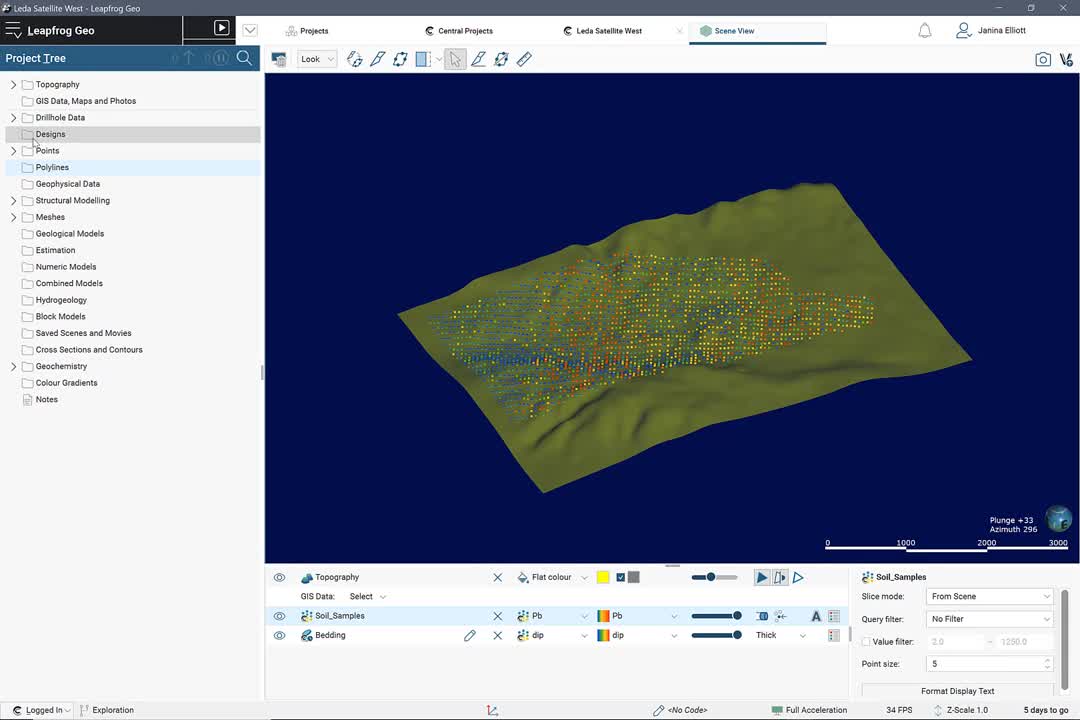
[00:25:40.280]So if you’re carrying out
[00:25:42.110]a geochemical soil sampling campaign
[00:25:44.820]or collect other attributed XYZ point information,
[00:25:48.650]consider linking your data directly from the data room.
[00:25:53.060]As soon as new information arrives,
[00:25:54.980]whether it is drilling, mapping information and more,
[00:25:58.440]you and your team utilizing
[00:26:00.230]the same version controlled information will be notified
[00:26:03.390]simultaneously through a small clock symbol.
[00:26:07.300]That way, nobody will ever miss out
[00:26:09.730]when it is time to refresh
[00:26:11.310]and everyone works from the same source of truth.
[00:26:15.720]All you need to do is right-click on the drill holes
[00:26:18.500]or table in question and choose reload latest file version.
[00:26:24.060]In addition, you also have an option
[00:26:26.330]for appending new data rows and adding data columns.
[00:26:30.720]And of course, at every step of the way,
[00:26:33.380]you can ensure quality control
[00:26:35.680]by utilizing the error reports
[00:26:37.420]and cleanup functionality in Leapfrog.
[00:26:41.040]Interoperability has always been a core capability
[00:26:44.670]of Seequent’s modeling products.
[00:26:46.160]And as such, the Central data room also offers
[00:26:49.400]the integration of polylines and meshes
[00:26:52.580]derived from a variety of alternate software packages.
[00:26:55.950]And of course, geophysical data developed in Oasis montaj
[00:26:59.830]as shown early on.
[00:27:02.962]Okay, let’s switch to our established leader project
[00:27:06.860]and explore what workflows have been implemented
[00:27:09.380]by the team over time.
[00:27:11.990]Once we enter a Central project
[00:27:13.980]through the leapfrog application and personal Seequent ID,
[00:27:17.670]we are presented with the entire
[00:27:19.710]version history of the project.
[00:27:22.400]This includes not only relevant publication details,
[00:27:25.630]but also associated 3D thumbnails and geo tags,
[00:27:29.093]as well as the complete commentary.
[00:27:32.400]As such, you can easily access revision of interest,
[00:27:35.900]navigate directly to the appropriate XYZ point
[00:27:39.640]and objects of interest,
[00:27:41.690]and respond to an unfolding conversation
[00:27:44.260]to keep your team up to date.
[00:27:47.410]As you can see here in the history tree,
[00:27:49.900]this project is a great example
[00:27:52.100]how a team has progressed more quickly and efficiently
[00:27:56.190]by dividing the model into two main zones,
[00:27:59.510]the upper and lower MS.
[00:28:02.500]While each zone is modeled separately,
[00:28:05.270]the adjacent geological interpretation
[00:28:07.540]is constantly discussed and being taken into account
[00:28:11.660]when making major decisions.
[00:28:14.110]Relevant data at or across the project boundary
[00:28:17.950]are also actively incorporated
[00:28:20.580]to build a complete regional picture.
[00:28:23.880]Now, this is where Central’s
[00:28:25.530]object sharing function comes in.
[00:28:28.040]The fault that acts as a boundary between the two zones
[00:28:32.100]is a fantastic example.
[00:28:34.120]Being developed in the master project,
[00:28:36.930]each zone is actively linked to the fault boundary
[00:28:40.590]and receives consistent updates.
[00:28:46.100]The master model retains a complete version
[00:28:48.530]of the site model by pulling in the active geological models
[00:28:52.700]from either zone.
[00:28:54.670]How has it done?
[00:28:56.070]Just right-click on the geological models folder
[00:28:59.100]and import a geological model from Central.
[00:29:03.300]The result is a model that comprises
[00:29:05.650]all of the essential components of a geological model,
[00:29:08.790]as well as lithological coding.
[00:29:10.900]And while appearing static
[00:29:12.980]through the dynamic link to Central,
[00:29:14.730]it remains always up-to-date.
[00:29:18.130]The integration of four geological models
[00:29:20.620]is a great milestone as it holds so much potential
[00:29:24.500]for advanced workflows.
[00:29:26.570]For example, the imported geological model can be utilized
[00:29:30.610]as the foundation for further analysis,
[00:29:33.790]such as resource estimation in Edge.
[00:29:36.880]You can easily choose any of the coded lithological domains
[00:29:40.320]and run a life estimation.
[00:29:42.930]Rather than having to wait for let’s say
[00:29:45.610]a biannual update of the domains,
[00:29:47.890]we just have to trust that the meshes or wireframes provided
[00:29:51.320]are correct and up to date,
[00:29:53.410]you can now be part of the process.
[00:29:56.140]You can explore multiple interpretations
[00:29:58.990]as soon as new data becomes available
[00:30:01.570]and automatically transfer lithological and numeric data
[00:30:05.290]into a dynamically linked block model.
[00:30:09.150]This is truly a game changer
[00:30:11.180]that makes the estimation process faster, more efficient,
[00:30:14.950]and overall safer as the geology is actively considered
[00:30:19.580]at every step of the way.
[00:30:23.030]Okay, let’s get back to the project and imagine
[00:30:26.480]that you have updated your project interpretation
[00:30:28.920]and are ready to publish your new revision to Central.
[00:30:32.910]At this point,
[00:30:33.820]all you need is an active internet connection.
[00:30:36.930]Now, some of you may worry that your local bandwidth
[00:30:40.240]is too low to deal with large multi-gigabyte projects.
[00:30:45.060]The good news is that we have built in the technology
[00:30:47.860]to deal with this exact issue.
[00:30:51.150]Once you’ve published your base project,
[00:30:53.610]every subsequent publication will take into account
[00:30:57.210]the data that is already loaded onto the server.
[00:31:01.050]Hence, only the incremental changes
[00:31:03.520]or the delta is uploaded.
[00:31:06.640]The same occurs on a download.
[00:31:08.780]Central will automatically recognize
[00:31:11.030]whether your dedicated project folder holds a previous copy
[00:31:15.210]and downloads only the necessary files
[00:31:18.150]saving you time and essential disk space.
[00:31:22.170]So even if you’re way out in the middle of nowhere
[00:31:25.560]and a satellite connection is your only means to connect,
[00:31:29.070]you’ll be okay, especially as Central will make sure
[00:31:32.570]to remember and resume your publication or download
[00:31:35.920]should your connection be interrupted.
[00:31:38.880]Now, as mentioned earlier,
[00:31:40.760]these were just a few workflow examples
[00:31:43.170]derived from Central’s capability
[00:31:45.550]for object and file integration
[00:31:47.800]supported by an instant notification and more.
[00:31:50.980]Now it is up to you to be creative.
[00:31:53.780]There are exponential possibilities
[00:31:56.030]in how data can be shared and leveraged
[00:31:59.140]to develop a truly fluid workflow
[00:32:01.760]that involves every geoscientific group
[00:32:04.300]and provides them with insight, real-time updates,
[00:32:08.030]and the freedom to truly think about the geology
[00:32:11.600]rather than just data management.
[00:32:14.470]We at Seequent cannot wait to hear from you
[00:32:16.930]about your new workflows
[00:32:18.510]that assist in your team working as a unit,
[00:32:21.540]making robust decisions together.
[00:32:25.940]While technically not the end of my feature description,
[00:32:29.180]this is where I’ll bring you to a close.
[00:32:31.490]So in summary, what is Central?
[00:32:34.650]Central 4 is your team’s shared workspace
[00:32:37.560]that ties in Seequent’s desktop applications
[00:32:40.510]and cloud-specific microservices,
[00:32:43.150]such as web visualization and notifications
[00:32:46.500]to connect everyone involved.
[00:32:49.250]As a shared workspace, Central can be relied upon
[00:32:52.480]wherever you are in the world,
[00:32:54.490]whether you are modeler or non-technical stakeholders,
[00:32:58.250]share the one view, discuss and test scenarios,
[00:33:01.990]and make confident decisions together about your projects.
[00:33:06.020]Central is more than a cloud solution
[00:33:08.190]for data and model management needs.
[00:33:10.540]It helps you to make projects more accessible, shareable,
[00:33:14.350]and collaborative in order to solve complex problems,
[00:33:18.390]manage risk, and make better decisions
[00:33:21.290]across the lifecycle of projects
[00:33:23.480]to ultimately step from complexity to clarity.
[00:33:28.770]Have we spiked your interest?
[00:33:30.990]If you happen to be a Leapfrog user,
[00:33:33.070]but haven’t experienced Central before,
[00:33:35.630]then simply navigate to your project page
[00:33:38.250]and click on Activate Trial Now
[00:33:40.800]to request access to a Central instance.
[00:33:44.180]Alternatively, please feel free to contact
[00:33:46.570]your personal account manager
[00:33:48.360]or one of your local sales representatives at any time.
[00:33:52.060]Our regional contact information
[00:33:53.980]and much much more is available on myseequent.com.
[00:34:00.040]Before we close though, let’s hear it from you.
[00:34:03.500]I noticed that there were a few interesting questions
[00:34:05.930]that popped up during the webinar,
[00:34:07.450]and I would love to address a few of them
[00:34:09.440]in the remaining time that we have.
[00:34:11.840]So a few people asked,
[00:34:13.510]can I share a web visualization link
[00:34:16.710]outside my organization?
[00:34:18.800]Now, that’s a really good question.
[00:34:20.610]At this time, you will have to invite the person
[00:34:23.680]outside of your organization to become a Central user
[00:34:26.910]on your instance and set the appropriate permissions,
[00:34:30.940]then you can send links and @ mentions freely.
[00:34:35.640]Another question that came up a few times is,
[00:34:38.560]what are the size limitations with web visualization?
[00:34:43.084]Basically there aren’t any.
[00:34:45.090]The information you see is loaded directly
[00:34:48.450]from your stored models.
[00:34:50.330]So once you click on an object you wish to see,
[00:34:52.880]it will access the information on the server,
[00:34:55.700]load the object progressively and cache it,
[00:34:59.150]which means that you all need to go through
[00:35:00.770]the upload process once.
[00:35:03.040]Of course, large textures, images, and sizable block models
[00:35:08.040]may take some time to load.
[00:35:11.160]Another interesting question,
[00:35:12.930]and that’s the last one I’m looking at here,
[00:35:15.030]was asked by several participants.
[00:35:17.610]It says now that Seequent develops
[00:35:20.030]and maintain services in the cloud,
[00:35:22.320]does that mean that upgrades happen more frequently?
[00:35:25.610]Yes, that’s absolutely right.
[00:35:27.520]One of the reasons we’re shifting to cloud development
[00:35:30.550]is that we can give our clients and customers
[00:35:32.750]a more seamless experience.
[00:35:35.240]Once the development piece has landed,
[00:35:37.460]we can bring the new feature online without interruptions
[00:35:40.460]and without having to wait for another upgrade cycle
[00:35:42.980]connected to the desktop software.
[00:35:45.930]Okay, well, thank you very much for taking the time today
[00:35:50.000]and please stay on the line to take part in a short survey.
[00:35:53.600]Thanks again and we’ll see you next time.