search

Workbench views

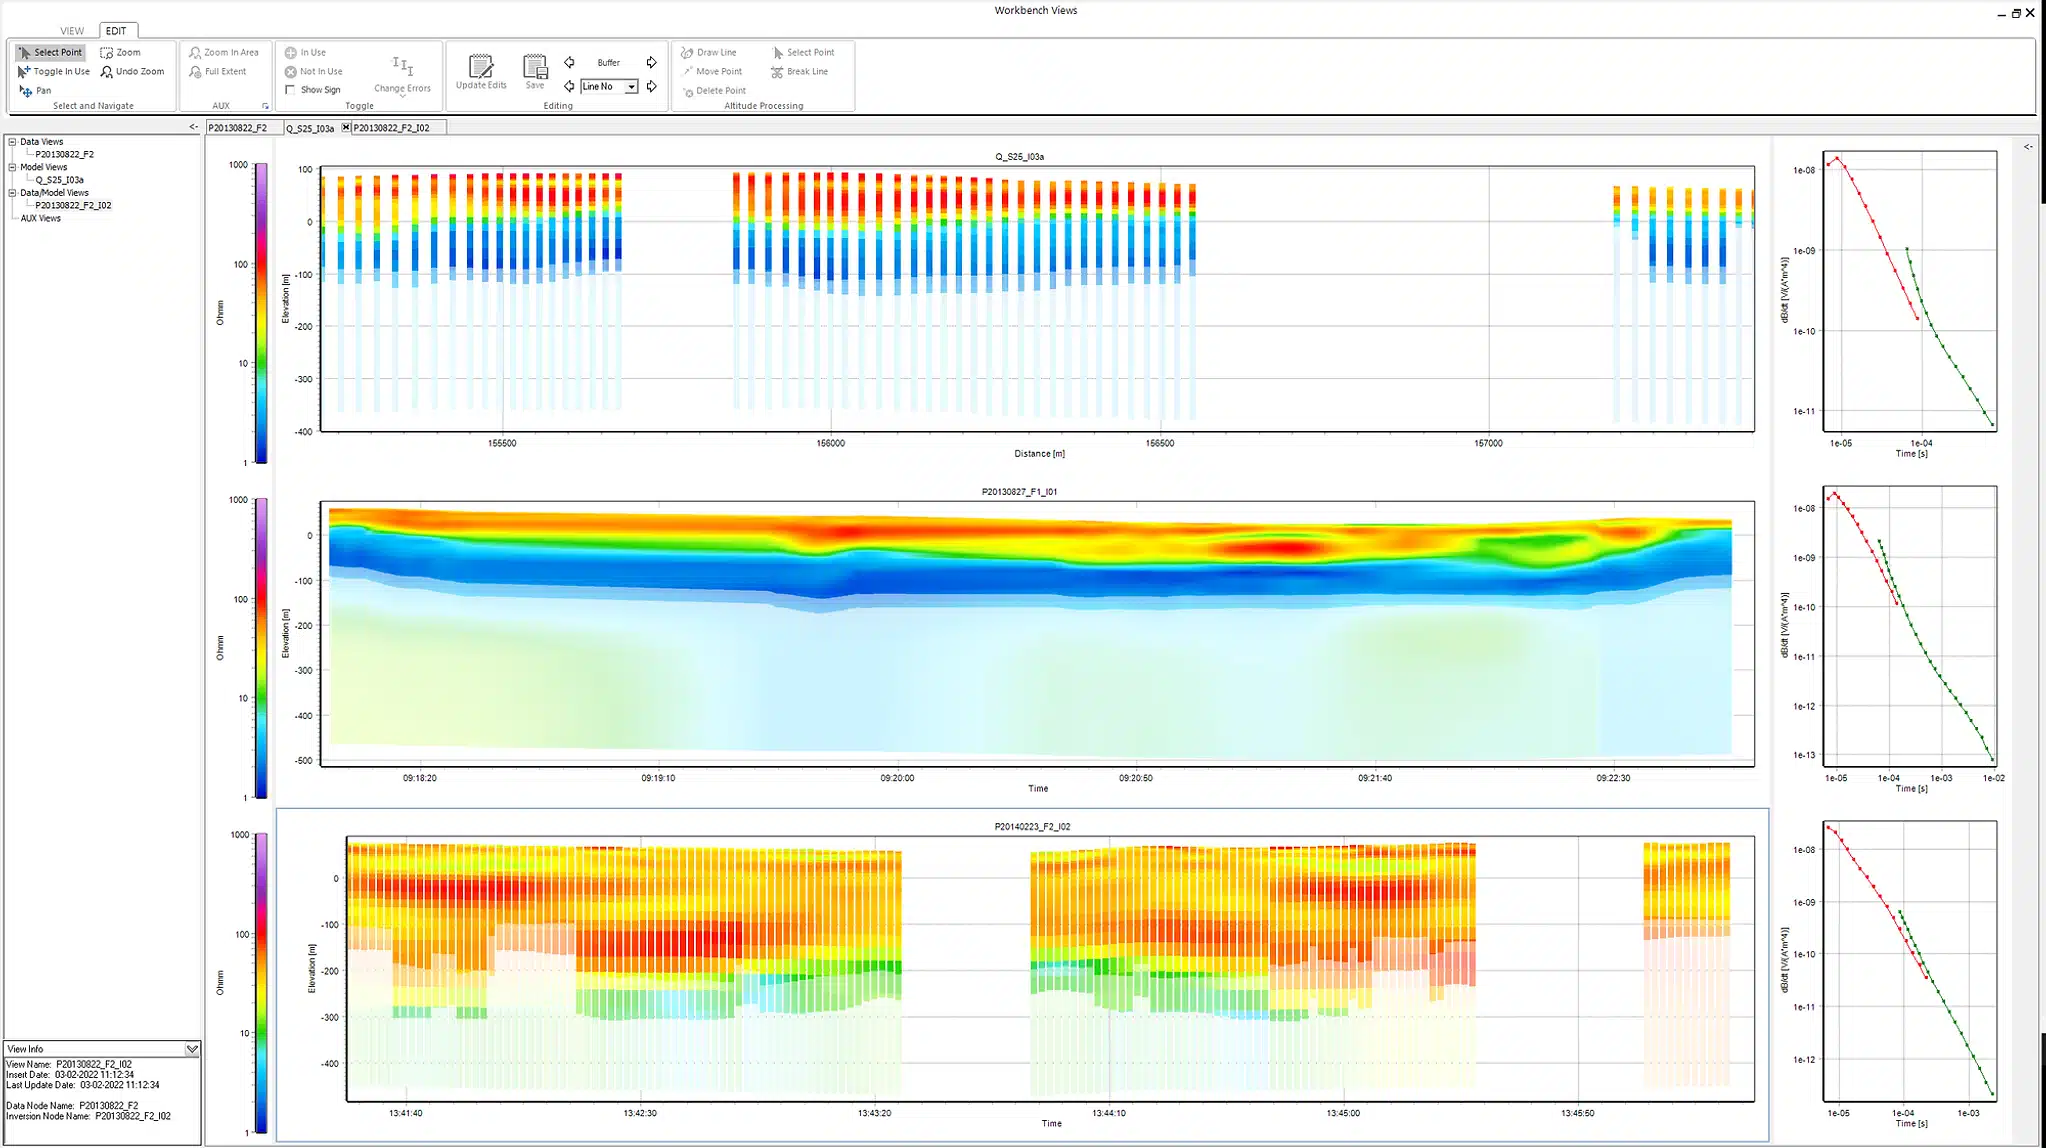
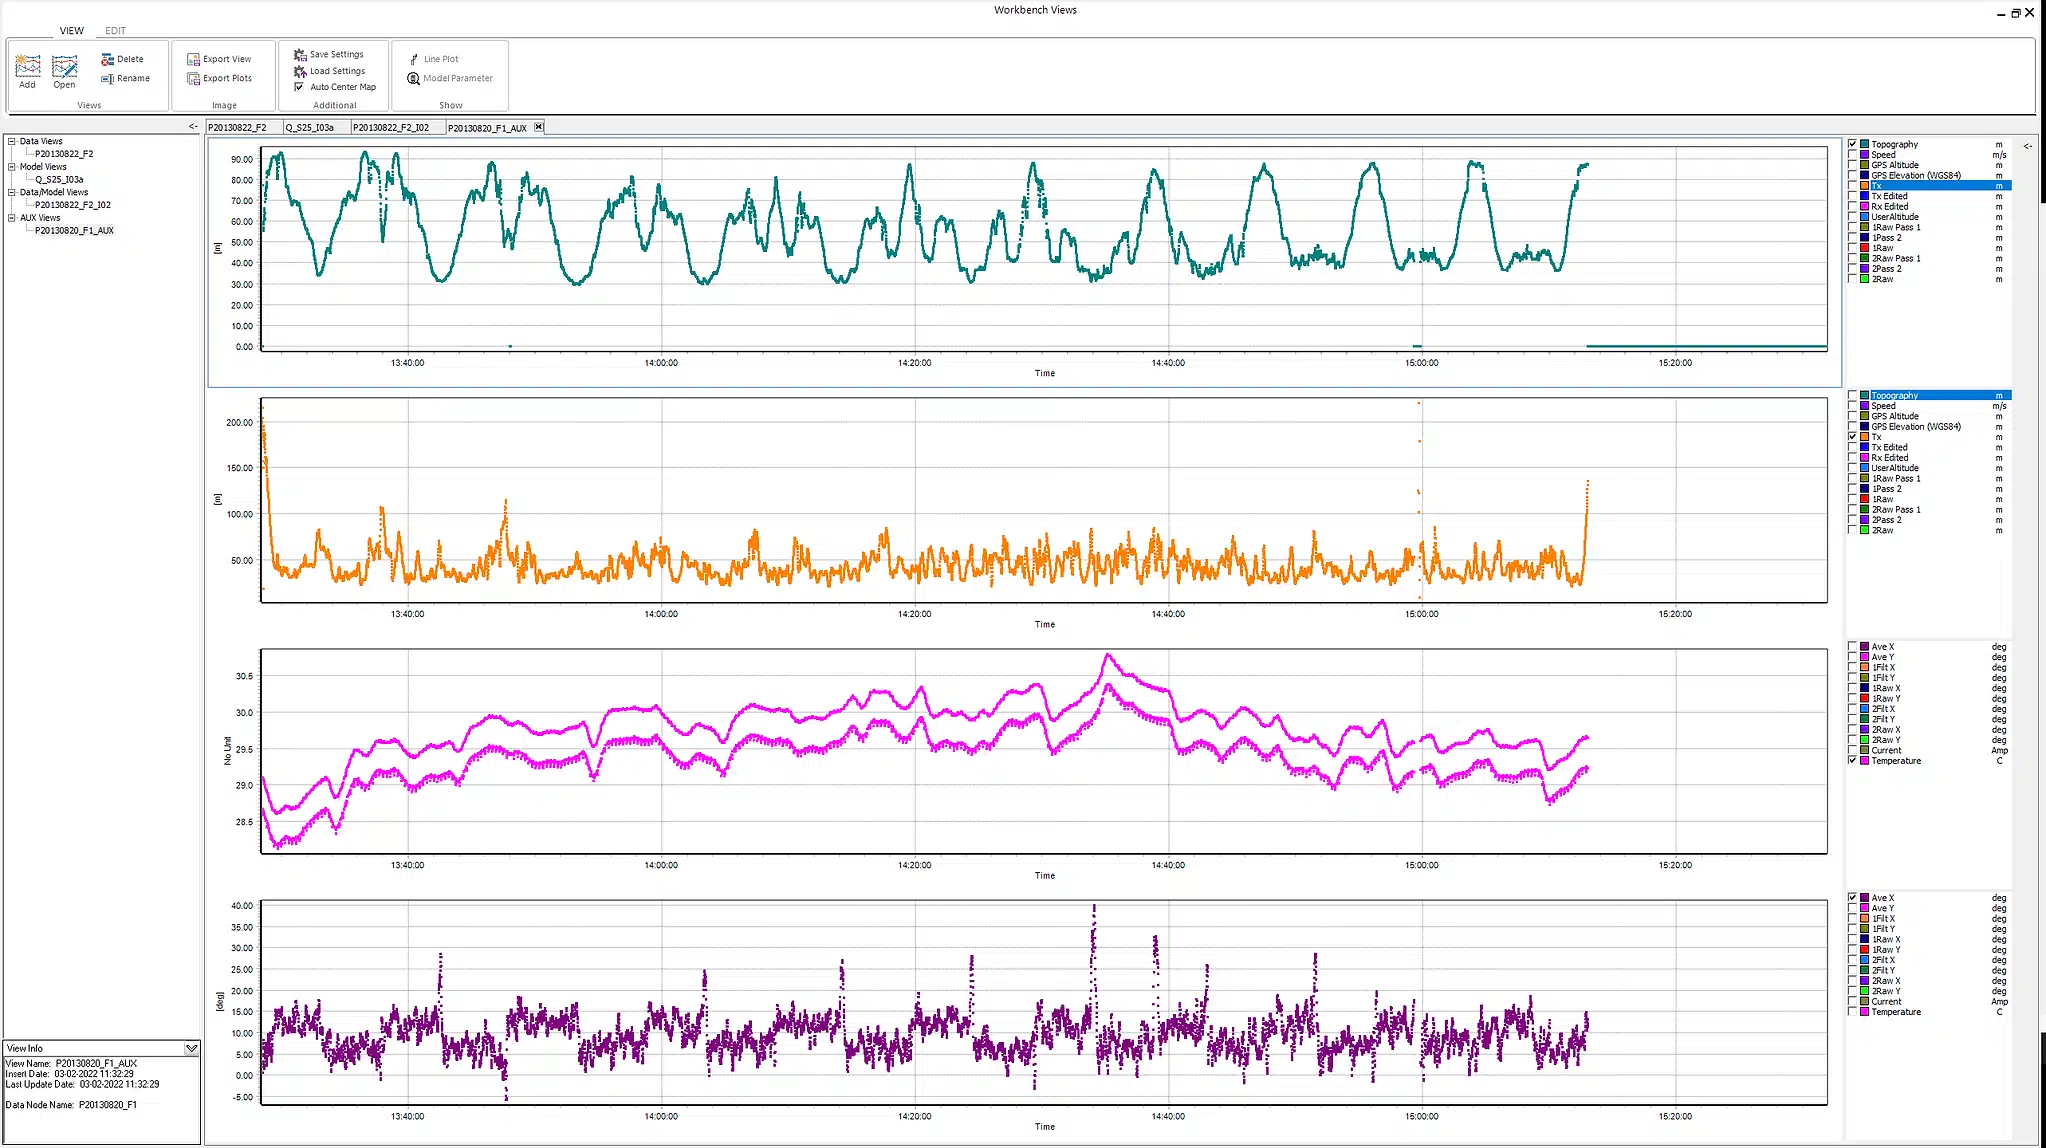
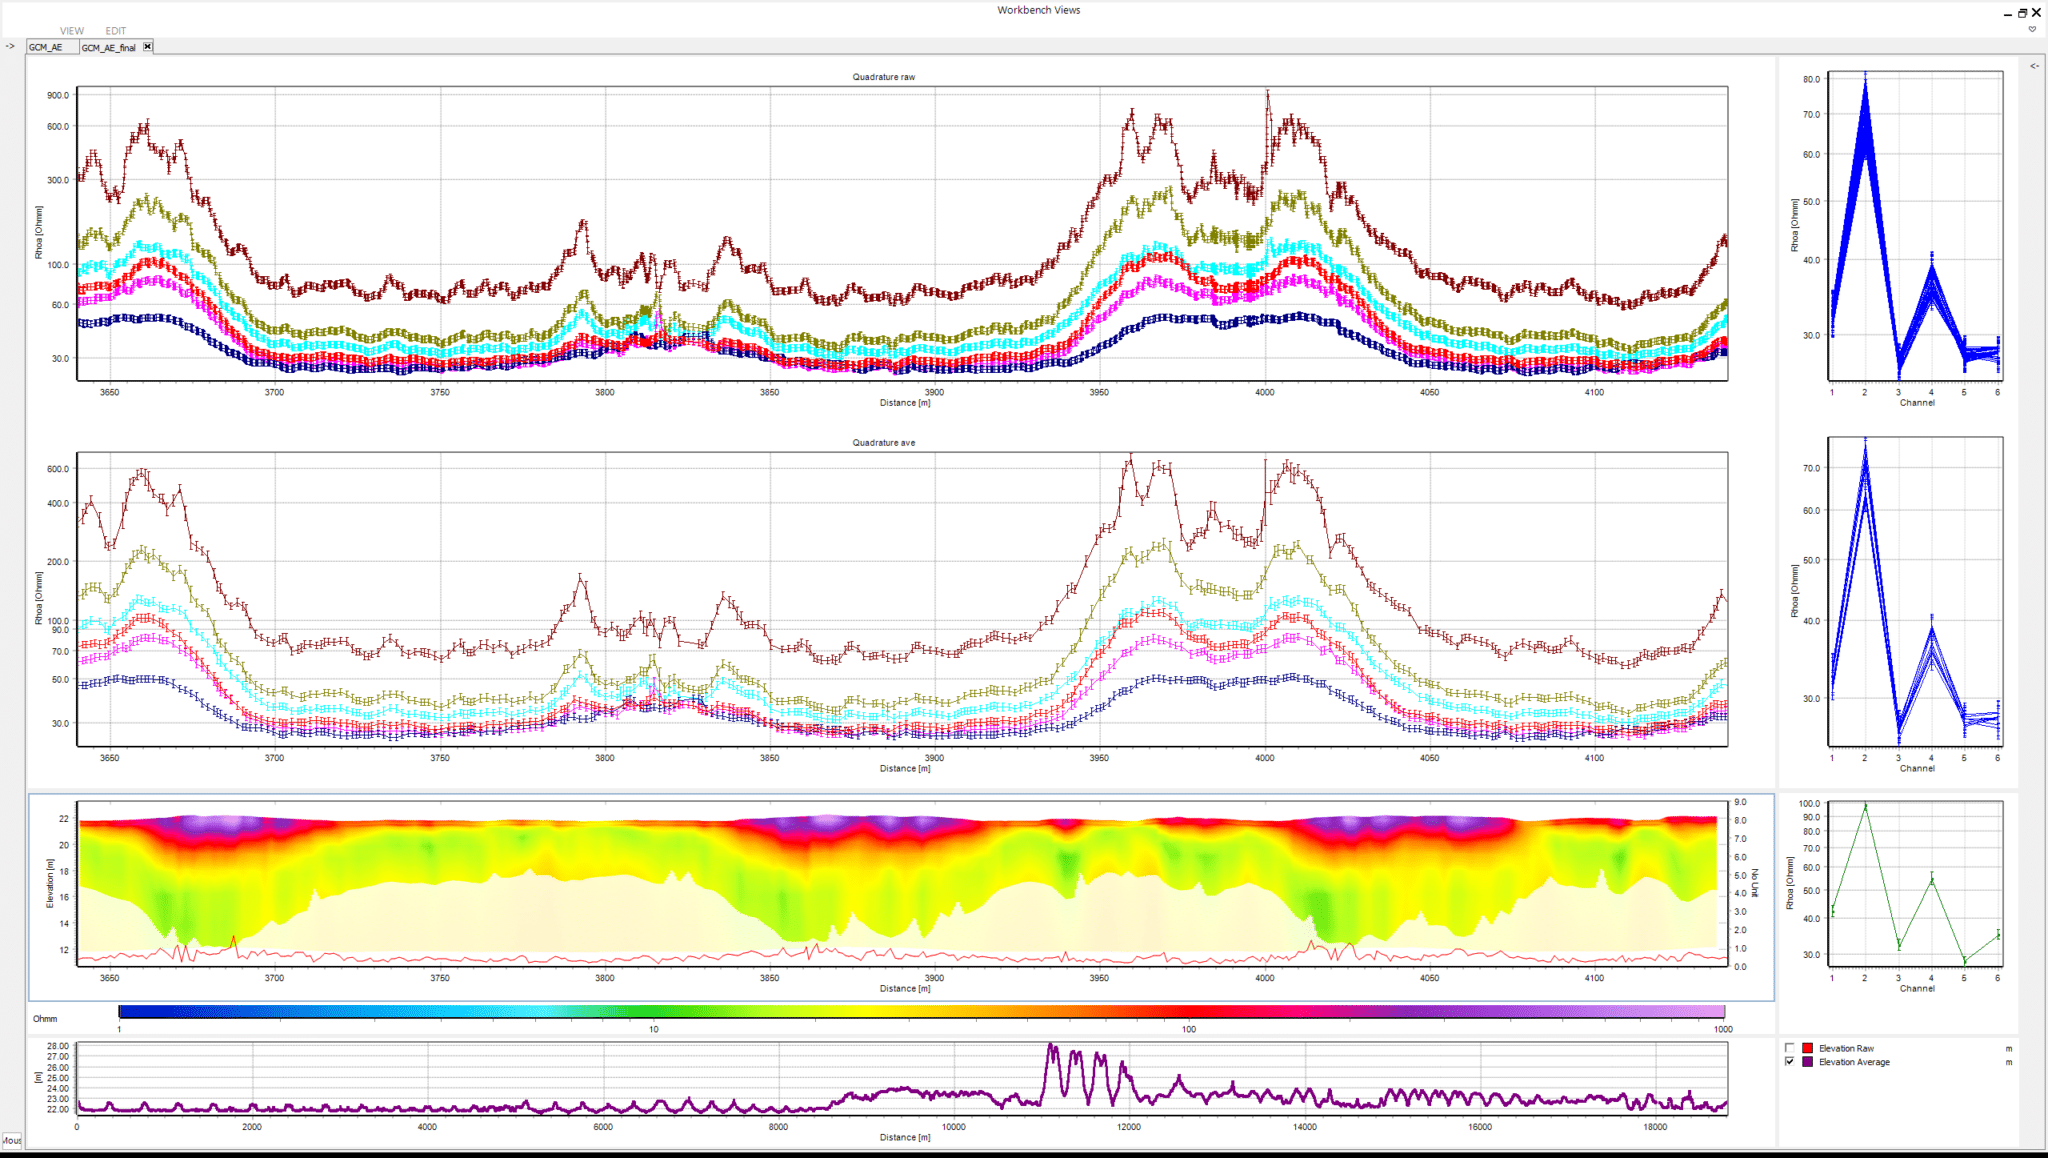
Workbench Views is a flexible, visual tool for efficient processing and visualisation of all EM and streamed ERT data. Customizable settings available in specialised “views” enable you to tailor your visualisation to your workflow needs. With these views, you can create, save, modify, and synch data visualisations.

Key features

  • Data, models, and plot settings are automatically saved to a View
  • Open a saved View and automatically load saved settings
  • Save plot settings and apply them to an alternate View
  • Export plots to separated or combined bitmaps
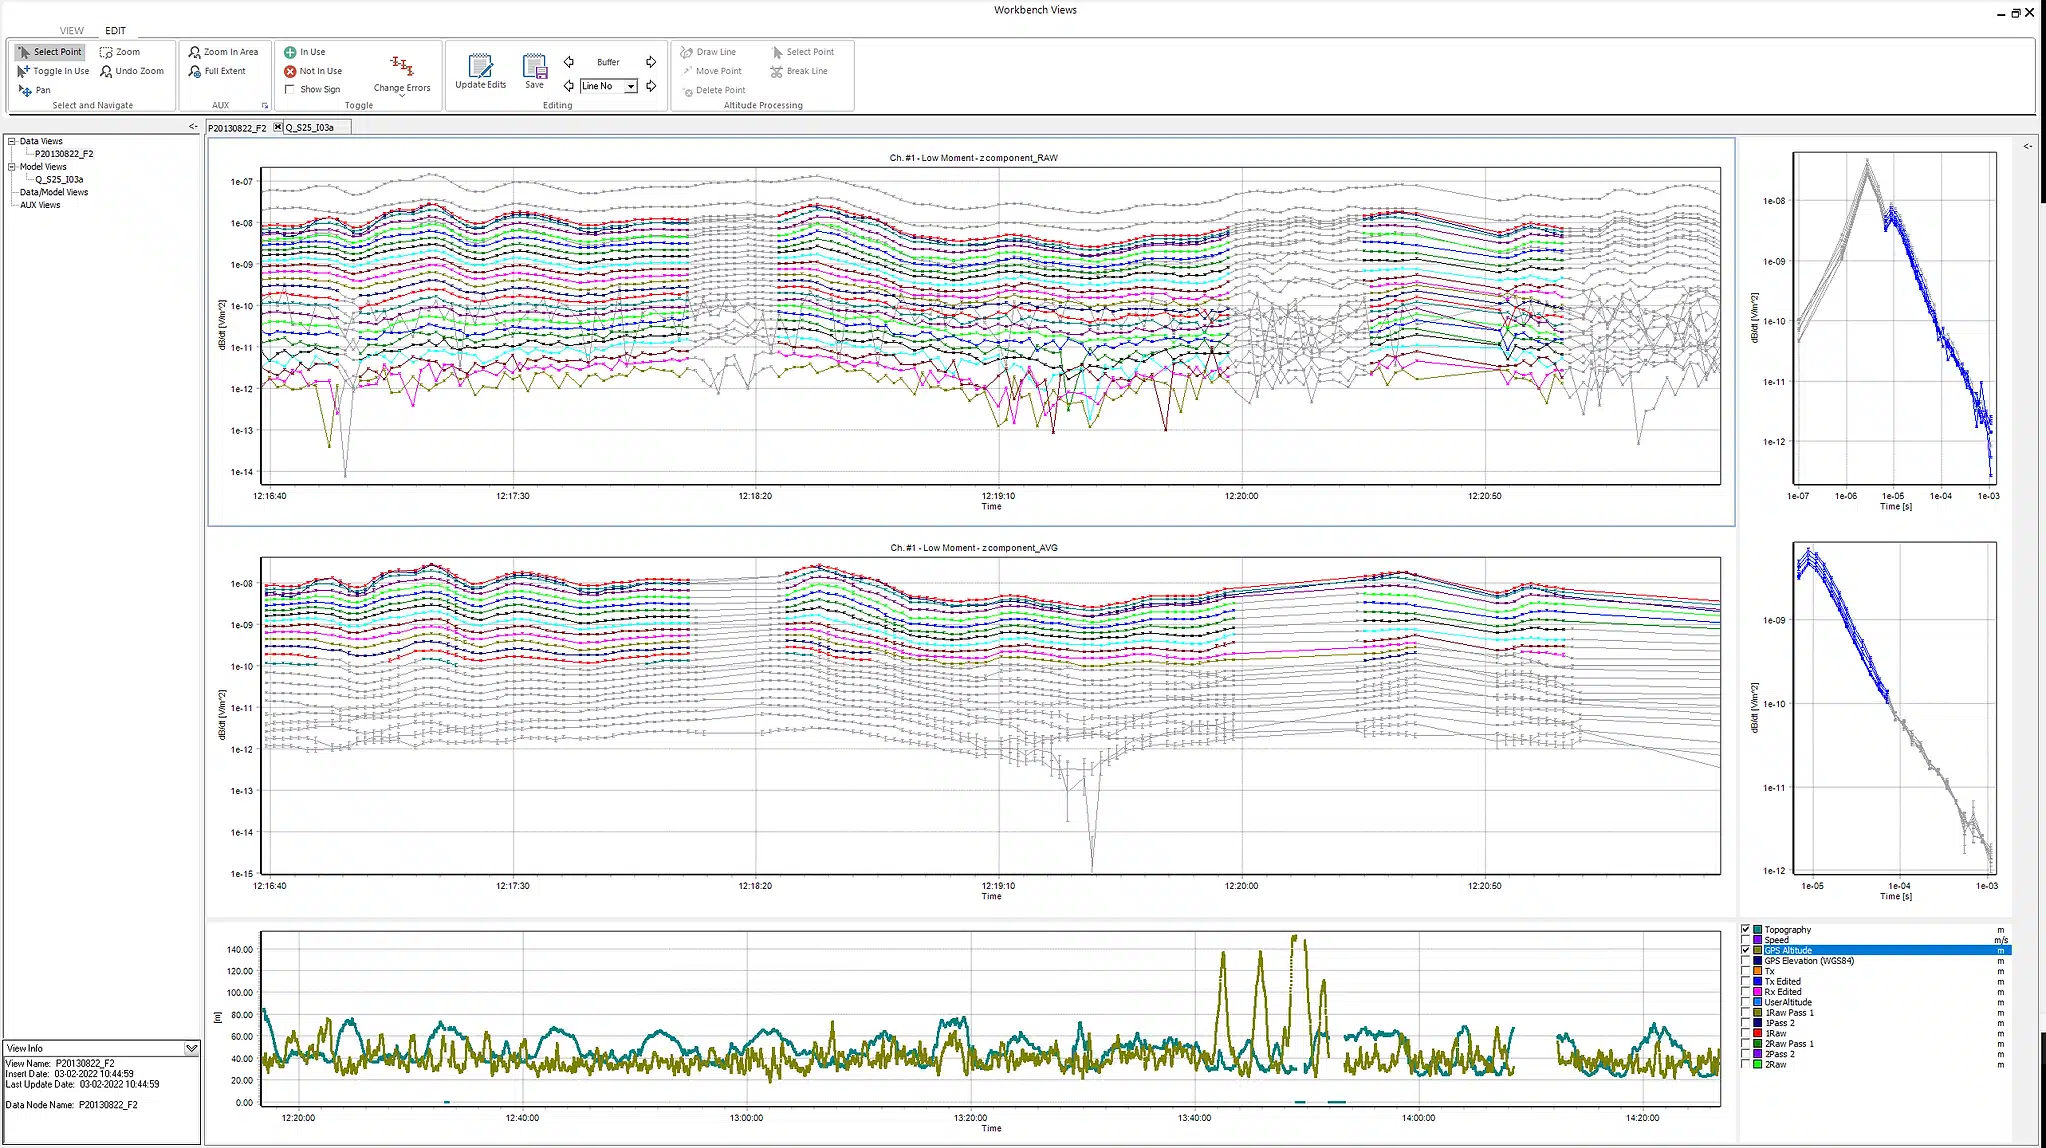
Buffer control

Control the data and model displays with two buffer options:

  1. Time or distance buffer shifts the displays to the next selected buffer interval.
  2. The line number buffer advances the display to the next line.

With multiple open Views, you can easily shift between data and model displays and you can sync plots within each View; when the buffer is used on one plot, the other plot will follow, and the x-axis will be aligned.

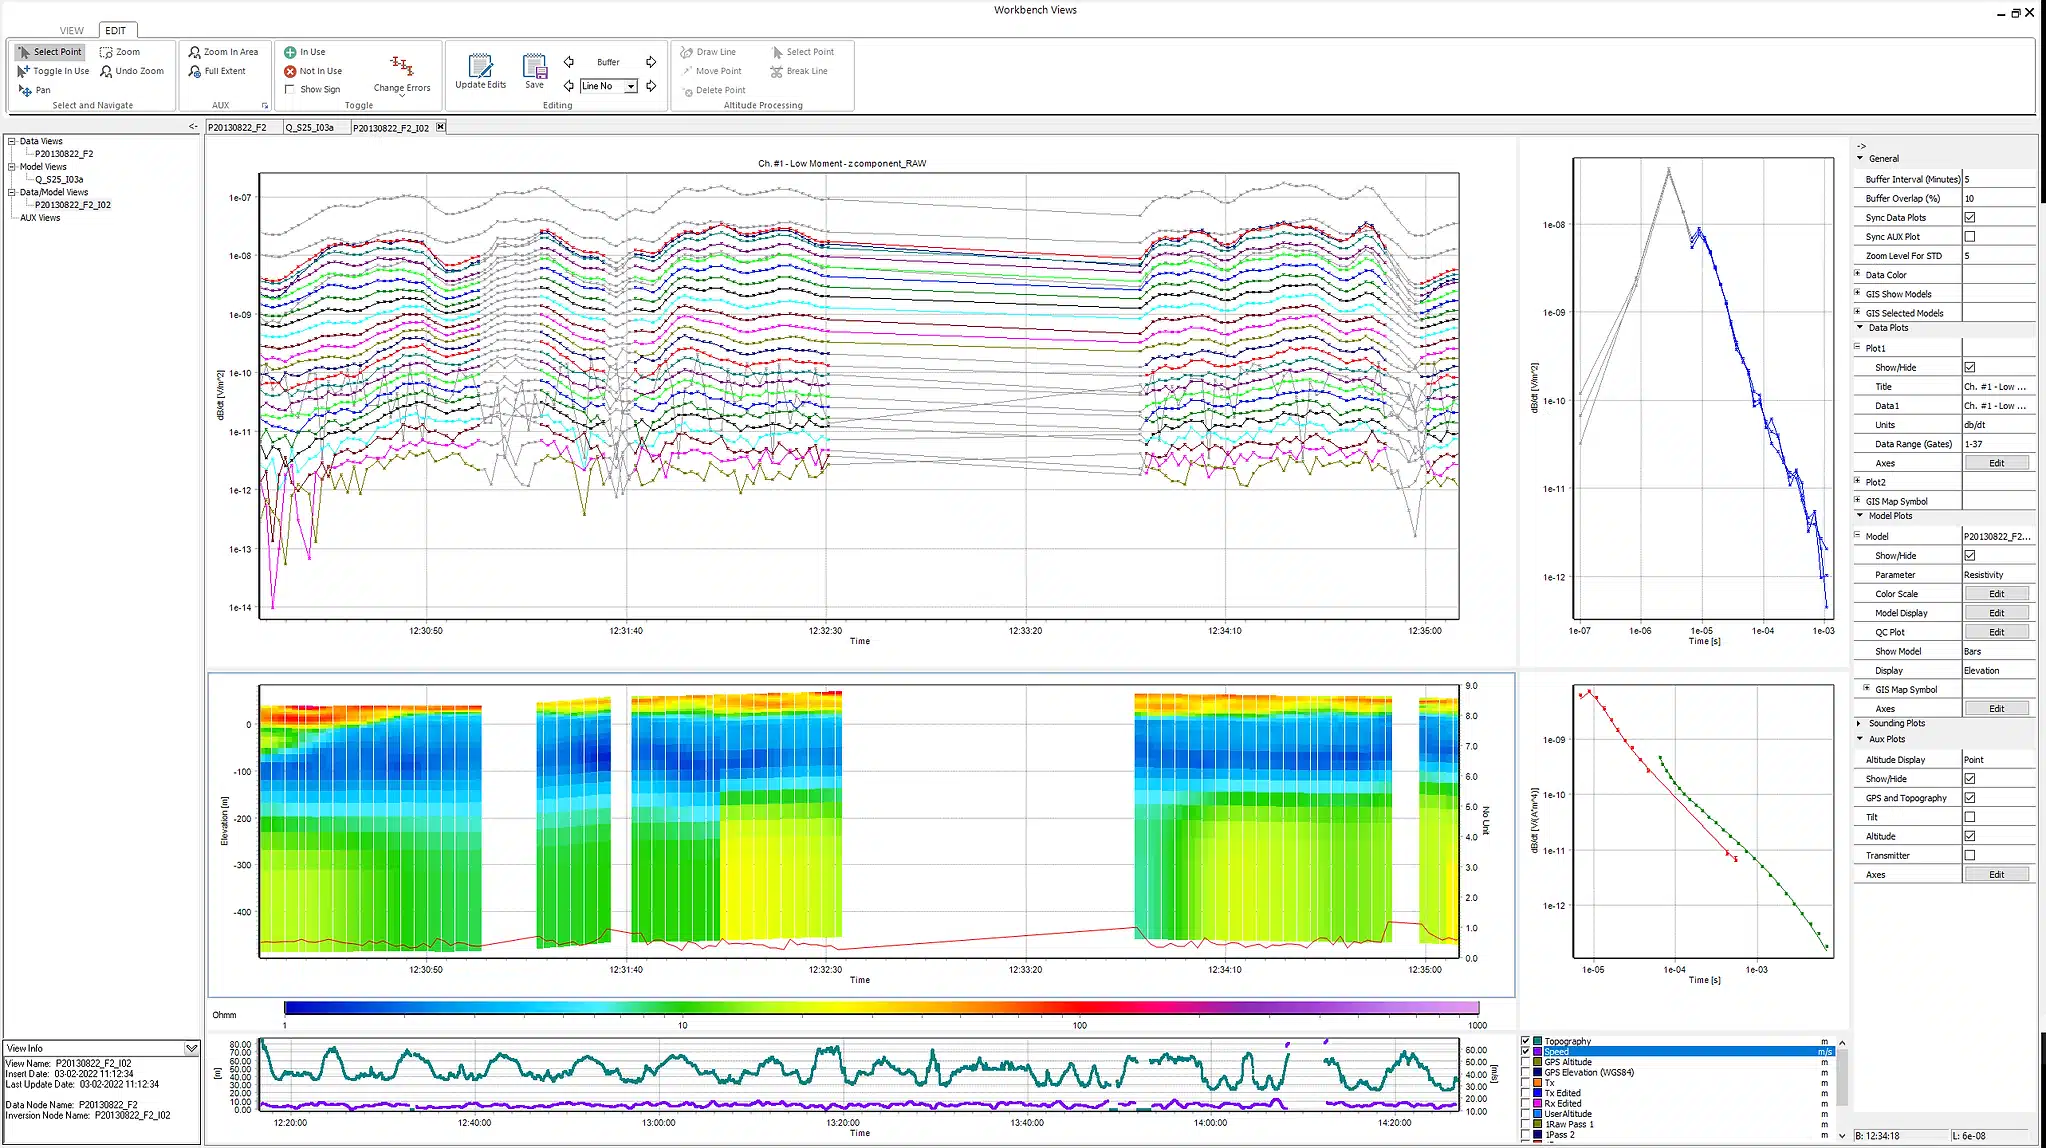
Customisation and synchronisation

Each data, model, sounding, and auxiliary plot has its own settings, making it easy to personalise each plot and view. Customise your views by:

  • Changing display units
  • Changing displayed data
  • Editing colour scales
  • Adding QC parameters to model plots
  • Interpolating models
  • And much more

The integration with the Workbench GIS interface allows for the mouse position on a plot to be simultaneously displayed on the GIS. This feature streamlines the process of pinpointing the exact geographical locations of data or models. It also enhances data processing by enabling the effective utilization of GIS maps for contextual reference and analysis.

Data View

The data view is ideal for manual processing and supports up to four plots simultaneously. The default configuration contains two plots displaying raw and average data, each with a corresponding sounding plot displaying the selected measurements. When processing on either plot type, you can select data, disable it, or give it a higher error. The view also features an auxiliary plot showing instrument parameters like elevation, speed, current, and GPS information. This plot can also be used to edit the altitude of data.

Data/model View

The data/model View is used to visualize model results from inversions and consists of data plots with corresponding sounding and auxiliary plots, like the data View. An additional plot displays inversion models, synched with data plots for easy cross-referencing.

When a model is selected you can open a Line model View, or you can use the Model Parameter View to open a list of all resulting parameters for all models. The data/model view makes it easy to re-process data by providing a visual of the results and their fit, allowing you to identify the corresponding data that needs to be altered for a new inversion.

Model View

The model View is used to compare results from different surveys, data types, or model results created from the same data. This view can contain up to four plots, each capable of displaying new models.

When a model is selected you can open a Line model View, or you can use the Model Parameter View to open a list of all resulting parameters for all models.

Auxiliary View

The auxiliary View is used to plot additional auxiliary data available from instruments. The temperature, topography, current, tilt, manually edited altitude, and much more can be plotted with this view, providing an overview for final reporting.

Learn more about Workbench

Request a demo

Free training and support

Grow your geoscience knowledge, connect with peers, and refresh your skills

Seequent Community

Discover new opportunities, connect with peers, and share insights and best practices with others in your field.

Visit Seequent Community

Learning Centre

Get started fast or upskill whilst working with our onboarding and advanced free eLearning courses.

Visit Seequent Learning Centre

Seequent Help

Find answers to your technical questions and get the most out of your product, with our in-depth product help information.

Visit Seequent Help