


The topics in this post were originally presented at the Seequent Lyceum 2019 in Vancouver by Project Geologist, Anna Kutkiewicz.
This is part 2 of a 2-part blog series:
- Part 1 discusses how to view and categorize invalid values, missing intervals, and missing values on a numeric table in the 3D scene. View Part 1 here.
- Part 2 explains some tricks for quickly querying and identifying Wedge holes in the 3D scene, and handling duplicate data conflicts without removing them.
Leapfrog is ideal for identifying errors and warnings within drillhole databases and other sheet-based data. In Part I we introduced how to use Interval Selection to add labels to invalid values, missing values, and missing intervals for numeric data. In this post, I’d like to share some tricks I’ve discovered for identifying wedge holes, and for handling duplicate data. The ‘tricks’ in this section can be flexibly applied in other error identification/handling situations.
Wedge holes and using Excel to quickly build a query
‘Wedges found’ warnings occur in the collar table or in the survey table when drillholes appear to be duplicates because they are very close together in space, or are in fact redrill coordinates that are shared. Therefore wedge hole warnings can highlight actual wedge holes, redrills, or highlight situations where neither of these are the case but coordinates have been misentered. A simple way to view these cases in the 3D scene is to create a query filter for each hole ID, but this can be time consuming.
Building a query filter to view possible Wedge holes
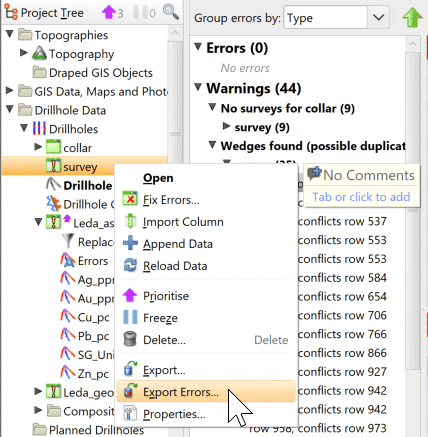
Export the survey errors by right clicking on the survey table > export errors .
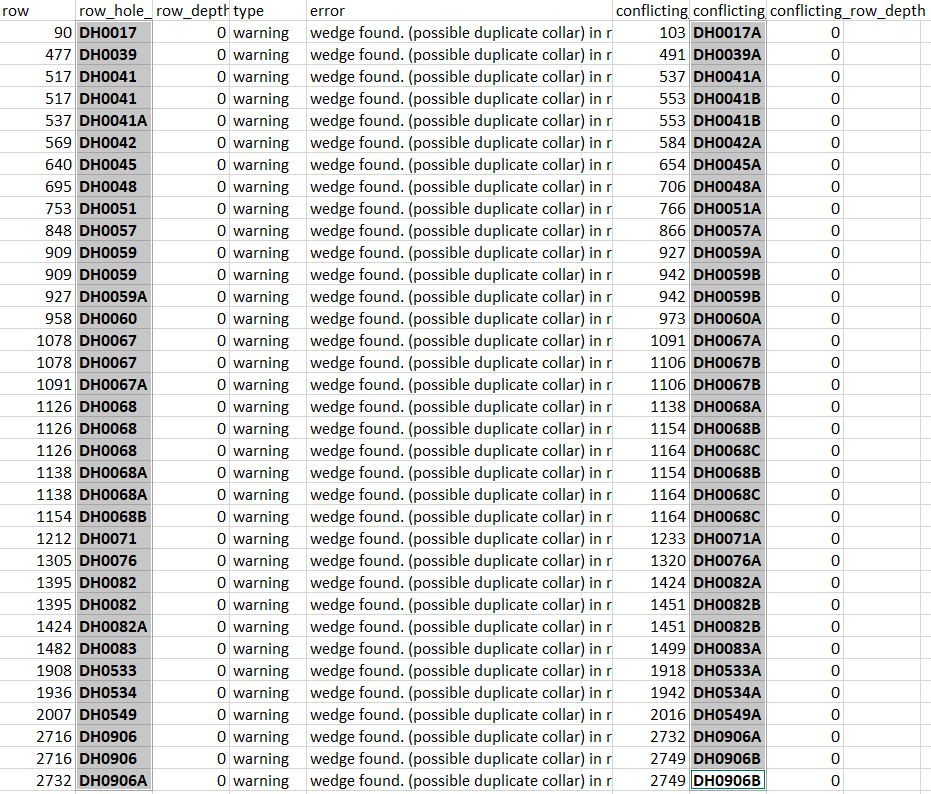
Open the survey errors in Excel and copy the Row Hole ID and the Conflicting Row Hole ID to the clipboard.
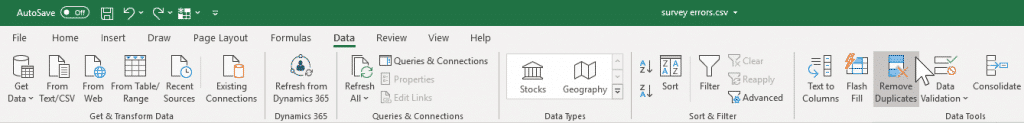
To do some quick duplicate-cleanup, paste these into a new single column and perform the Data operation > Remove Duplicates.
Copy the cleaned column to the clipboard and paste into column B of this Excel spreadsheet. You can then copy column D to the clipboard.
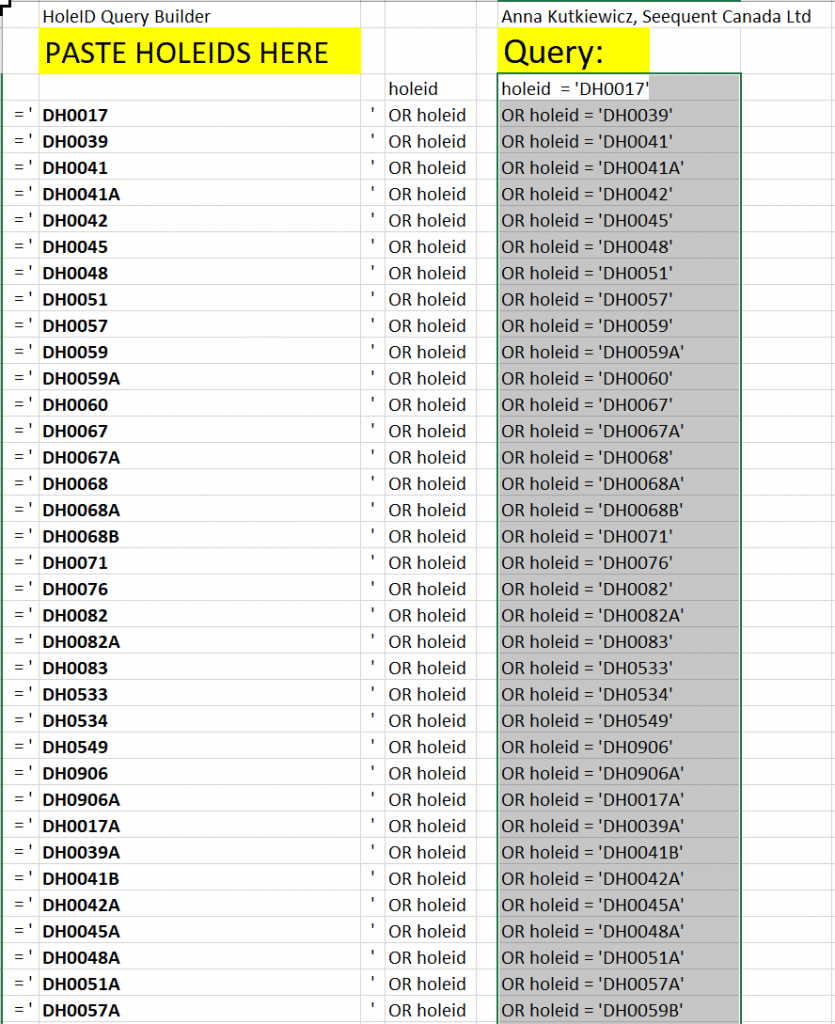
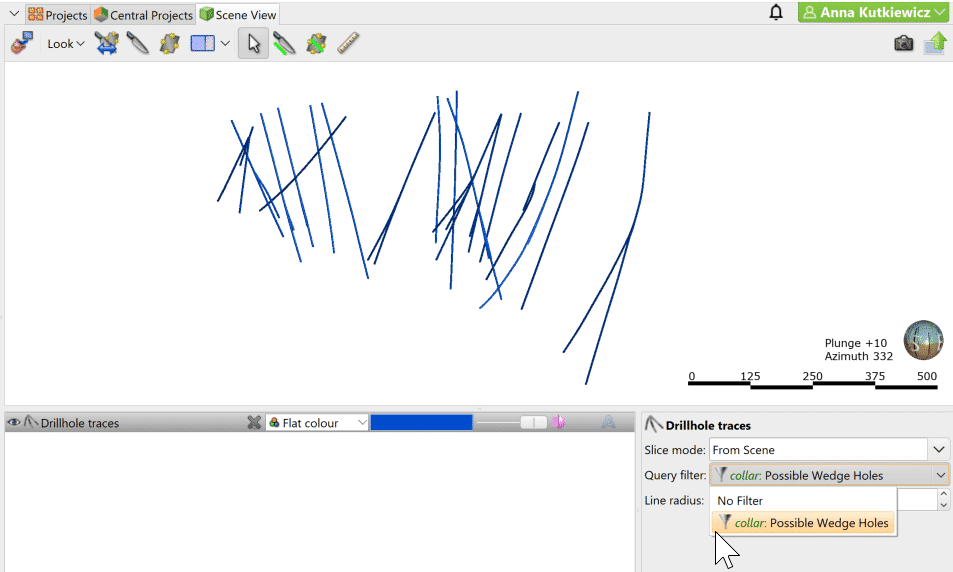
Within Leapfrog, right click on the Collar column and create a new Query Filter. Paste the copied text straight into the syntax field; no need to use the builder. Call your query Possible Wedges.
The filter can now be applied to the Drillhole Traces for quick visualisation.
Removing duplicates without removing duplicates
Leapfrog will conveniently highlight any duplicates within interval and point data. Since these values cannot both be displayed in 3D space, you are forced to choose one or the other. This does make sense when it comes to things like assays that actually sit in the same 3D space (for drillholes for example, in which case it is not reasonable to have different assays in the exact 3D space).
However, what happens if you need these duplicate data points? For example, surface geochemical samples may commonly be collected with multiple samples grabbed at the same GPS location. In reality they may be meters apart, but due to the nature of the survey, only one geographic point was collected.
One solution is to move the ‘duplicate’ samples over by a small distance away, allowing you to keep and view them all. This can be time consuming and frustrating so we’d like to present a spreadsheet that does this for you. Duplicates for X and Y are detected. If it is the first iteration of a duplicate, the X will be moved by 1. If it is the 2nd, the X will be moved by 2 (so on and so forth).
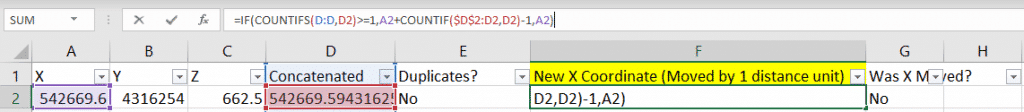
The COUNTIF formula will search within a row (say D to D) to search if any values equal the value in question (D2). Duplicates returned will result in the subtraction of 1 distance unit from the Easting.
Please note that this spreadsheet is designed for X,Y data and does not search within the Z value. You may feel free to build upon this with your own twists. Special thank you to a geologist/exploration manager at a junior Alaskan miner for providing the original spreadsheet.