Making the transition from fossil fuels to renewable energy, the Netherlands is promoting development of geothermal sources. Dutch consumers currently depend heavily on natural gas from the country’s Groningen fields, which will be shut down within a decade.
But before funding new exploration for ultra-deep (>4 km) geothermal reservoirs, full exploitation of existing subsurface data is being encouraged. Initial targets are the Carboniferous and Permian formations which host proven oil and gas reservoirs.
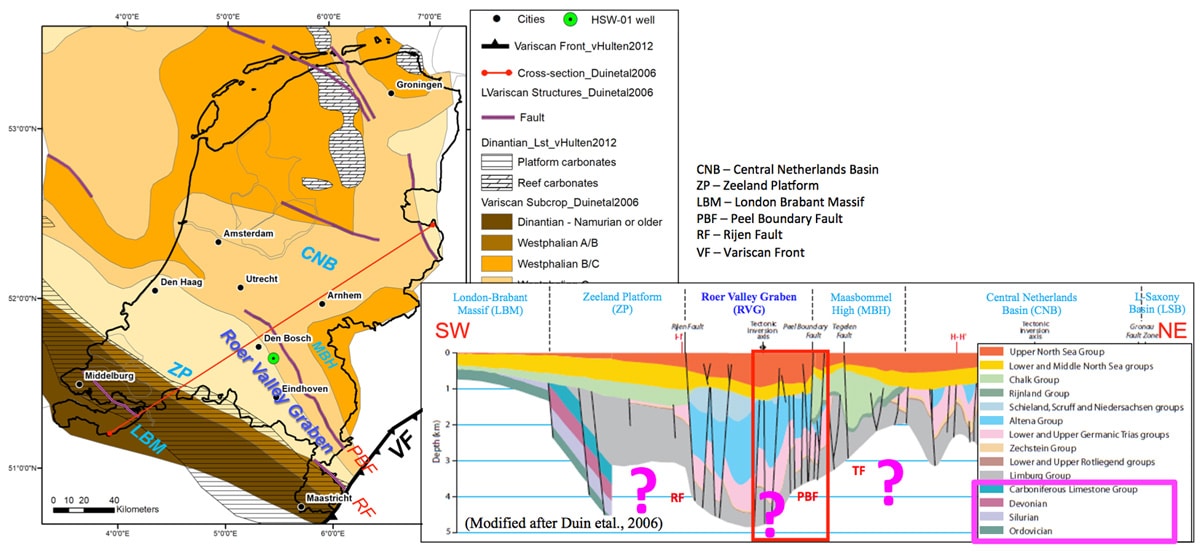
Figure 1: Variscan subcrop map and cross section through the study area. Question marks indicate the unknown geology. The study area of Heeswijk is the surroundings of the HSW-01 well.
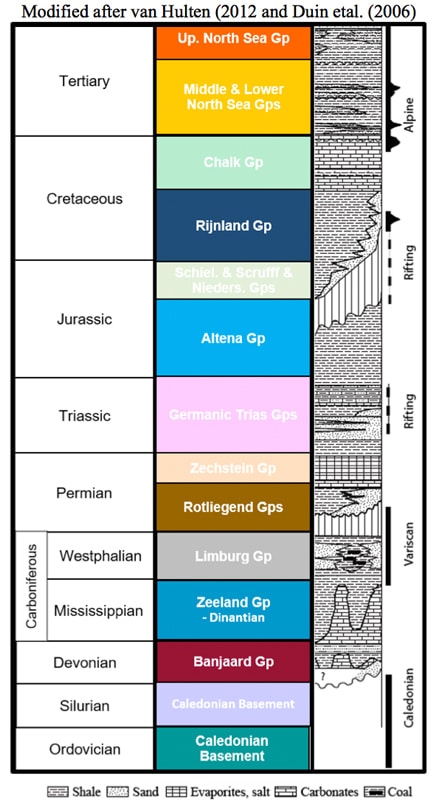
Figure 2: General stratigraphy in the study area.
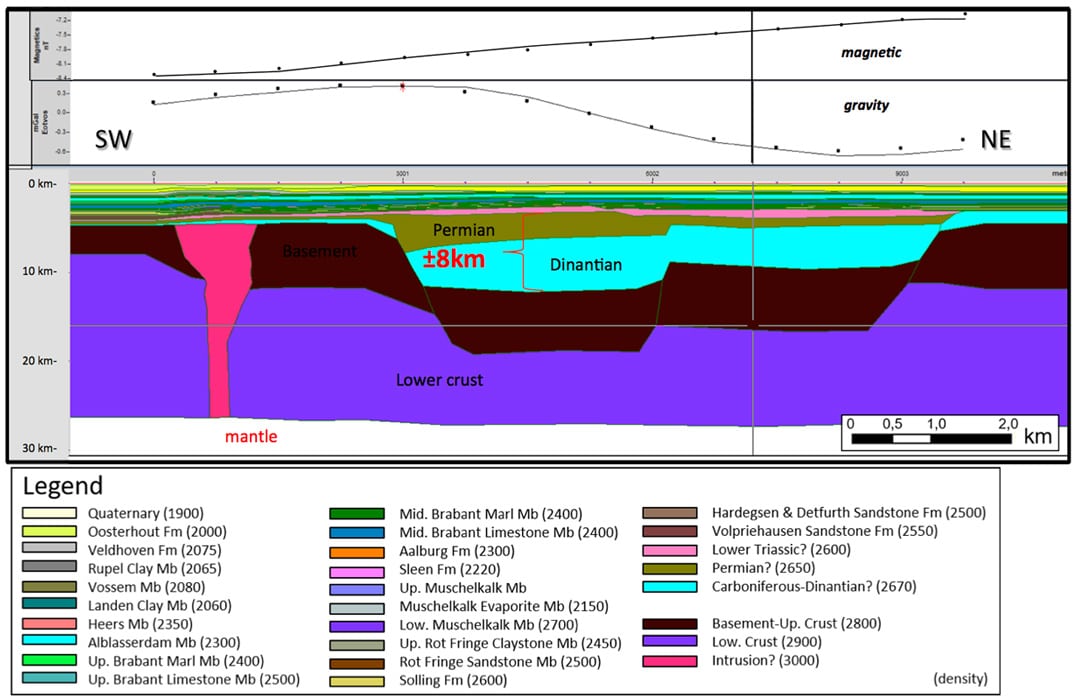
A recent project conducted by Pieter Van Heiningen of Provenance Exploration Consultancy BV and his business partners Vincent van Hoegaerden (EnerGeophy Consultancy), Dr Tijmen Jan Moser (Moser Geophysical Services) and Dr Nuretdin Kaymakci (Provenance Exploration Consultancy BV) used an integrated approach. They exploited several geophysical and geological datasets in one modelling environment to demonstrate that several kilometers of sediments have been deposited and preserved below the Upper Triassic in the Roer Valley Graben.
In a paper presented at the 80th EAGE Conference & Exhibition 2018 in Copenhagen, Van Heiningen explains that these formations are out of the reach of existing seismic and well data. As a result, the approach entails 2D gravity and magnetic modelling constrained by seismic interpretation of the post-Permian section, which in turn has been tied to reprocessed velocity and density well log data, and additional information on Moho and intra-crustal discontinuity depth from recent studies.
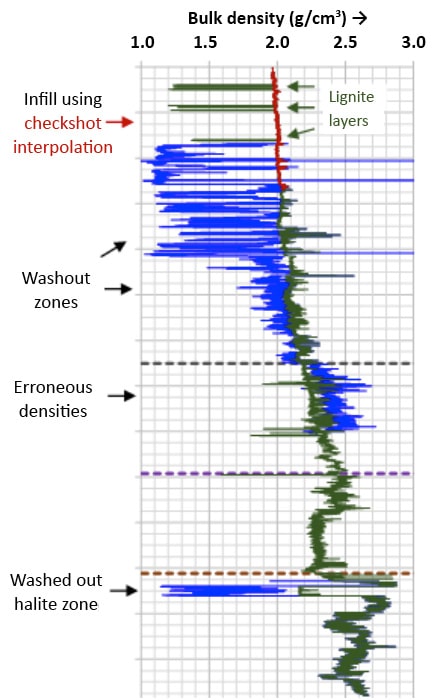
Figure 3: SeismoLog Pro result of the density log. Blue is the original data, green is the corrected data. Courtesy of Energeophy Consultancy.
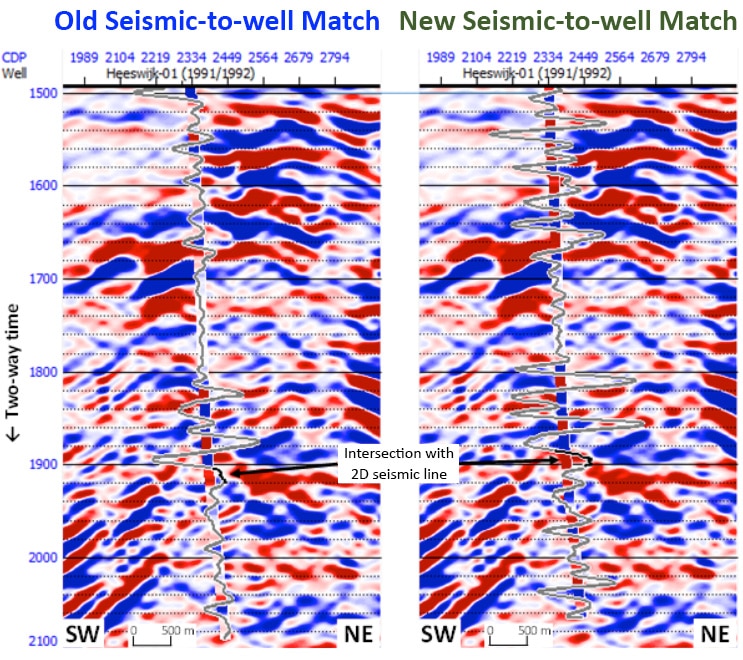
Figure 4: Seismic to well tie result with the SeismoLog Pro velocity log. At left is the original log. At right is the corrected log.
The project team faced several challenges. Existing seismic data onshore the Netherlands are mainly 2D, most pre-date 2000, and have limited resolution beyond 3 km depth. “In addition, the seismic data was migrated with out-of-date processing workflows and parameter settings, eliminating important details from the data that we can improve on significantly if unmigrated seismic data is at hand,” says Van Heiningen.
Similarly, resolution of gravity and magnetic data decreases with depth proportionately although major structures, basement geometry, position and general geometries of intrusions, and basin boundaries can be distinguished for depths beyond 3 km.
Van Heiningen says the Roer Valley Graben was chosen, “given the interest it receives from industry and government for its geothermal potential and assumed widespread distribution in the Roer Valley Graben, and moreover the depth range in which it is supposed to reside.” They targeted the Dinantian Limestone Formation there to characterize its distribution, structures, and depth. “The off-take potential for heat from deep geothermal and ultra-deep geothermal is substantial,” he says, “with large cities like Eindhoven with its university campus and technology firms, and ‘s-Hertogenbosch for example.”
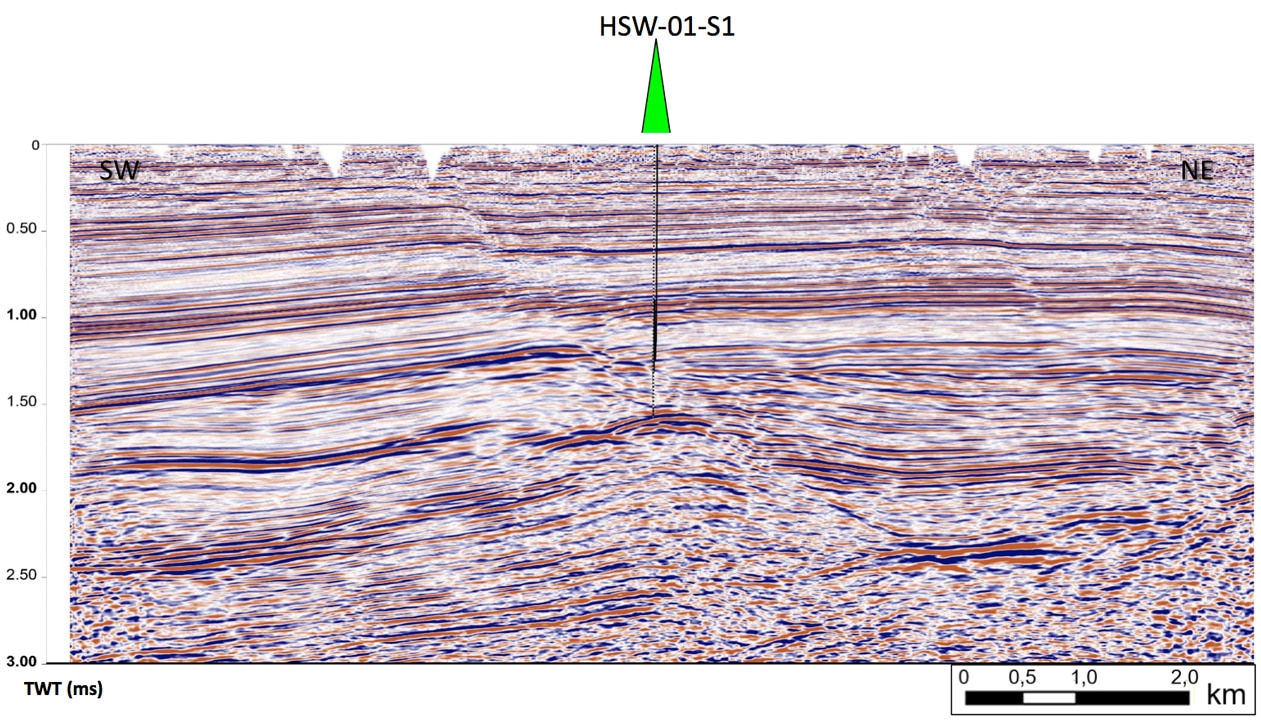
Figure 5: Unmigrated Time section N90-09(10006) with HSW-01 location.
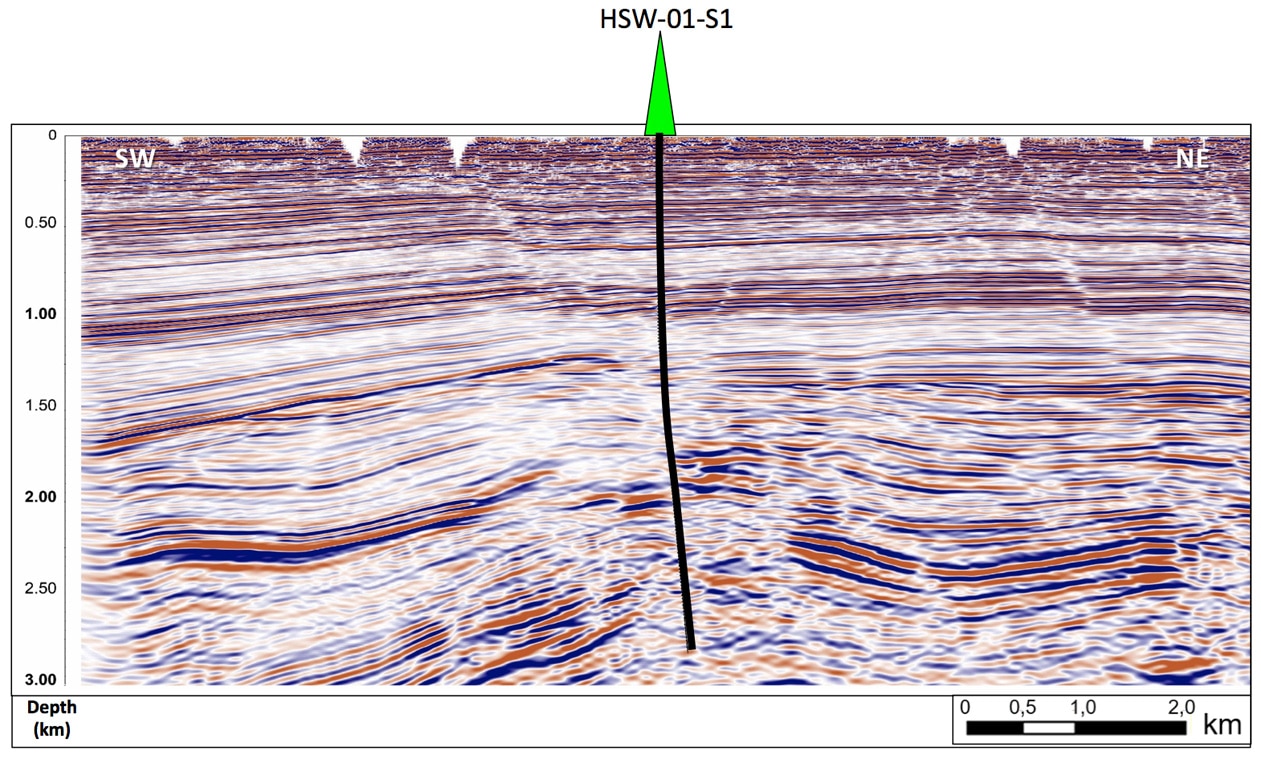
Figure 6: Our new processed PSDM section N90-09 (10006) – this study. Courtesy of Moser Geophysical Services.
Data interpretation was undertaken in several steps. First they conducted a qualitative and quantitative analysis on the free air gravity anomaly and vertical gravity gradient data, TNO Bouguer gravity anomaly and EMAG2 total magnetic intensity data; followed by filtering and processing using the Butterworth bandpass filtering feature of MAGMAP, part of Geosoft’s Geophysical Interpretation extension for Oasis montaj, MAGMAP was also used to reduce the EMAG2 total magnetic intensity to pole in order to place the anomalies on top of their causative bodies at depth, since the earth’s magnetic field is not perpendicular to the surface at this latitude. Bandpass filtering, tilt derivative and horizontal gradient maps of the gravity and magnetic data were also generated using MAGMAP. The filter maps were applied to discover meaningful anomalies that could be geologically interpreted. Fault traces were mapped on the tilt derivative maps by means of lineaments on which a kinematic analysis was carried out under the regional stress regime, for implementation at a later stage in the seismic interpretation and in the 2D gravmag model.
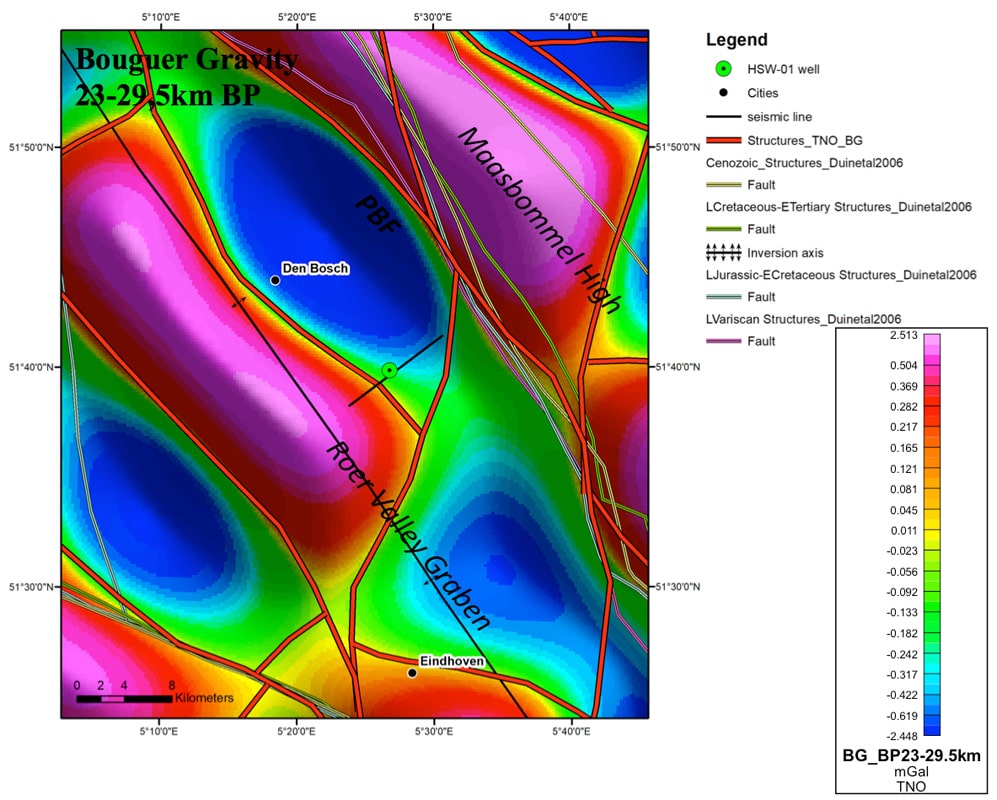
Figure 7: Bouguer Gravity 23-29, 5km Band Pass filter map with structural interpretation (from this study) and Duin etal (2006) faults. Note the clear correlation between the two interpretations. Gravity data source: TNO – Netherlands.
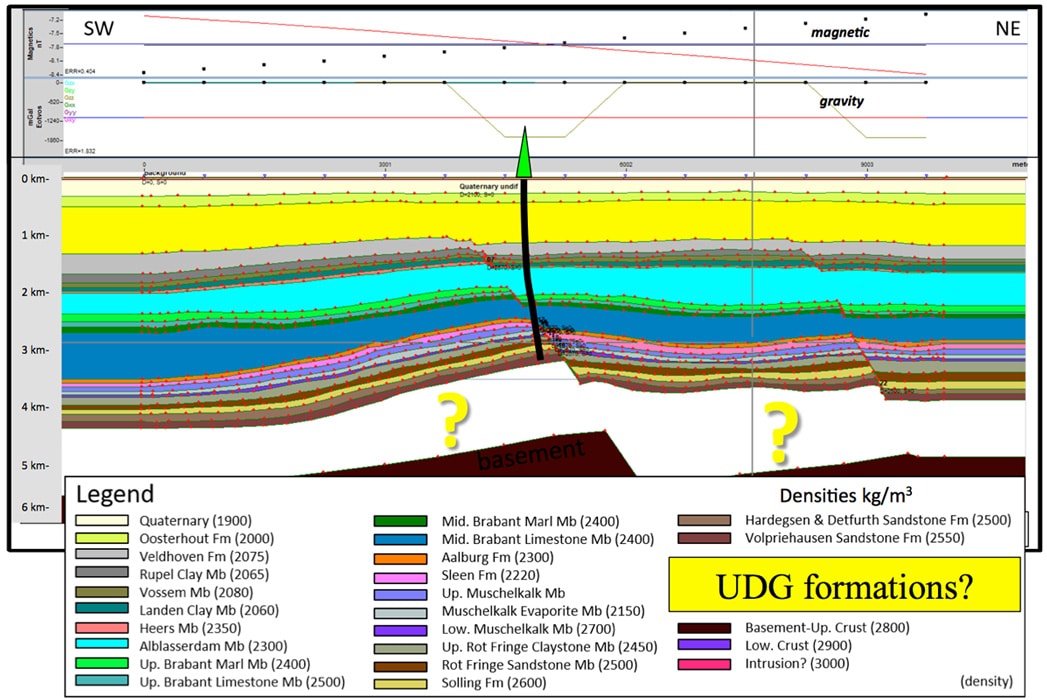
Figure 8: Starting model of gravity and magnetic data constrained by well density and stratigraphic information with seismic interpretation. Data source: Gravity – TNO and Magnetic – EMAG2.
Seismic and well log data were sourced from a well near a 2D seismic line drilled in 1991 by Clyde Petroleum Exploration BV searching for hydrocarbons in the Roer Valley Graben. Drilling extended just to the Triassic Volpriehausen Sandstone Formation at 2,847m TD. For accurate re-processing, migration and time-to-depth conversion by Moser Geophysical Services of the seismic line, the team deployed reprocessed check shots and density logs from the SeismoLog Pro workflow by EnerGeophy Consultancy in order to achieve a proper depth relation for the velocity and density values. Finally, in Hampson Russell software (CGG) the well-to-seismic tie was performed using the corrected well logs.
“The seismic section with its stratigraphic interpretation was constrained by the corrected well path and stratigraphic tops via the SeismoLog Pro workflow; and the gravity and magnetic structural interpretation was plotted in the 2D gravmag (depth) model using Geosoft’s GM-SYS Profile Modelling,” explains Van Heiningen.
“The seismic interpretation was key to eliminating unnecessary uncertainties from the 2D gravmag model,” he says. He adds that magnetic highs and lows can, in the absence of volcanic intrusions, be regarded as magnetically susceptible basement highs and lows respectively. As such, the Bouguer gravity anomaly map gives an impression of the shape of the top basement where its highs and lows correlate with magnetic highs and lows respectively.
The integrated gravity and magnetics modelling together with the improved well and seismic data enabled the team to determine the space between the top basement and base Volpriehausen Formation in the Heeswijk region subsurface of the Roer Valley Graben – which would have been impossible using the existing 2D seismic data alone.
The project demonstrates great promise for geothermal investigations in the country using existing data. According to Van Heiningen and his business partners, the pilot study is unique in the Netherlands and their approach stems from combining best practice from oil and gas exploration. “This project provides a crucial example for advancing the successful exploration of high quality and high energy/temperature geothermal reservoirs in the Netherlands, in a cost-efficient and effective way.”