


Discover how Seequent Central can assist in connecting geophysicists to the wider geoscientific team and break down barriers through real time notifications and interactive collaboration.
Central allows for Geosoft grids and voxels to be stored & version tracked; it also provides direct import options for geophysical files into the Leapfrog modelling suite to facilitate the constrain of geological models. In turn, finetuned geological interpretations can be communicated and shared through Central to facilitate an optimized geophysical model. Thus, the system supports a full iterative workflow that culminates in a true holistic model taking all the latest geoscientific information into account.
This webinar includes an introduction to Seequent Central and will show you how to import 2D geophysical grids across projects from the Central Data Room, to utilize outputs created in Oasis montaj.
Overview
Speakers
Geoff Plastow
Senior Geophysicist – Seequent
Janina Elliot
Senior Technical Lead – Seequent
Duration
32 min
See more on demand videos
VideosFind out more about Seequent Central
Learn moreVideo Transcript
[00:00:05.490]<v Geoff>Welcome and thank you very much</v>
[00:00:07.230]for joining us in today’s webinar:
[00:00:09.720]An Introduction to Seequent Central for Geophysicists.
[00:00:13.530]My name is Geoff Plastow and I’m a Senior Geophysicist
[00:00:16.630]and Technical Team Lead with Seequent.
[00:00:19.500]I’m here today with my co-host Janina Elliott,
[00:00:22.260]who is a Geologist by trade,
[00:00:24.090]and our Global Technical Lead for Central.
[00:00:27.010]We’re really excited to share
[00:00:28.260]with you the latest developments
[00:00:29.860]that we’ve made around collaboration and data management.
[00:00:33.830]For those that don’t know,
[00:00:35.130]Central is a cloud hosted data management solution
[00:00:38.340]which enables access to a Centralized data store
[00:00:40.451]for project information.
[00:00:42.720]This includes geologists and geophysicists being able
[00:00:45.460]to work collaboratively across different
[00:00:47.370]modeling applications then storing and commenting
[00:00:50.550]on each other’s work in a Centralized platform.
[00:00:56.186]To start off, let’s do a bit of housekeeping.
[00:00:58.930]During the webinar, the audience is muted
[00:01:01.040]to ensure that the presentation doesn’t run over time.
[00:01:04.420]For questions, please use the question window
[00:01:06.900]in the GoToWebinar dialogue,
[00:01:08.660]and I’ll make sure to answer them
[00:01:10.160]with a personalized email following the presentation.
[00:01:13.830]The presentation today will utilize the latest versions
[00:01:16.620]of Oasis montaj, Leapfrog Geo and Central.
[00:01:20.770]This webinar is primarily designed
[00:01:22.680]for existing Central users,
[00:01:24.580]but holds valuable information for everyone new
[00:01:27.320]to the software suite.
[00:01:29.430]A recording of this webinar will be made available
[00:01:31.520]to all registered viewers shortly after the presentation.
[00:01:35.510]And please stay online after the webinar
[00:01:37.800]to partake in a short survey.
[00:01:41.930]<v Janina>Before we go ahead</v>
[00:01:42.830]and jump into the demonstration,
[00:01:44.702]I would like to introduce ourselves.
[00:01:46.900]So, who is Seequent?
[00:01:49.340]Some of you may have heard of us
[00:01:50.770]through one of our applications
[00:01:52.140]such as Leapfrog Geo for example.
[00:01:54.930]Others may have never had a touch point.
[00:01:56.701]So who are we?
[00:01:58.720]We are a software company that builds solutions
[00:02:01.430]for the geoscientific community.
[00:02:04.140]It is our mission to enable our customers
[00:02:06.720]to make better decisions about the earth, environment,
[00:02:09.960]and energy challenges
[00:02:12.270]because it is that robust decision-making process
[00:02:15.880]that provides security and longevity to an organization.
[00:02:23.890]Seequent has truly a global presence
[00:02:26.740]with over 430 staff around the world.
[00:02:30.420]But not only do we hire geologists and geophysicists
[00:02:33.730]from the mining field, we also bring in experts
[00:02:36.720]from other geoscientific fields and provide active solutions
[00:02:40.450]to the civil, energy, and environmental sectors.
[00:02:45.120]Through this cross-sector engagement
[00:02:47.280]with our global customers, our team continuously develops
[00:02:51.120]new cutting edge technology to support you
[00:02:54.280]in your daily decision-making process.
[00:02:59.720]To ensure a robust decision-making process,
[00:03:03.200]all stakeholders in a project with our modelers,
[00:03:06.090]project managers or third parties,
[00:03:08.430]such as consultants or JV partners need to have access
[00:03:12.580]to the latest data in as near real time as possible.
[00:03:17.960]Everyone needs to work from a single source of truth
[00:03:21.770]to ensure robust analytical results that allow you
[00:03:25.950]to take the next steps in the development of your project.
[00:03:30.440]Now, this is the ideal case scenario
[00:03:33.860]but it can only be achieved if certain conditions are met.
[00:03:37.820]For example, all data needs to be consistently accessible
[00:03:42.380]no matter where the stakeholders are.
[00:03:45.550]Particularly in today’s environment during COVID-19,
[00:03:49.520]this aspect is more important than ever.
[00:03:52.320]Also the data needs to exist in a singular place
[00:03:56.390]rather than being scattered over multiple service,
[00:03:59.460]external hard drives, various computers
[00:04:01.820]and even people’s minds.
[00:04:05.240]To build that perfect holistic model,
[00:04:08.010]we also need to understand the data contextually.
[00:04:11.740]Each geoscientific group views
[00:04:13.740]and utilizes floor data differently
[00:04:16.020]and we need to be able to trace information
[00:04:18.810]from its origin through its transformation process.
[00:04:23.420]And finally, every stakeholder and modeler
[00:04:26.970]needs to have access to the team,
[00:04:29.210]ie each other’s thought processes, ideas,
[00:04:32.560]and expertise to collaboratively analyze
[00:04:36.350]and refine each other’s models
[00:04:38.640]and take the next steps together
[00:04:40.930]to arrive at a robust decision.
[00:04:46.190]Seequent modeling suites such as Oasis montaj,
[00:04:49.730]Leapfrog and Target addressing the analytical
[00:04:52.760]and modeling needs of geologists and geophysicists.
[00:04:57.490]We also partner with industry standard software providers
[00:05:00.510]to ensure consistent interoperability
[00:05:03.610]between different data sources.
[00:05:06.450]Now Central, represents our cloud hosted
[00:05:09.470]data management system
[00:05:11.130]and underpins the collaborative analytical
[00:05:14.210]and decision-making process by providing a platform
[00:05:18.000]for active communication and data tracking.
[00:05:22.560]What we wish to present to you today
[00:05:24.380]is how our products allow for a transparent flow
[00:05:28.150]of information, both physical and intellectual
[00:05:32.530]between geophysicists and geologists
[00:05:35.130]thus breaking down barriers of perceived silos
[00:05:38.430]and allowing the collective team
[00:05:40.670]to develop a true holistic model.
[00:05:46.740]The workflow we would like to demonstrate is
[00:05:49.220]how Central is used in an iterative modeling process
[00:05:53.500]that begins its journey with an early stage geological model
[00:05:57.290]developed in Leapfrog Geo.
[00:05:59.530]Here various types of spatial and numeric data
[00:06:02.910]are added from drilling, mapping, and assaying
[00:06:05.872]to develop an initial interpretation of the local geology.
[00:06:11.330]The findings, both physical and hypothetical,
[00:06:15.250]are subsequently communicated and shared
[00:06:17.840]with a geophysicist through Central.
[00:06:20.560]He or she has then an opportunity to incorporate
[00:06:24.180]geological constraints into the geophysical model
[00:06:28.180]in Oasis montaj and test various model scenarios.
[00:06:33.470]In turn, the results are version tracked
[00:06:36.210]and peer reviewed by all stakeholders
[00:06:38.980]through Central to define the next steps.
[00:06:42.660]The overall model here is rinse and repeat
[00:06:45.740]in order to iteratively and collaboratively arrive
[00:06:50.300]at a holistic model that represents
[00:06:52.650]a more realistic representation of the physical system.
[00:07:00.510]Before we jump into the active demonstration,
[00:07:04.060]let me tell you a little more about Central.
[00:07:07.180]Central is a cloud hosted system that allows you
[00:07:09.980]to interact with your data through three separate gateways
[00:07:14.400]serving different purposes.
[00:07:17.040]The Central Browser represents your active platform
[00:07:20.400]for communication, where all project stakeholders
[00:07:23.530]whether a geophysicists, geologists,
[00:07:26.160]or even hired consultants or auditors even
[00:07:29.440]can collaboratively review and comment in 3D
[00:07:33.870]on the latest model revisions derived from Leapfrog,
[00:07:37.840]and then a future Oasis montaj.
[00:07:41.160]The second gateway is the Central Portal
[00:07:44.160]and the portal’s function is threefold.
[00:07:47.270]Here the administrators of your Central cloud instance
[00:07:51.460]can set appropriate licensing and security permissions
[00:07:56.020]for each user.
[00:07:58.530]Once provided with access, each user can then go ahead
[00:08:01.900]and set up their personalized notification service
[00:08:05.900]to be consistently in the know when changes occur
[00:08:09.080]in a Central project that they are personally interested in.
[00:08:14.660]And lastly, in the portal, each Central user
[00:08:18.270]is also provided access to a project specific data room
[00:08:23.600]in which any file relevant to the project at large
[00:08:26.920]can be stored and version tracked.
[00:08:30.200]This includes of course, voxels and 2D geophysical grids.
[00:08:34.550]We’re going to show you that later on
[00:08:36.550]how that exactly works.
[00:08:38.340]And in addition, grids and meshes also referred
[00:08:42.160]to as wireframes can be dynamically pulled
[00:08:45.250]into the Leapfrog modeling suite.
[00:08:48.500]The last gateway to your stored data and models
[00:08:52.520]is through Leapfrog where the latest model versions
[00:08:56.040]can be actively retrieved and once modified,
[00:08:59.550]published back to Central for safekeeping
[00:09:02.460]and version tracking.
[00:09:04.710]So three different gateways to one smart data
[00:09:09.020]model management system that allows all types
[00:09:12.530]of stakeholders to collaboratively interact.
[00:09:16.400]Okay, so let’s have a look at it and see how it supports
[00:09:19.620]and underpins our iterative workflow.
[00:09:26.030]<v Geoff>I am now going to provide you an introduction</v>
[00:09:28.170]to the Central Browser and how it is integrated
[00:09:30.955]into Oasis montaj.
[00:09:35.280]The Central Browser is a collaboration platform
[00:09:38.090]where users can view, annotate, and access
[00:09:40.960]each other’s geological interpretations.
[00:09:44.130]When you first launch the application,
[00:09:45.760]you’ll see a list of Central servers
[00:09:47.320]that you’ve been given access to.
[00:09:49.720]The server list is automatically updated
[00:09:51.730]based on your location linked to your Seequent ID.
[00:09:55.720]Once connected to a Central server,
[00:09:57.920]a list of projects will appear
[00:09:59.330]on the right-hand side of the page displaying the projects
[00:10:02.650]that I’ve been given permission to view.
[00:10:04.950]Selecting the project I’m interested in
[00:10:07.120]takes me into the History page.
[00:10:10.320]Within the project history page,
[00:10:12.410]we can see how a model has progressed over time
[00:10:15.450]and see what has changed by who, when, and why.
[00:10:19.450]Comments are stored with each project revision
[00:10:22.370]ensuring that project knowledge is not lost as time goes by
[00:10:26.141]or as team members leave or join.
[00:10:29.840]Everything is captured in a Centralized database.
[00:10:33.420]Selecting a specific project revision exposes metadata
[00:10:36.740]around what objects are included in the project
[00:10:39.630]giving modelers fast access
[00:10:41.160]to information surrounding a model without having
[00:10:43.710]to launch a full modeling application.
[00:10:46.870]Model Annotations are a great way
[00:10:48.790]to communicate interpretation ideas in a 3D view.
[00:10:52.410]This allow modelers to jump into a scene
[00:10:54.960]and to locate themselves with the geotag
[00:10:57.000]to continue the conversation.
[00:10:59.950]In this example, we’re dealing with an early stage
[00:11:02.090]exploration project, which has a few drill holes
[00:11:04.680]intersecting a magnetic anomaly.
[00:11:07.180]From the drilling, we’ve intersected a marker horizon
[00:11:09.850]with a high magnetic susceptibility.
[00:11:12.410]However, due to the thick rock cover in the area,
[00:11:15.060]there are no outcrops to inform the structural fabric
[00:11:17.570]of this mineralization.
[00:11:19.380]And as such, my team member who is a geologist
[00:11:21.950]has built a couple of models representing scenarios
[00:11:24.530]to be tested.
[00:11:25.980]One of these models is a dipping plate,
[00:11:28.160]and the other is an anticline structure
[00:11:29.940]that both fit the drilling data.
[00:11:32.580]Both model revisions have been published
[00:11:34.240]to the Central Browser using annotations
[00:11:36.450]to ensure that my colleagues are aware
[00:11:38.440]of the various interpretations and their thinking behind it.
[00:11:42.550]Collaborators on the project are notified in real time
[00:11:45.270]when a new revision is made available.
[00:11:47.710]Team members including geophysicists can access these models
[00:11:50.850]directly to use as constraints and geophysical modeling
[00:11:54.190]within Oasis montaj.
[00:11:56.250]Here I can export the geological models
[00:11:58.260]from the Central Browser and import them into Oasis montaj.
[00:12:02.010]I can also communicate to the rest of my team
[00:12:04.160]that I’m going to test some of these hypothesis
[00:12:06.330]with geophysical modeling.
[00:12:10.520]The new release of Oasis montaj and Central
[00:12:13.170]is our first step
[00:12:14.003]in integrating multiple geoscience applications
[00:12:17.090]and allows geologists and geophysicists
[00:12:19.550]to share their modeling efforts in a Centralized data store.
[00:12:23.310]You might notice some changes to the interface.
[00:12:25.633]With the integration of Central,
[00:12:27.650]comes a new data services menu
[00:12:29.750]and a cloud icon showing the Central servers
[00:12:32.070]that you have access to.
[00:12:34.110]The newly redesigned data services menu
[00:12:36.260]now includes an upload to Central and Central portal option.
[00:12:40.500]You can also see the Cloud icon
[00:12:42.200]in the top right-hand corner.
[00:12:43.770]And this relates to the Central servers
[00:12:45.520]that have been connected to Oasis montaj.
[00:12:48.130]The server in green indicates the current connected server.
[00:12:52.921]Now, let’s have some fun.
[00:12:55.110]We have downloaded the two Leapfrog models,
[00:12:57.960]one representing the dipping plate hypothesis,
[00:13:00.560]and one representing the anticline hypothesis.
[00:13:03.960]Our plan is to test both of these
[00:13:05.820]and make a quick recommendation using geophysical modeling.
[00:13:09.500]Our first step is to import the Leapfrog models.
[00:13:12.830]This is a straightforward process.
[00:13:15.150]Once the models have been imported
[00:13:16.810]and assigned a coordinate system, we note they look the same
[00:13:20.190]as they did in the Central Browser and in Leapfrog Geo.
[00:13:24.290]To enable quick decision-making
[00:13:26.013]and easy model building process,
[00:13:28.320]we can use voxel earth modeling
[00:13:30.210]to create geophysical models of these scenarios.
[00:13:34.050]We will first perform a forward calculation
[00:13:36.570]of each of the geological hypothesis.
[00:13:40.130]The geophysical forward calculation
[00:13:42.520]uses the geological models, the ones we just imported
[00:13:46.320]and logged rock properties
[00:13:48.020]to produce a predicted geophysical response.
[00:13:51.770]In this case, a predicted magnetic response
[00:13:54.470]from hypothesis one and then again from hypothesis two.
[00:13:58.840]We can then compare the predicted and measured response
[00:14:02.450]and make an initial assessment of the two models.
[00:14:07.470]I have already created a quick voxel project
[00:14:10.130]from our project boundary.
[00:14:12.670]We can see our model mesh.
[00:14:15.020]Now we just need to insert our geological hypothesis
[00:14:18.260]and assigned rock properties.
[00:14:20.380]In this case, marks us from our logged core.
[00:14:24.270]We can use our constraint builder within voxel
[00:14:26.800]to build a starting model.
[00:14:28.790]I’m going to start with the anticline model
[00:14:31.290]and the iron formation mesh.
[00:14:34.040]Next I will assign rock properties inside
[00:14:36.770]and outside and then click okay.
[00:14:39.870]For this initial model, I’m keeping it simple,
[00:14:42.700]but we can add as many meshes
[00:14:44.100]and assign complex rock properties as needed.
[00:14:48.060]I can click okay and observe my starting model.
[00:14:51.400]When I’m ready, I can run this forward model.
[00:14:55.170]These calculations run in the cloud
[00:14:57.010]and only take a couple minutes
[00:14:58.680]with the results downloaded to your machine.
[00:15:02.090]I will repeat this process for the dipping plate model
[00:15:05.560]again, creating a predicted response from each hypothesis.
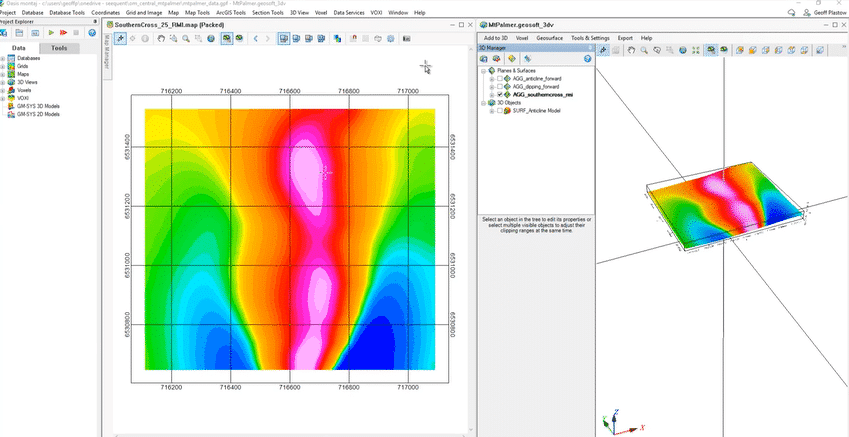
[00:15:10.890]Now let’s compare the predicted results from voxel
[00:15:14.350]and the real measured magnetic data.
[00:15:18.730]On the left side of the screen,
[00:15:20.080]we have the predicted magnetic response
[00:15:22.150]from the anticline model.
[00:15:24.170]On the right side of the screen,
[00:15:25.550]we have the predicted response from the dipping plate model.
[00:15:29.100]When we compare with the real measured magnetic data,
[00:15:32.400]neither are an exact fit, but that’s okay,
[00:15:35.530]we are just testing different hypothesis.
[00:15:38.150]We’re looking at general characteristics shapes
[00:15:40.480]and wavelengths of the magnetic data.
[00:15:42.890]From this initial model testing the dipping plate
[00:15:45.431]although it has a slight variation and strike
[00:15:48.400]appears to be more in line with the measured data.
[00:15:51.460]When we have more data, we can always revisit
[00:15:54.080]and reiterate on these ideas.
[00:15:57.370]Again, now we can jump back into voxel
[00:15:59.940]and this time we will invert our measured magnetic data.
[00:16:03.560]The geophysical inversion will recover
[00:16:05.500]a susceptibility model we can use
[00:16:07.290]for planning additional exploration work.
[00:16:10.380]We will invert the magnetic data with
[00:16:12.600]and without geological constraints and log properties
[00:16:15.720]to further explore our solution space.
[00:16:18.997]We can adjust our starting model,
[00:16:21.460]and now we can create a constraint
[00:16:23.930]called the parameter reference model,
[00:16:25.620]which will reinforce the desired orientation
[00:16:28.420]and rock property values.
[00:16:30.750]We’ll use our dipping plate model and again rock properties,
[00:16:34.510]and when we’re ready to run the model, we can do so.
[00:16:38.560]Again, with voxel these calculations occur in the cloud
[00:16:42.190]and only take a few minutes.
[00:16:44.610]Here we have the magnetic conversion results from voxel.
[00:16:47.920]On the left-hand side, we have the unconstrained
[00:16:50.510]inversion results and on the right-hand side,
[00:16:52.810]we have the constrained inversion results.
[00:16:56.180]We can see that both the unconstrained
[00:16:58.110]and constrained results resolve the dipping iron formation
[00:17:01.610]with the constraint and version on the right
[00:17:03.320]being a more discreet and compact body.
[00:17:06.410]I’ve gone ahead and created a few quick magnetic
[00:17:08.540]susceptibility section from these results.
[00:17:10.770]And I will now share these with my team
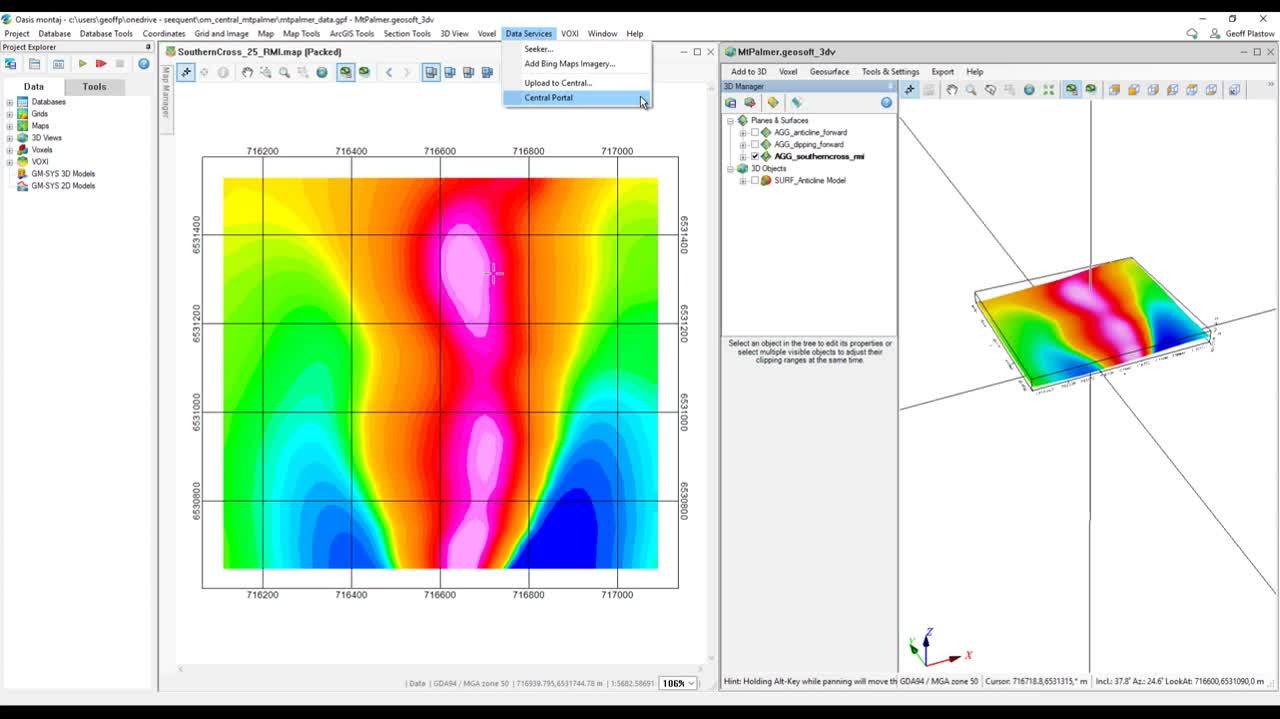
[00:17:12.370]by uploading them to Central.
[00:17:14.220]I can click data services upload to Central.
[00:17:17.200]Here I’ll see a list of grids and voxels I can upload,
[00:17:20.880]and I can select the Mount Palmer project
[00:17:22.980]and my constrain grids I want to upload.
[00:17:25.350]The upload will only take a moment.
[00:17:27.800]I can also upload grids and voxels directly
[00:17:30.470]from the project explorer in Oasis montaj
[00:17:32.880]by right clicking and uploading to Central.
[00:17:36.260]These results have now been uploaded
[00:17:37.923]and we can take a quick look at the Central portal.
[00:17:41.990]Once I click the Central portal menu option
[00:17:44.370]in Oasis montaj, the Central portal will open
[00:17:47.240]in my web browser.
[00:17:49.080]The Central portal is a web based user
[00:17:51.330]and project management application.
[00:17:53.780]From the portal, you can actively manage all
[00:17:55.980]of your projects in one place
[00:17:57.740]and store all of your files related to your project
[00:18:00.420]with Central’s version tracking capabilities.
[00:18:03.340]As an administrator, you can control access
[00:18:05.700]and permissions and clearly see who you can share
[00:18:08.520]and exchange information with your team.
[00:18:11.230]On the main page, we’ll see a thumbnail
[00:18:13.120]of all of my projects, and I can quickly search
[00:18:15.500]for a project to find what I’m looking for.
[00:18:18.760]Once I select my project,
[00:18:20.330]I’m taken to the project overview tab
[00:18:22.860]where we can see a brief description of the project,
[00:18:25.300]it’s revisions, and recent events pertaining
[00:18:27.780]to this project.
[00:18:29.750]In the User tab, we can see the users
[00:18:32.190]that currently have access to this project.
[00:18:35.000]If you’re an admin, you can change the permissions
[00:18:37.361]and grant additional access to your team.
[00:18:40.630]If you have owner status, you can invite others
[00:18:43.410]to the project and also set permission levels.
[00:18:46.810]In the Files tab, we call this the Data Room.
[00:18:50.060]This is the shared data repository for our team.
[00:18:53.580]We can upload files directly from our computer
[00:18:56.560]or upload grids and voxels from Oasis montaj
[00:18:59.940]and then pull these into Leapfrog projects.
[00:19:02.960]There’s no file size or upload limit
[00:19:05.410]so the space can really accommodate
[00:19:07.100]all project specific data.
[00:19:09.420]I can move files around the data room
[00:19:12.000]and it can be structured into folders.
[00:19:14.400]What’s really great is I can click on a file
[00:19:16.640]and see its properties, including the size,
[00:19:19.630]number of revisions and I can see the revision history
[00:19:23.270]and I can always roll back to a previous version of my file.
[00:19:29.540]<v Janina>One of the great advantages</v>
[00:19:31.610]of the portal environment is that all Central users
[00:19:35.440]can subscribe to a project specific notification service.
[00:19:40.630]As such I received an instant message
[00:19:43.180]as soon as my colleague Geoff created an annotation
[00:19:46.060]in the browser.
[00:19:47.900]This node, which can be found here
[00:19:50.040]under the little clock symbol, informed me that
[00:19:53.114]additional geophysical data would be available shortly.
[00:19:57.140]This is fantastic as it lets me know right away
[00:20:00.150]when to take action and to incorporate the latest data
[00:20:03.410]into my model.
[00:20:04.880]Now, how do these notifications work exactly?
[00:20:08.106]Let’s have a look at the preference settings.
[00:20:11.568]Each Central user can first decide
[00:20:14.416]which project they’re interested in
[00:20:16.930]and further customize the notifications
[00:20:19.280]by deciding what type of information they require.
[00:20:23.700]For example, you can choose to be notified
[00:20:26.400]when user permissions change,
[00:20:28.600]new revisions of Leapfrog models are uploaded,
[00:20:31.300]or comments are made in the browser.
[00:20:34.630]Both are particularly handy
[00:20:36.870]as they allow all project stakeholders to be instantly aware
[00:20:40.750]when the expertise is required or new data is available.
[00:20:45.110]This truly enhances the efficiency and productivity
[00:20:47.780]of a team as well as breaking down barriers.
[00:20:51.720]The last setting is arguably one of the most important ones
[00:20:55.300]as you can decide how you wish to be notified.
[00:20:58.510]Nobody wants to receive more emails than they already do
[00:21:02.130]so you can choose whether you would like
[00:21:04.180]to be alerted in app or by an email.
[00:21:08.180]Okay, now that the new constraint marks as grids
[00:21:12.930]are loaded in the Central data room,
[00:21:15.470]I can then go ahead and take the next steps
[00:21:17.880]in my geological model.
[00:21:19.990]I can either export the files directly from here,
[00:21:22.810]being completely certain
[00:21:24.340]that they truly represent the latest versions
[00:21:27.020]or alternatively, I can access the very same files directly
[00:21:31.610]through the Leapfrog modeling application.
[00:21:33.630]And that is what I’d like to show you now.
[00:21:39.490]This is Leapfrog Geo and as you can see,
[00:21:42.230]the application can be directly linked to Central.
[00:21:45.710]Once connected to the appropriate server and project,
[00:21:49.320]the entire version history and commentary
[00:21:52.850]as previously observed in the browser becomes visible.
[00:21:56.830]This is great as it allows me to dive directly
[00:22:00.340]into my team’s ongoing conversation
[00:22:03.150]and react to the ideas and instructions.
[00:22:07.270]When clicking on the thumbnail,
[00:22:09.270]I’m automatically directed to the scene view tab,
[00:22:12.820]which has loaded all relevant objects
[00:22:14.850]supporting the current conversation.
[00:22:18.010]Before I go ahead though and upload Geoff’s files
[00:22:20.680]from the Central Data Room, I’d like to provide you
[00:22:23.320]with a small introduction to Leapfrog Geo.
[00:22:28.830]Seequent Leapfrog modeling suite allows the user
[00:22:32.150]to dynamically build 3D geological models
[00:22:35.788]using an implicit modeling engine.
[00:22:40.210]What happens is that each x-rays is at point whether derived
[00:22:44.200]from drilling or other invasive or non-invasive methods
[00:22:48.640]can be loaded into the respective folders
[00:22:51.300]seen on a project tree here.
[00:22:53.610]Then they’re linked to a geological model
[00:22:56.440]where they are placed in a relative stratigraphic
[00:22:59.230]or structural context.
[00:23:01.930]With the assistance of the fast radial basis function,
[00:23:05.970]a mathematical algorithm are keen to dual kriging
[00:23:09.750]a best fit surface is created
[00:23:12.700]that can then be manually refined by the modeler.
[00:23:17.560]As soon as new data is imported, it is directly added
[00:23:21.930]to the existing model through dynamic links
[00:23:24.870]in the project tree.
[00:23:26.950]The modelers updates instantly,
[00:23:29.560]and the resulting interpretation can be reviewed
[00:23:32.690]and be refined by the modeler.
[00:23:36.530]Due to this functionality, models can be generated
[00:23:39.810]very quickly and the safe time allows the user
[00:23:43.470]to create and test multiple geological interpretations
[00:23:47.780]as observed here.
[00:23:52.210]So let’s import the constraints
[00:23:54.520]2D magnetic susceptibility grids to identify
[00:23:58.070]which geological interpretation is more realistic.
[00:24:01.710]The inclined slab of hypothesis one
[00:24:04.740]or the anticline of hypothesis two.
[00:24:08.540]As mentioned earlier, the data files stored
[00:24:11.280]in the Central data room can be instantly access
[00:24:14.940]through the Leapfrog modeling application.
[00:24:17.890]How is this done?
[00:24:19.700]Just navigate to the geophysics data folder,
[00:24:23.280]right-click and choose to import 2D grids from Central.
[00:24:28.420]Here you can access any Central project
[00:24:31.220]you’ve been given permission to.
[00:24:34.660]Once selected, you have the option to either upload 2D grids
[00:24:38.980]from previously stored Leapfrog projects,
[00:24:41.730]or when clicking the Files tab to load them directly
[00:24:45.510]from the Central data room.
[00:24:48.300]The files we see here are the latest ones version tracked
[00:24:52.680]into Central data room, making it easy to access
[00:24:56.300]the latest information rather than having to fumble
[00:24:59.610]for a file called final, final, final, final version two.
[00:25:04.510]I have gone ahead now and preloaded these files.
[00:25:08.260]Okay, let’s drag them in and observe
[00:25:10.950]how they fit the existing geological interpretations.
[00:25:15.620]The nice thing about the upload and import
[00:25:18.660]through Central is that you do not have to worry
[00:25:21.750]about the color gradients used.
[00:25:24.440]Whichever color format you applied in Oasis montaj
[00:25:28.010]is remembered and preserved.
[00:25:31.160]Should you have 2D grids derived from different projects
[00:25:34.420]with varying colors gradients and schemes,
[00:25:38.170]then you have the option to export a Leapfrog color file
[00:25:41.810]or LFC file that can be subsequently applied
[00:25:45.640]to the other grids or even voxel block models
[00:25:49.550]that can be loaded into the block models folder
[00:25:51.940]in Leapfrog as shown here.
[00:25:55.250]Another option is to load a variety of color gradients
[00:25:58.920]including the Geosoft TBL file,
[00:26:02.160]through the color gradient folder.
[00:26:06.950]So let’s have a look at the model.
[00:26:10.100]The constraint magnetic susceptibility inversion
[00:26:13.140]clearly supports the slab hypothesis
[00:26:16.230]over the anticlinal interpretation.
[00:26:19.530]It does imply however, a steeper angle
[00:26:22.560]or even a slight upward forwarded structure.
[00:26:26.520]Based on this improved understanding of the local geology,
[00:26:30.230]the next steps can be taken
[00:26:32.200]and a new drilling campaign designed.
[00:26:35.380]The results of this campaign will then allow
[00:26:37.800]for a refinement of the slab mesh,
[00:26:40.930]which in turn will provide a better constraint
[00:26:43.700]for the geophysical model and so on.
[00:26:48.960]Before going ahead though, this important decision
[00:26:52.110]in the evolution of the project needs to be preserved
[00:26:55.740]and communicated to all stakeholders.
[00:26:59.560]To do so, we need to publish the project back to Central
[00:27:03.650]for safekeeping and outfit it
[00:27:06.000]with the appropriate commentary
[00:27:07.840]to inform the team of the decision made.
[00:27:12.000]One of the most important aspects of the publication process
[00:27:16.140]is that it will not require the full size project
[00:27:19.570]to be loaded every single time.
[00:27:22.360]At Seequent, we’re quite aware that bandwidth
[00:27:25.550]and overall internet connectivity
[00:27:28.050]can be a challenge to our customers.
[00:27:30.650]Therefore, we’ve built the technology that recognizes
[00:27:34.130]on each upload and download what the incremental changes are
[00:27:39.410]relative to an existing base model.
[00:27:42.030]And only the Delta is transmitted in small chunks.
[00:27:47.110]Thus, the file sizes are kept really small,
[00:27:50.540]data space is preserved,
[00:27:52.720]and information can be submitted quickly
[00:27:55.640]no matter where you are.
[00:27:58.870]Once published, everyone subscribed to this project
[00:28:02.090]will receive an instant notification
[00:28:04.630]that a new version of the project is available
[00:28:07.670]for their review in the Central browser.
[00:28:10.660]And that keeps everyone in the know in real time.
[00:28:14.390]Okay, let’s have a look at the browser then.
[00:28:20.140]Okay, we’re now back in the Central Browser
[00:28:23.610]where our journey begun earlier.
[00:28:26.070]The approved model version I just published is now available
[00:28:30.880]for peer review by my colleagues.
[00:28:34.120]To make sure that all project stakeholders
[00:28:36.171]even the non-technical ones can easily navigate the model
[00:28:40.760]and understand exactly the reasoning for our decisions,
[00:28:45.040]I will quickly create a 3D view and matching annotation.
[00:28:49.900]For this I will click the annotations button,
[00:28:52.640]preserve the scene and all the required objects
[00:28:55.810]in the right orientation and at my comment.
[00:29:02.060]I prepared a comment a little earlier.
[00:29:04.100]I’m going to paste it in here now and here we go.
[00:29:08.980]The other important aspect of this comment is
[00:29:12.100]that it adds directly to the continued audit trail.
[00:29:16.480]Important decisions that mark a turning point
[00:29:19.420]in a project need to be clearly documented
[00:29:22.870]so that you can easily demonstrate the why and how
[00:29:26.510]not only to the next generation of team members,
[00:29:29.920]but also auditors and potential business partners.
[00:29:35.350]Okay, and this concludes the demonstration component
[00:29:39.260]of our webinar, let’s have a look at the summary.
[00:29:46.110]So what does this integrated workflow
[00:29:48.610]between Oasis montaj and Central bring to the table?
[00:29:52.830]What are the benefits?
[00:29:55.290]The combined use of the products allows a team
[00:29:58.060]of geoscientist to truly collaborate,
[00:30:01.070]break down barriers and make confident decisions
[00:30:04.490]together faster, particularly by being able
[00:30:07.580]to notify all stakeholders in real time
[00:30:10.660]and by providing direct access to each other’s data,
[00:30:14.220]when it’s needed the team can arrive
[00:30:16.770]at important decisions faster.
[00:30:20.070]The proposed workflow also enhances a team’s efficiency
[00:30:24.130]through the ability to track, understand,
[00:30:26.930]and link peer reviewed modeling changes.
[00:30:31.620]The removal of redundancies
[00:30:33.500]through a more standardized process
[00:30:35.930]using intuitive technologies and practices
[00:30:38.750]allows for greater team productivity.
[00:30:42.560]Coherent data flow and transparency
[00:30:45.170]of the decision-making process provides the team
[00:30:47.850]with an opportunity to learn what has changed,
[00:30:50.950]why it has changed over time and how to fix it,
[00:30:54.380]thus reducing risks.
[00:30:56.570]And lastly, be able to create a coherent audit trail,
[00:31:01.010]provide security to the organization as a whole.
[00:31:07.200]<v Geoff>If this has spiked your interest,</v>
[00:31:08.920]please don’t hesitate to get in touch with us.
[00:31:11.430]It’s easy, just visit our website and sign up
[00:31:14.030]for our 60-day trial for you and your team.
[00:31:17.780]If you are already a customer,
[00:31:19.620]this functionality is available to you now.
[00:31:22.210]Feel free to reach out for more information.
[00:31:25.802]Thanks again for your time today,
[00:31:27.940]we look forward to hearing from you.