


Why correlate and interpret boreholes?
One common issue encountered in the geologic world is the need to make geologic interpretations of existing data. In many cases, it is necessary to correlate between boreholes and geophysical data as part of the data gathering and analysis phase of a project. Whether you only have resistivity logs or full CPT data, the need to apply geologic correlations between numeric and geologic data sets is a common theme in our industries. You might be dealing with old borehole logs combined with more recent CPT data or geophysical investigations. In Leapfrog Works, the borehole correlation tool allows you to correlate boreholes and other data sources in order to create an interpretation table within Leapfrog that can be used to generate models.
What is the borehole correlation tool?
The borehole correlation tool is a feature in Leapfrog Works that is often unknown or underutilized. The following How To article will highlight the benefits of this feature and address how it might improve and accelerate your workflow.
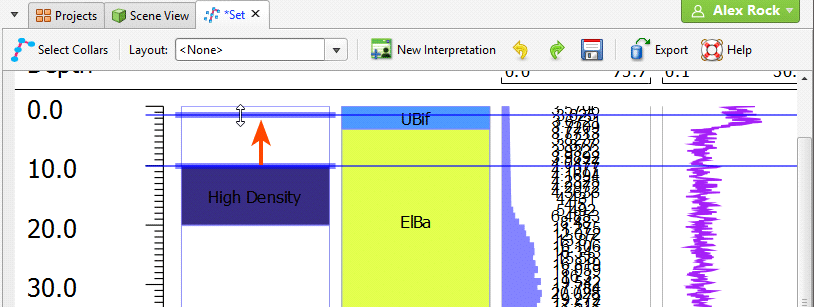
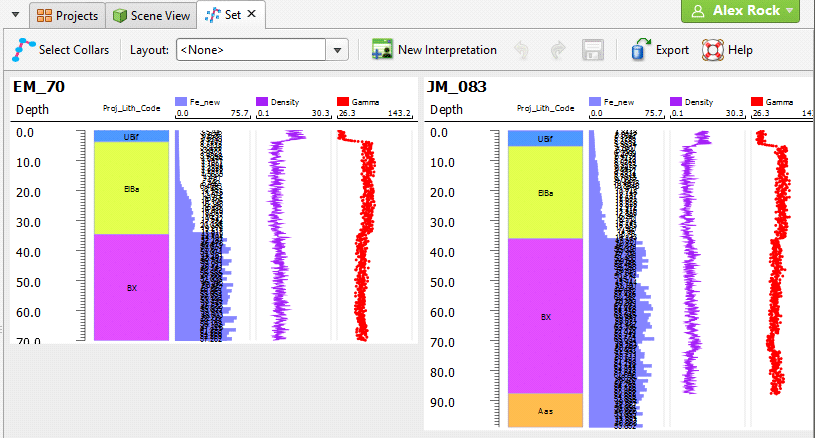
When analyzing data for a project, you will often receive input data from multiple sources. It’s important to correlate this data for the most efficient and accurate modelling results. With the borehole correlation tool, you can view and compare selected boreholes in a 2D view. You can then create interpretation tables in which you can assign and adjust intervals or create new intervals. Interpretation tables are like any other interval table in a project and can be used to create models. You can also save, and export correlation set layouts and styles to use in other Leapfrog Works projects.
How do you use the borehole correlation tool?
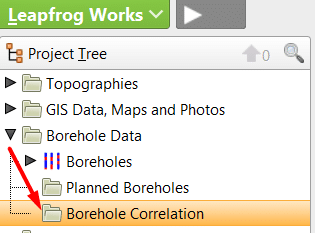
The borehole correlation tool is located in the Borehole Data folder, within a subfolder named Borehole Correlation. You can access this with the power of right click and create a New Borehole Set. The first step in the process is selecting the collars you’d like to correlate. You will then drag any interval tables you want to correlate into the correlation set window, the same process as dragging your boreholes into the 3D scene. Once you have the desired columns in your correlation set window, you can create a new interpretation column which can then be used to model from or export this back to your data base.
For more detailed steps on correlating boreholes and creating an interpretation table in Leapfrog please visit our help guide here.
These examples of how to use the tool are just to get you started. Have you used the borehole correlation tool before? Have you created an interpretation table in Leapfrog? We always like to hear from you, so please feel free to get in touch with the team at [email protected].