The new interactive gridding feature in Oasis montaj and Target 2021.2 is a powerful tool that streamlines gridding algorithms into one single tool to further enhance speed and flexibility. This technical blog will walk through the key highlights of this new feature.
Easily access your favorite gridding tools from one convenient location
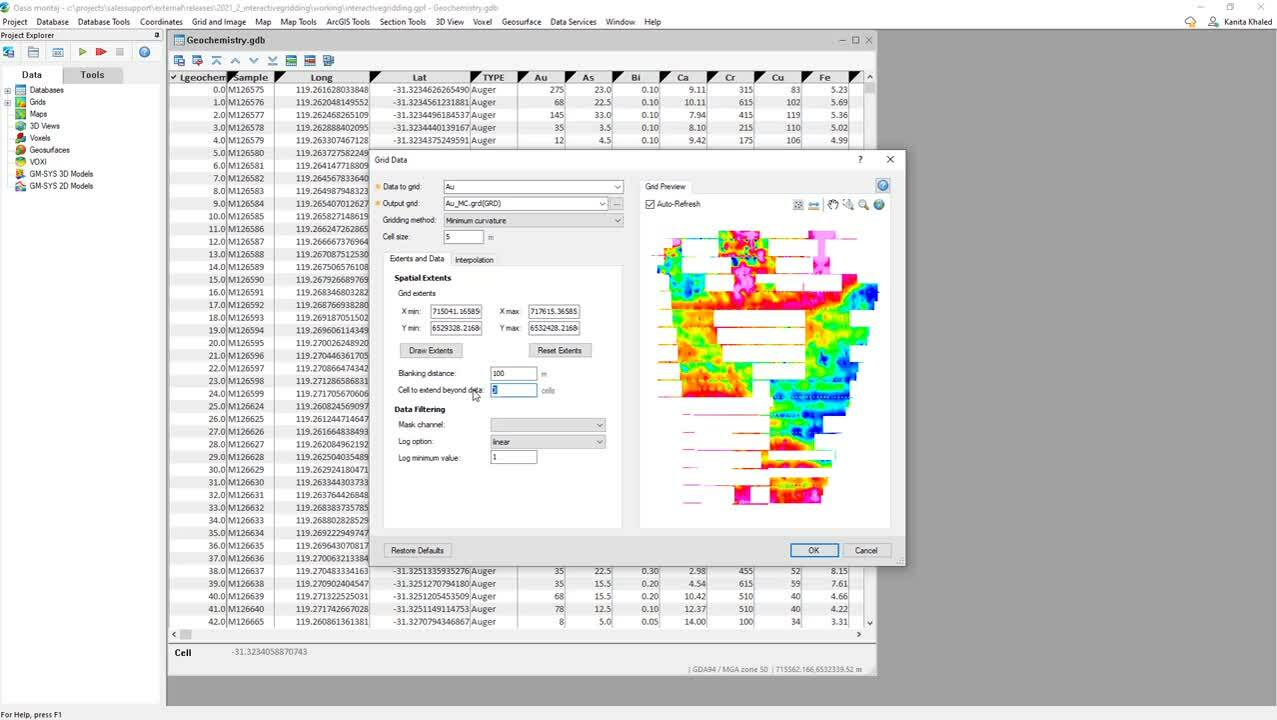
Now, you can quickly access the top 5 gridding methods in Oasis montaj and Target from the single, interactive Grid Data tool.
The gridding methods include Minimum Curvature, Bi-directional, Kriging, Inverse Distance Weighted, and Direct. Note that we have not modified any of the inherent gridding algorithms, so you still can continue to use existing gridding parameters (i.e., spatial extents, interpolation) the same way as previous versions.
Now, you can easily switch between gridding methods to assess which technique best suits your data type, get an instant preview of the grid, and fine-tune your parameters accordingly. This saves a significant amount of time that is spent going back and forth creating several grids and comparing them to see which method yields the best results.
New interactive Grid Data tool contains five common gridding methods in Oasis montaj
Save time by previewing the grid before creation
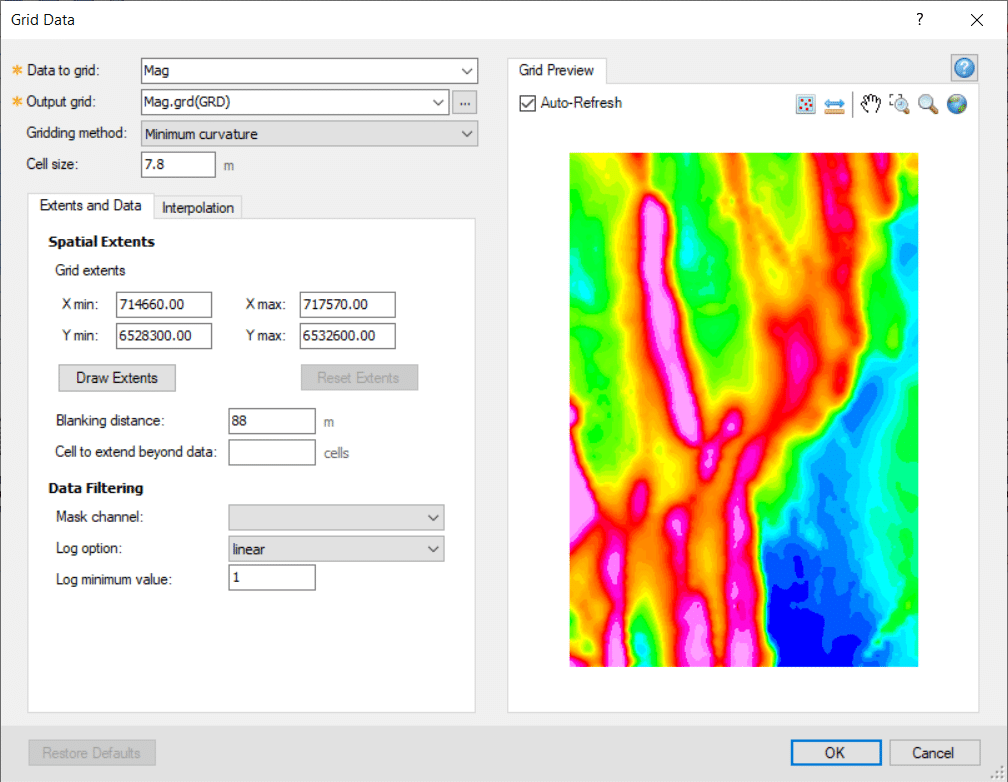
The live Grid Preview panel allows you an interactive view of the resultant grid based on the specified gridding methods and pertinent parameters. Auto-Refresh option ensures an automatic update in the previewed grid each time a parameter is changed.
We also included convenient toggle tools such as Show Points, Measure Distance, Pan, and multiple Zoom options in the Grid Preview tab.
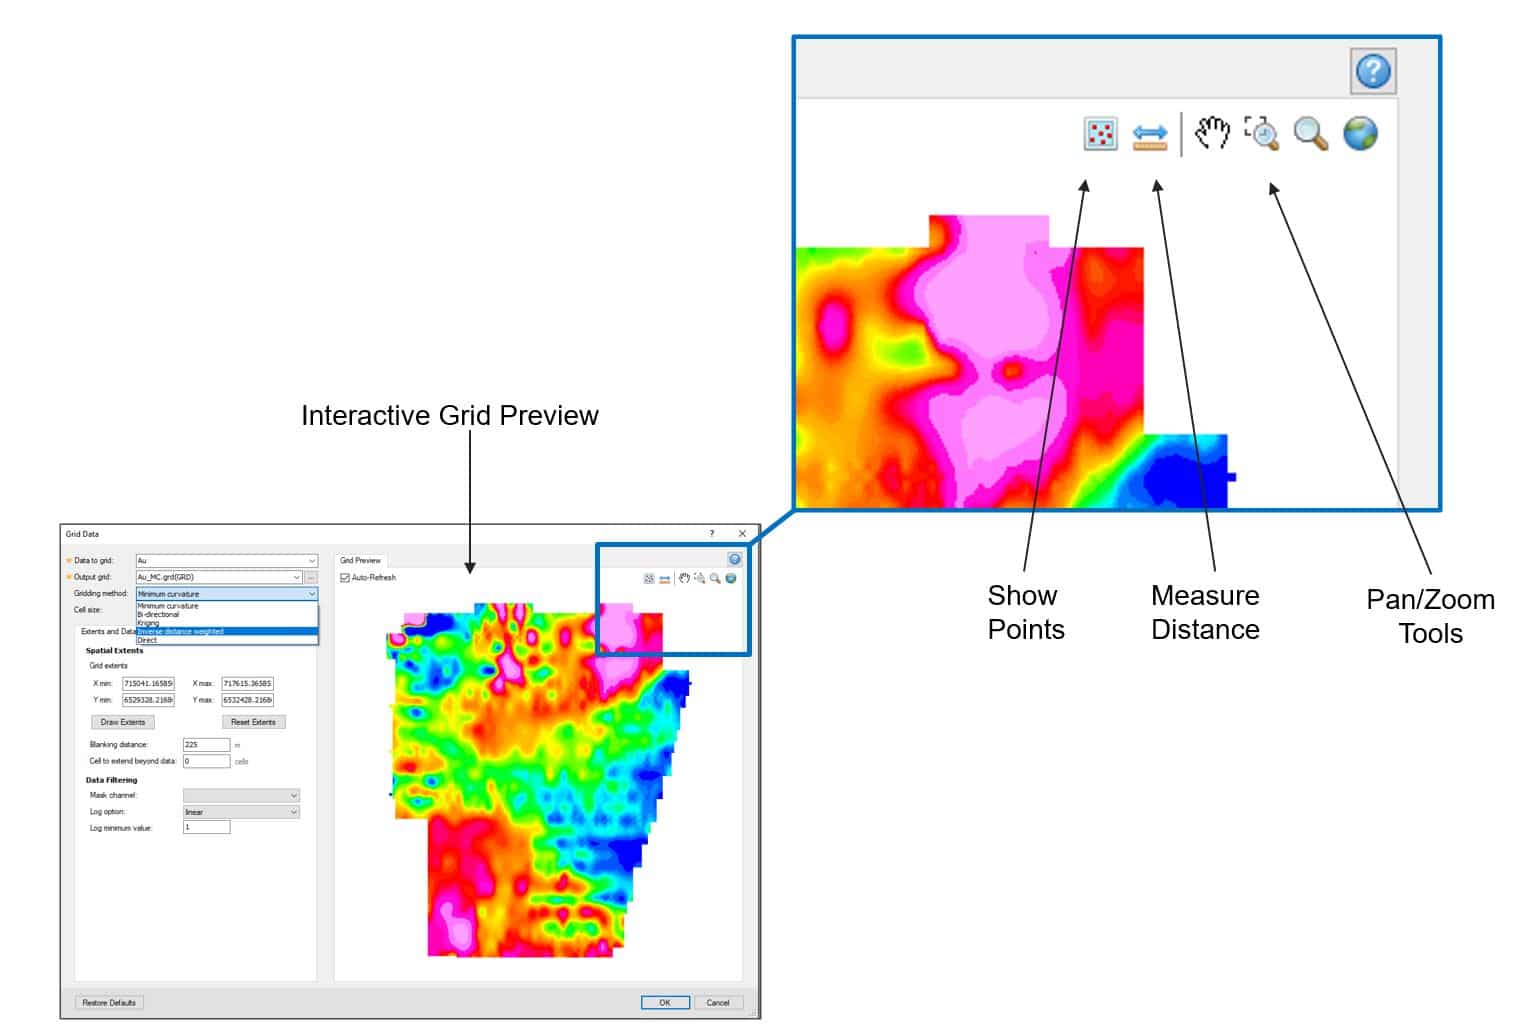
Easy-to-use tools in the Grid Preview tab
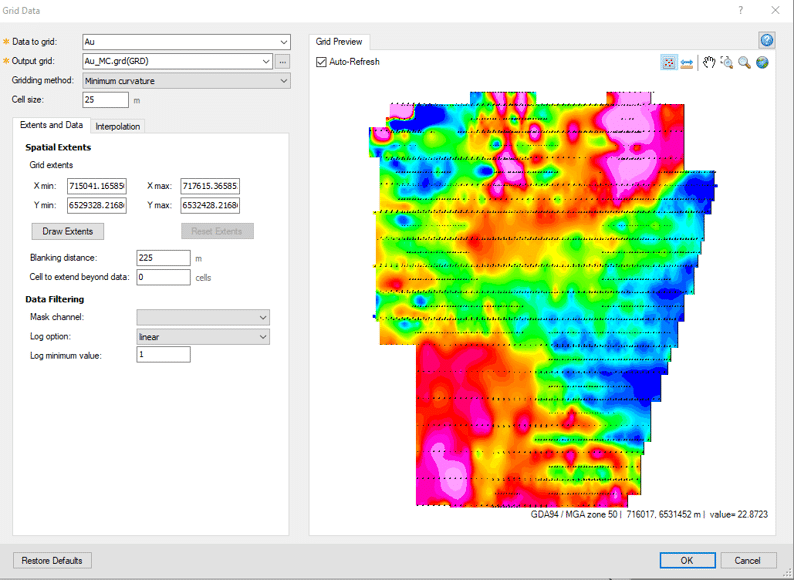
If the gridded data has a coordinate system assigned, it can be quickly obtained from the bottom right corner of the grid preview tab. Hovering anywhere on the previewed grid will instantly update the exact spatial coordinates and data value at the cross-hair cursor location.
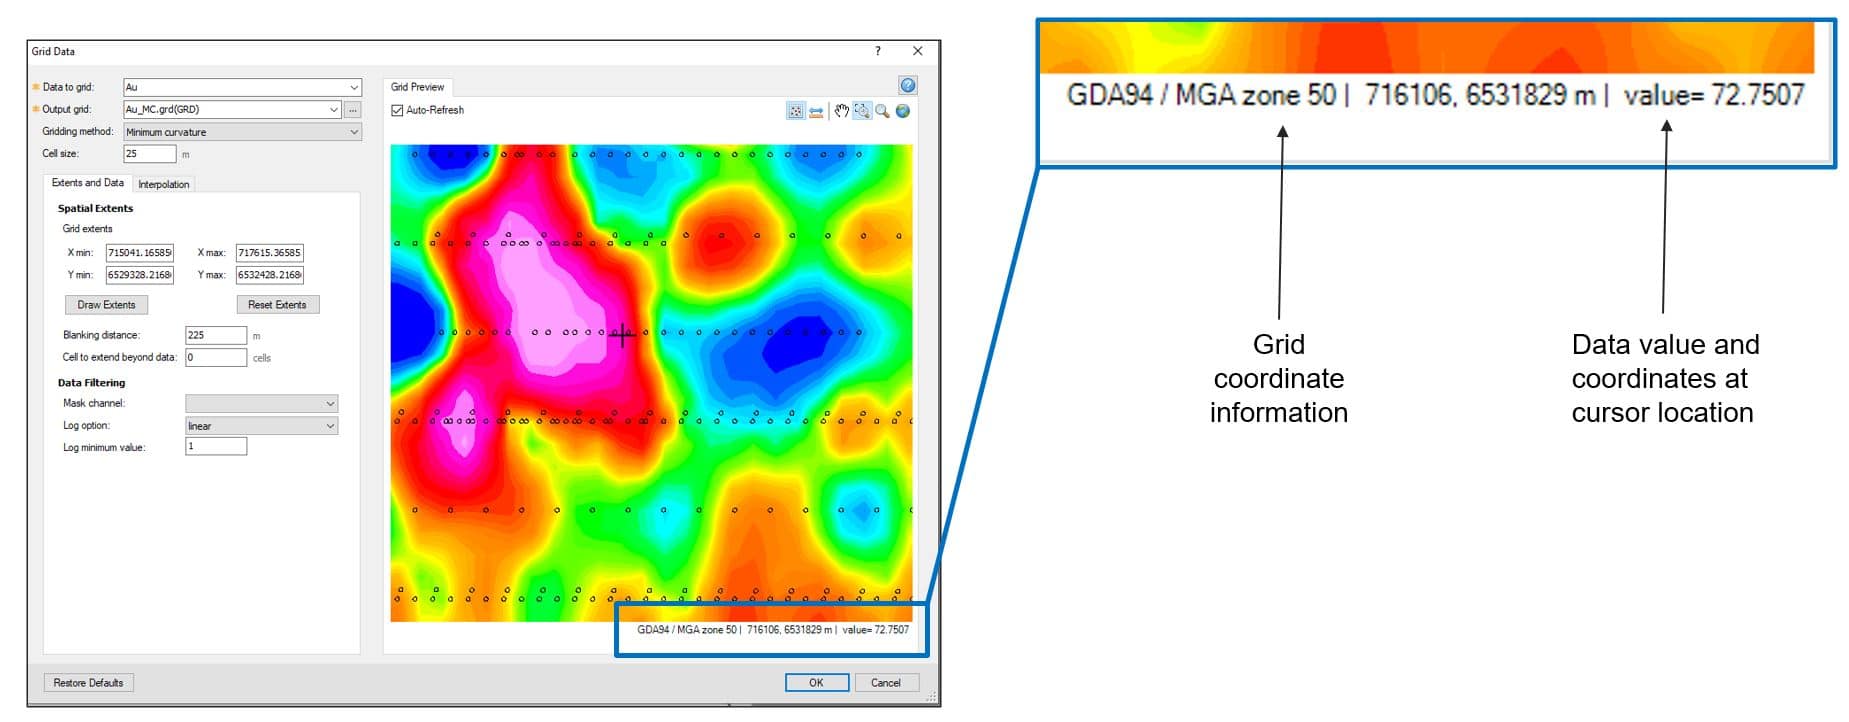
Visualise grid coordinates, data value and coordinates at the cursor location within Grid Preview
Get a better understanding of data distribution using Show Points
The show points tool in the Grid Preview tab allows you to toggle on and off the location outline of each measured data point. This allows you to gain rapid understanding of data distribution and survey design, so that you can make informed decisions about the applied gridding parameters.
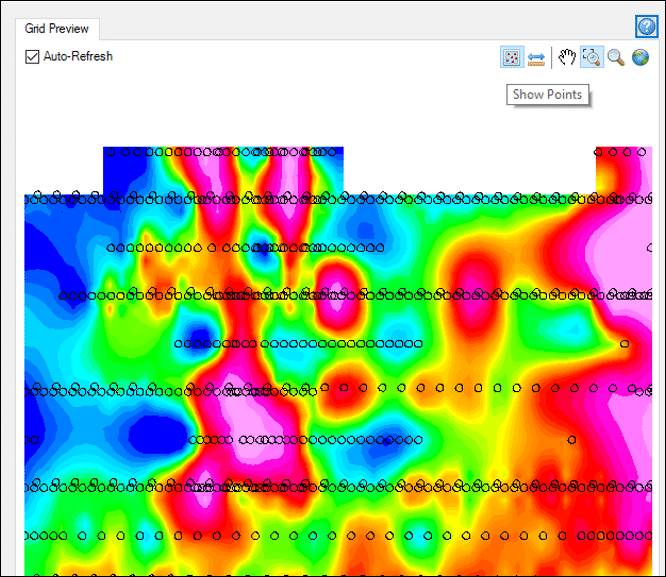
Show Points tool outlines the spatial location of measured data points
Easily grid a portion of your data without windowing the original dataset
The Draw Extents tool in the Extents and Data tab allows you to interactively draw an outline of the area of interest and create a grid using only the newly specified extents.
This is a speedy way to grid a portion of your data, without needing to window, mask or subset the original database based on spatial extents. Once you are done, simply use the Reset Extents tool to return to the full extent of the original dataset.
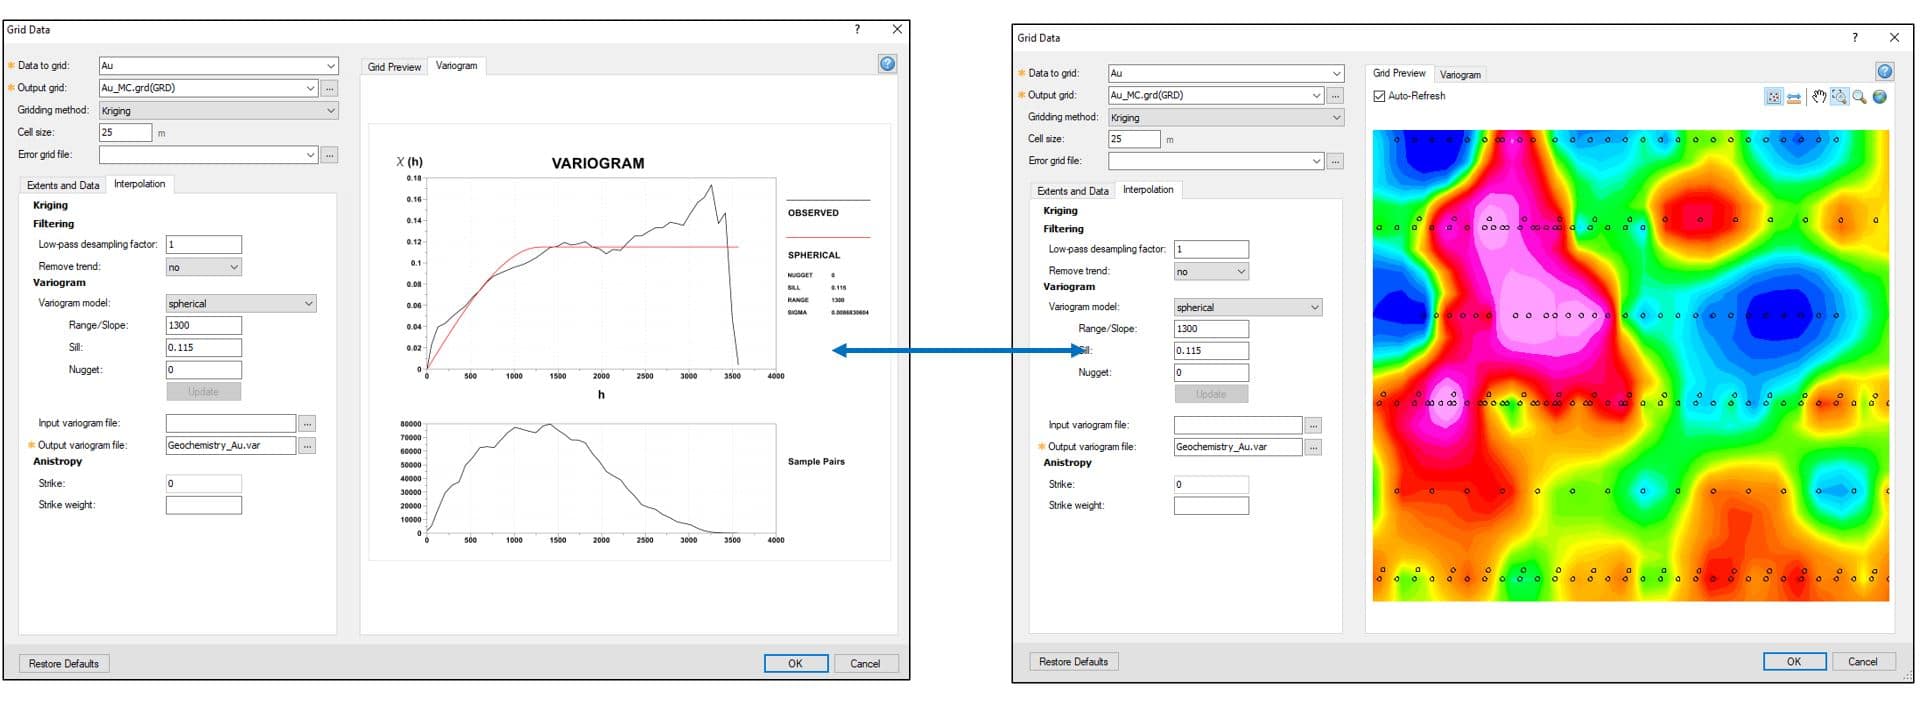
Dynamically adjust Kriging parameters using the integrated variogram tab
You can visualise and adjust changes in the variogram parameter right within the Grid Data tool when using the Kriging method. Each time you adjust key parts of the model parameter, such as the model type, range/slope, sill or nugget values, you can quickly visualise the updated variogram model.
Since this feature is now fully integrated within the Grid Data tool, you can conveniently switch between the variogram model and grid preview modes to assess how the parameters affect the output grid, without creating several grid files in between each change.