Improvements to the Gravity & Terrain Correction Extension allow for a more intuitive user interface that brings a new level of control to your workflow. You can now perform custom Free Air corrections, batch apply averaging, and get better direction on the most appropriate Bouguer density.
Easily re-calculate Earth tide corrections
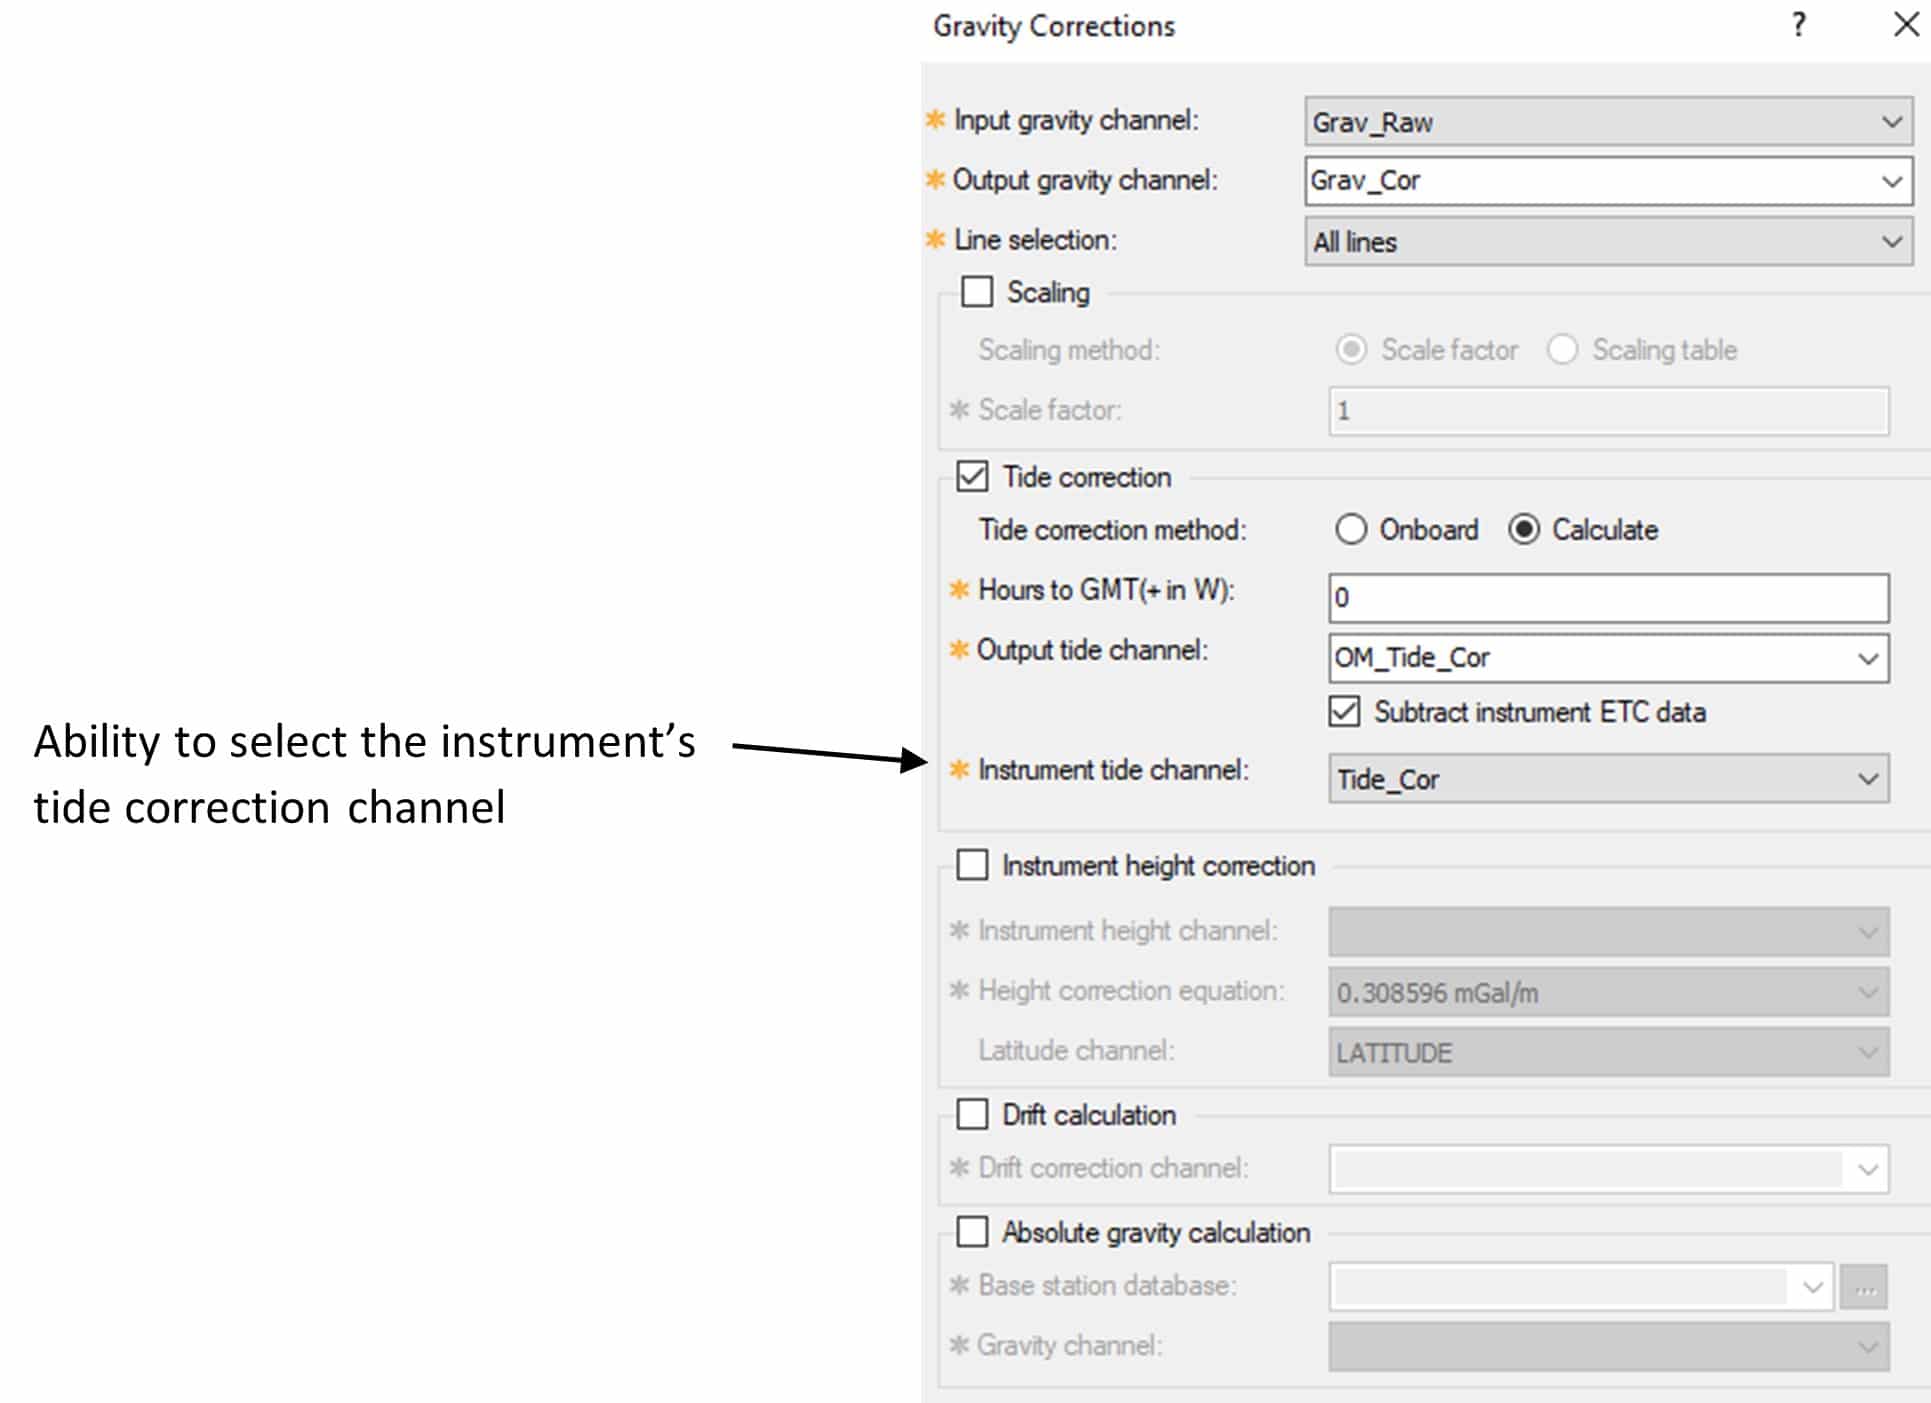
Now, if you wish to re-calculate the tide correction, you can select the instrument’s tide correction channel, subtract it, and re-apply a more precise correction in one quick and easy step. This gives you more processing control and increases your confidence in the accuracy of the corrected gravity measurements.
Save time by averaging repeats in multiple channels simultaneously
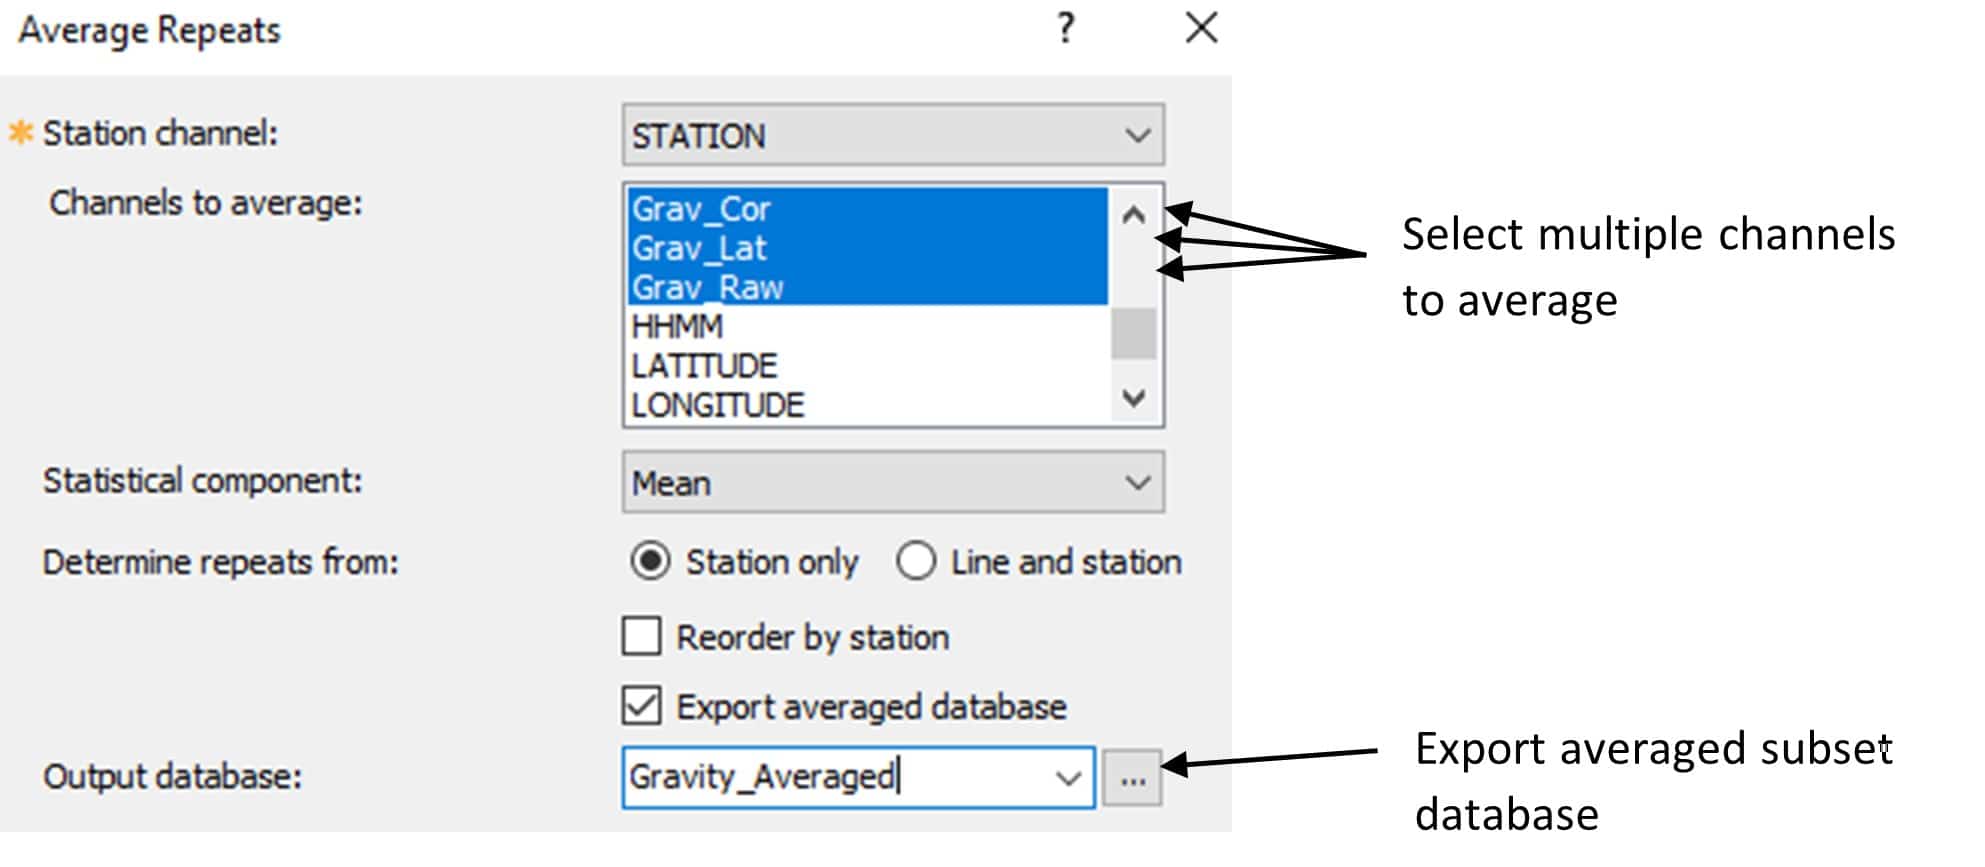
Now, you can average data from multiple channels at the same time. The updated menu also gives you the option to export a subset database of the averaged data. This will remove unwanted dummies and make the data easier to analyze.
Apply custom free-air and latitude corrections
Additional free-air and latitude correction formulae can now be defined and applied. You can correct the elevation of a measurement point to a custom datum and use an alternative reference spheroid model in the latitude correction. This allows you to appropriately correct the data for your survey area.
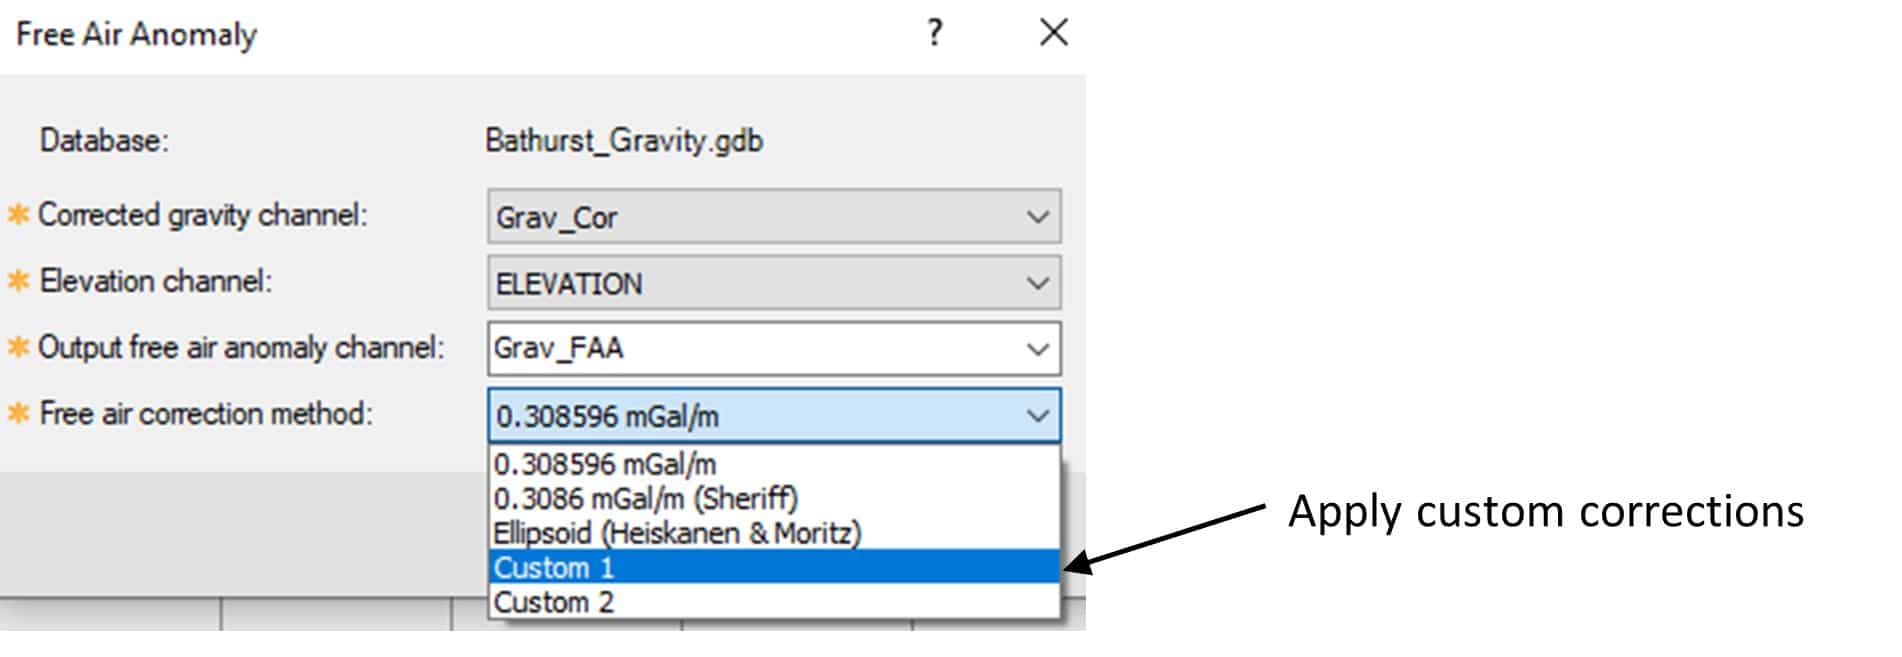
More information on how to add custom equations can be found in the Oasis Montaj Application Help.
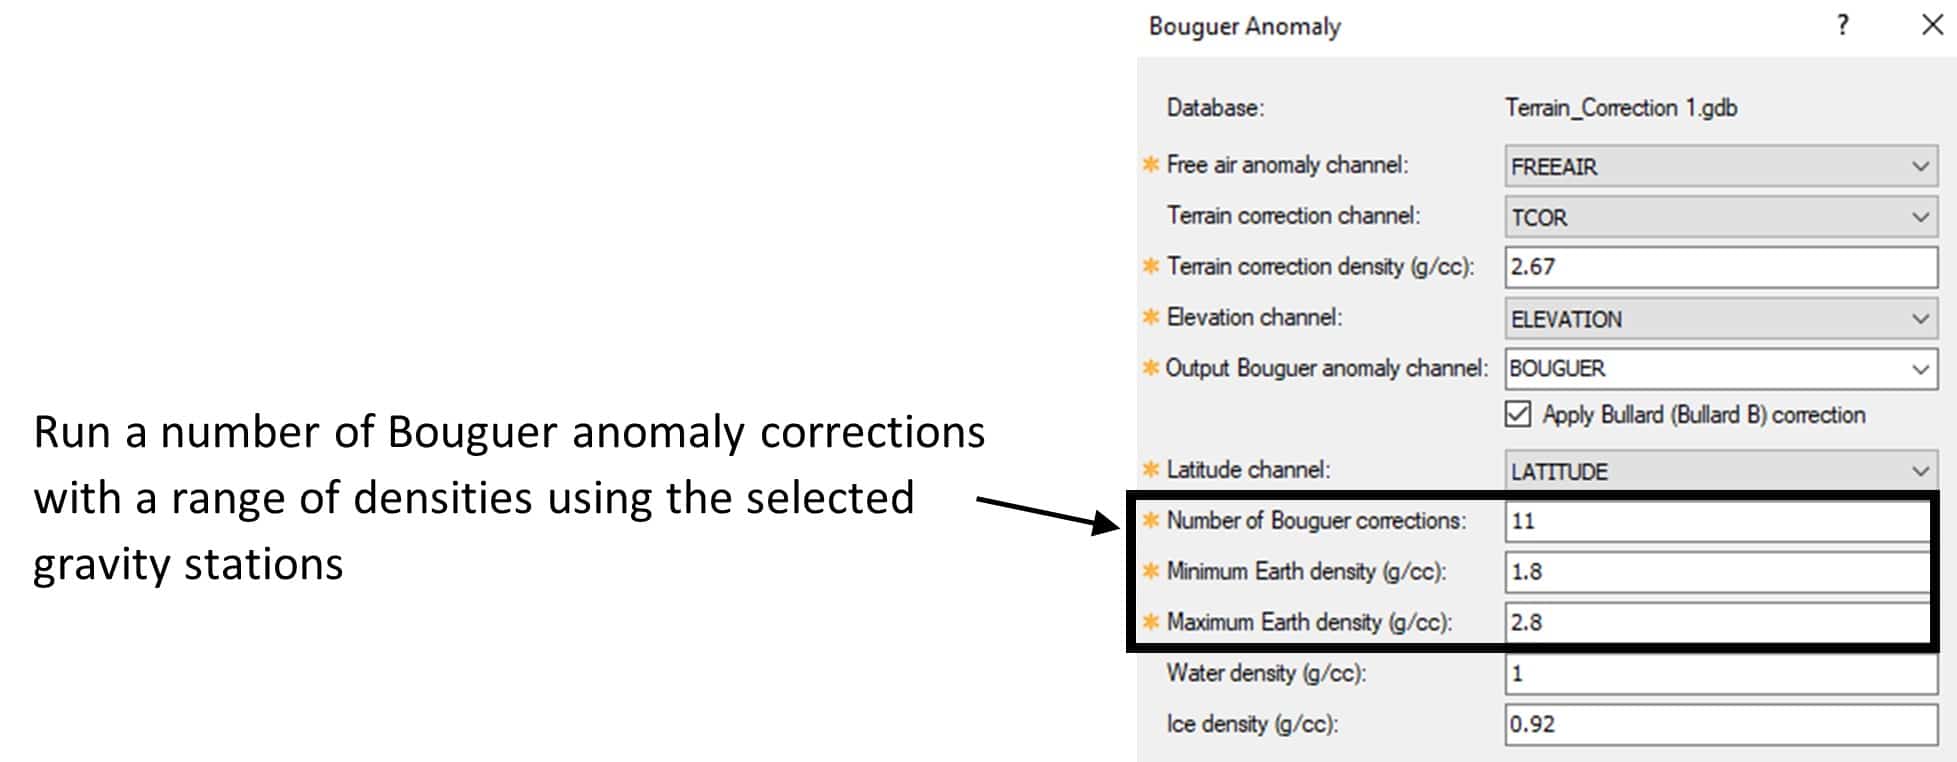
Select a terrain correction density with more confidence
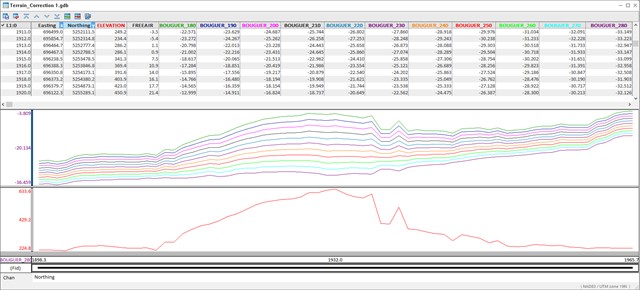
The terrain correction density can be selected by running the Bouguer anomaly correction several times with a range of densities (Nettleton’s method). The optimal density is the one that produces a Bouguer anomaly that correlates least with topography.
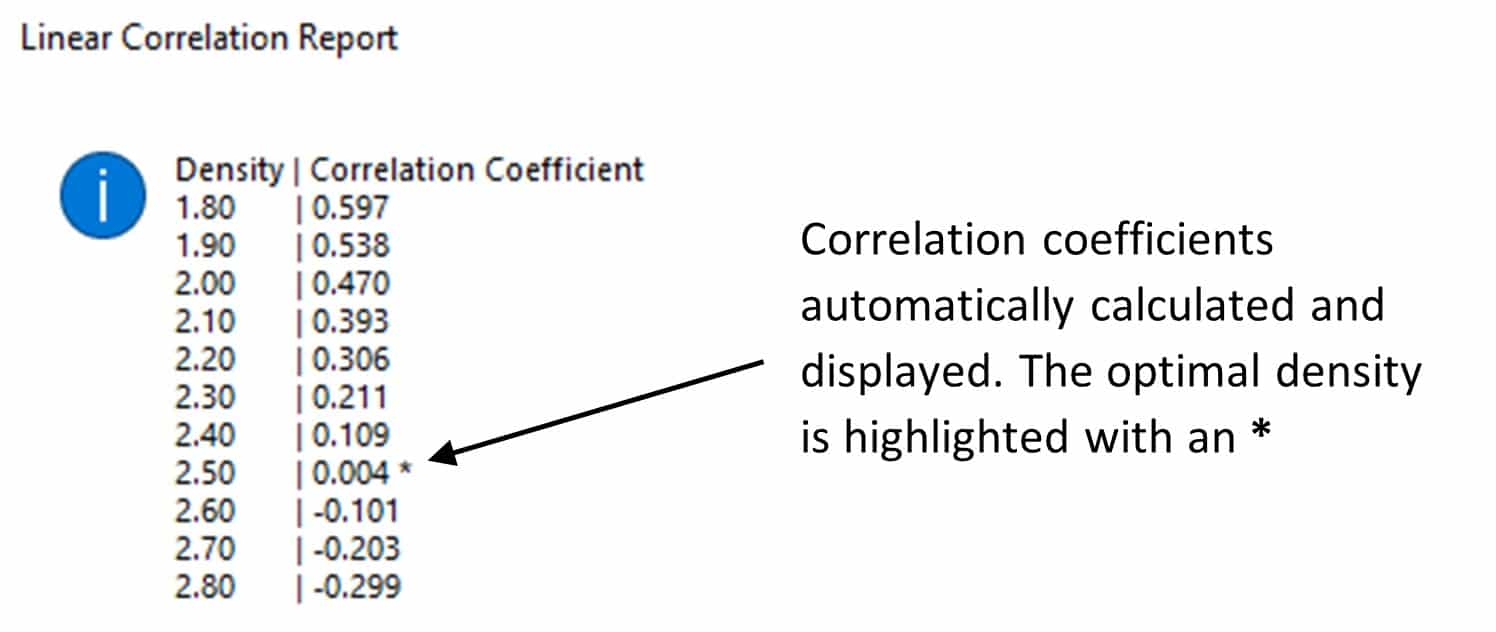
Sometimes, it can be very difficult to determine the best density purely by visual comparison. Now, when the Bouguer anomaly correction is run, correlation coefficients are also exported. Correlation coefficients provide an explicit value on how well the calculated Bouguer anomaly follows topography and will give you more confidence in your selection.
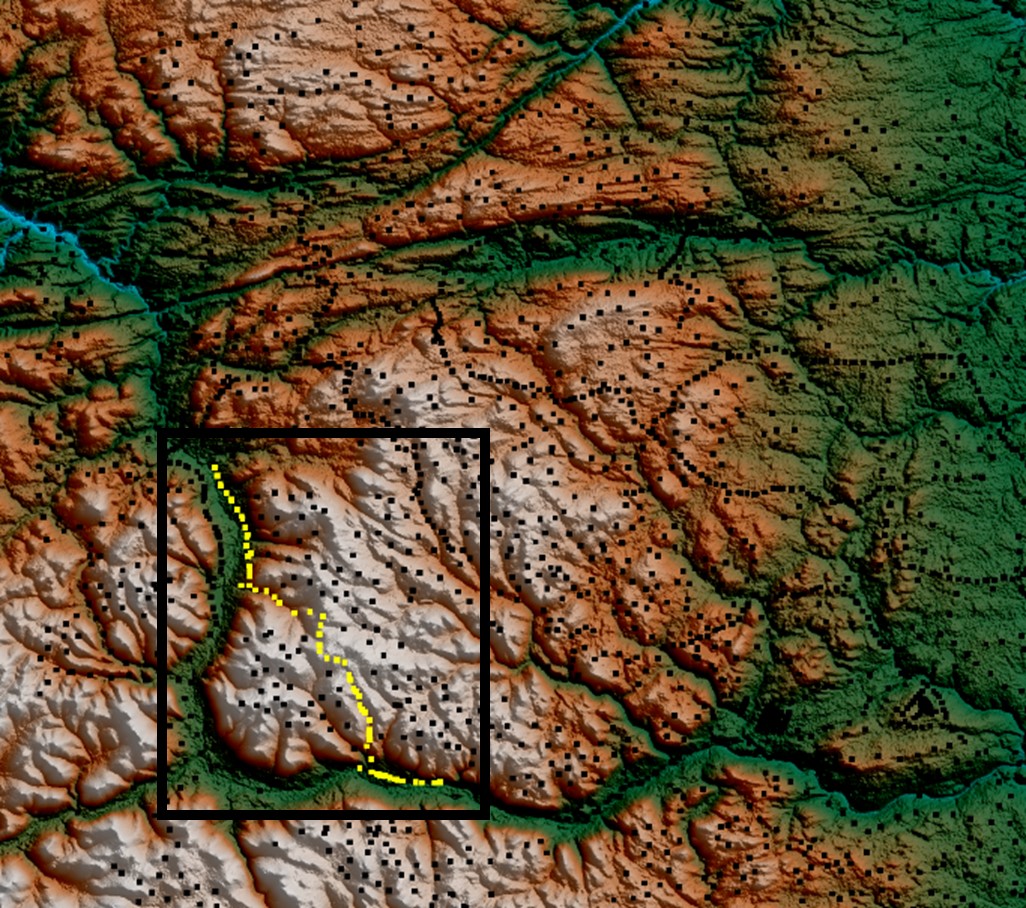
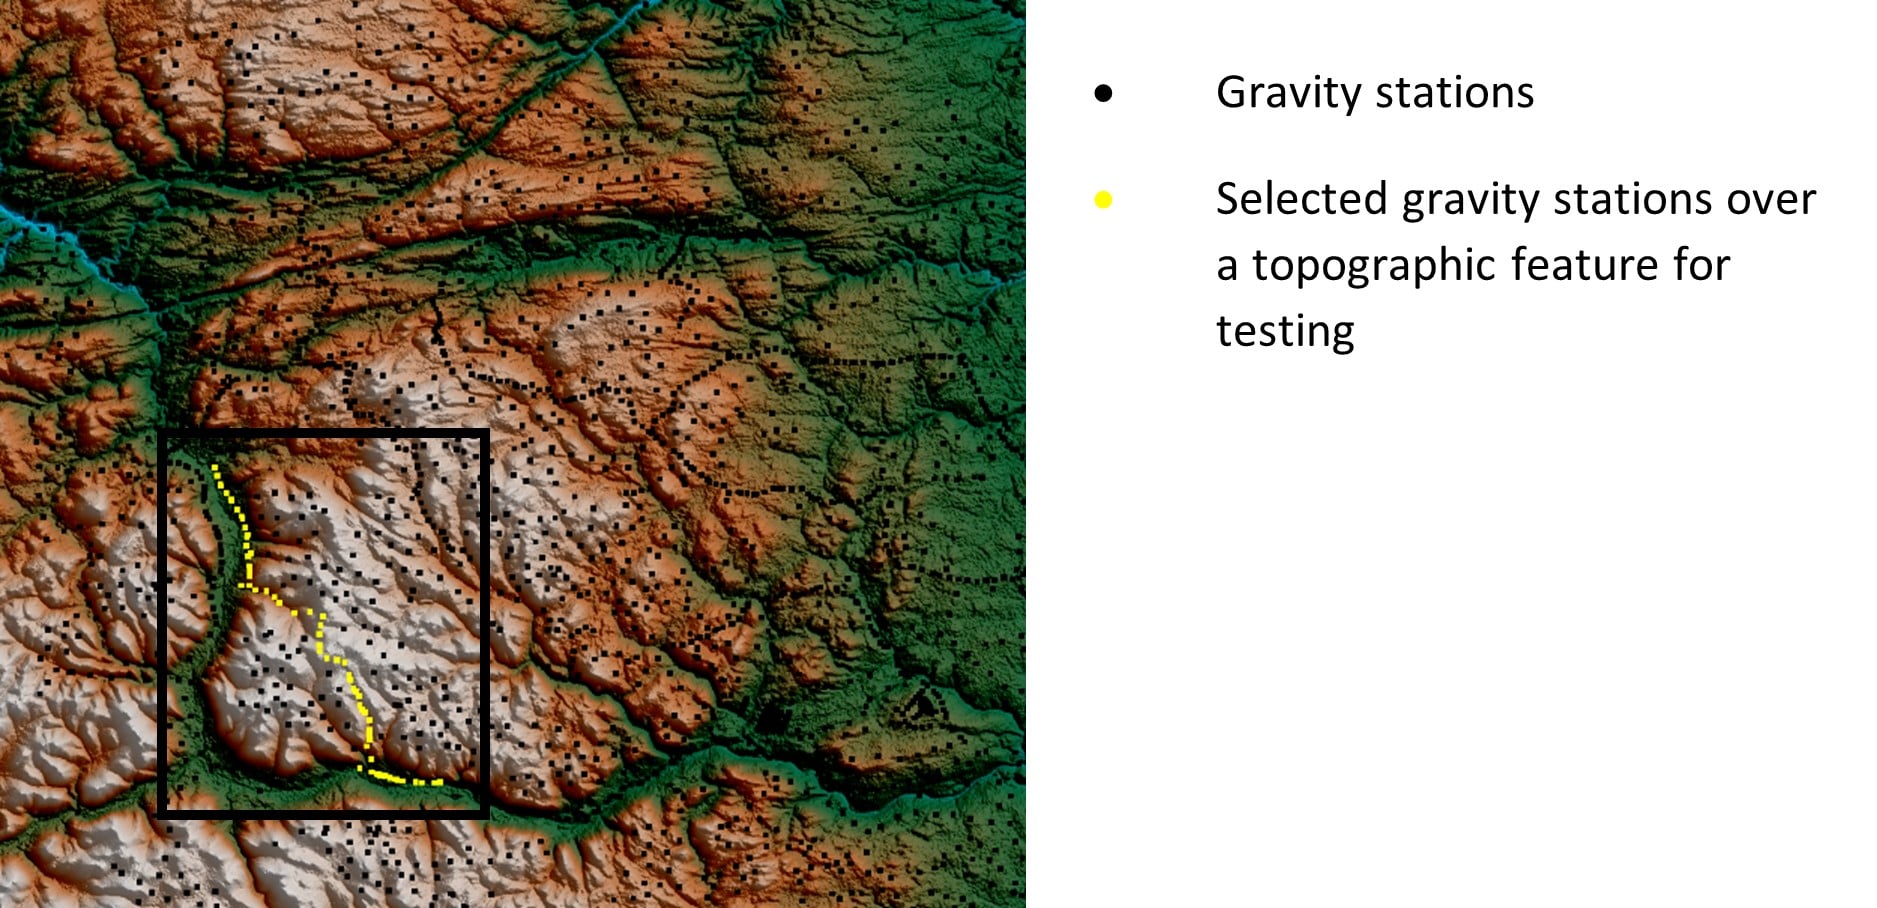
To produce meaningful correlation coefficients a subset of data over a topographic feature (hill or valley) should be selected for testing. The density in the subset of data is assumed to be uniform; it can be representative of the whole area or be exclusive to the test area.
A correlation coefficient of 1 indicates strong correlation, 0 no correlation and -1 inverse correlation. The density that produces a coefficient closest to 0 is highlighted with an * to indicate that it is the optimal density to use in the Bouguer anomaly correction.
The Bouguer anomaly at each density is displayed in database profile along with elevation for visual comparison.