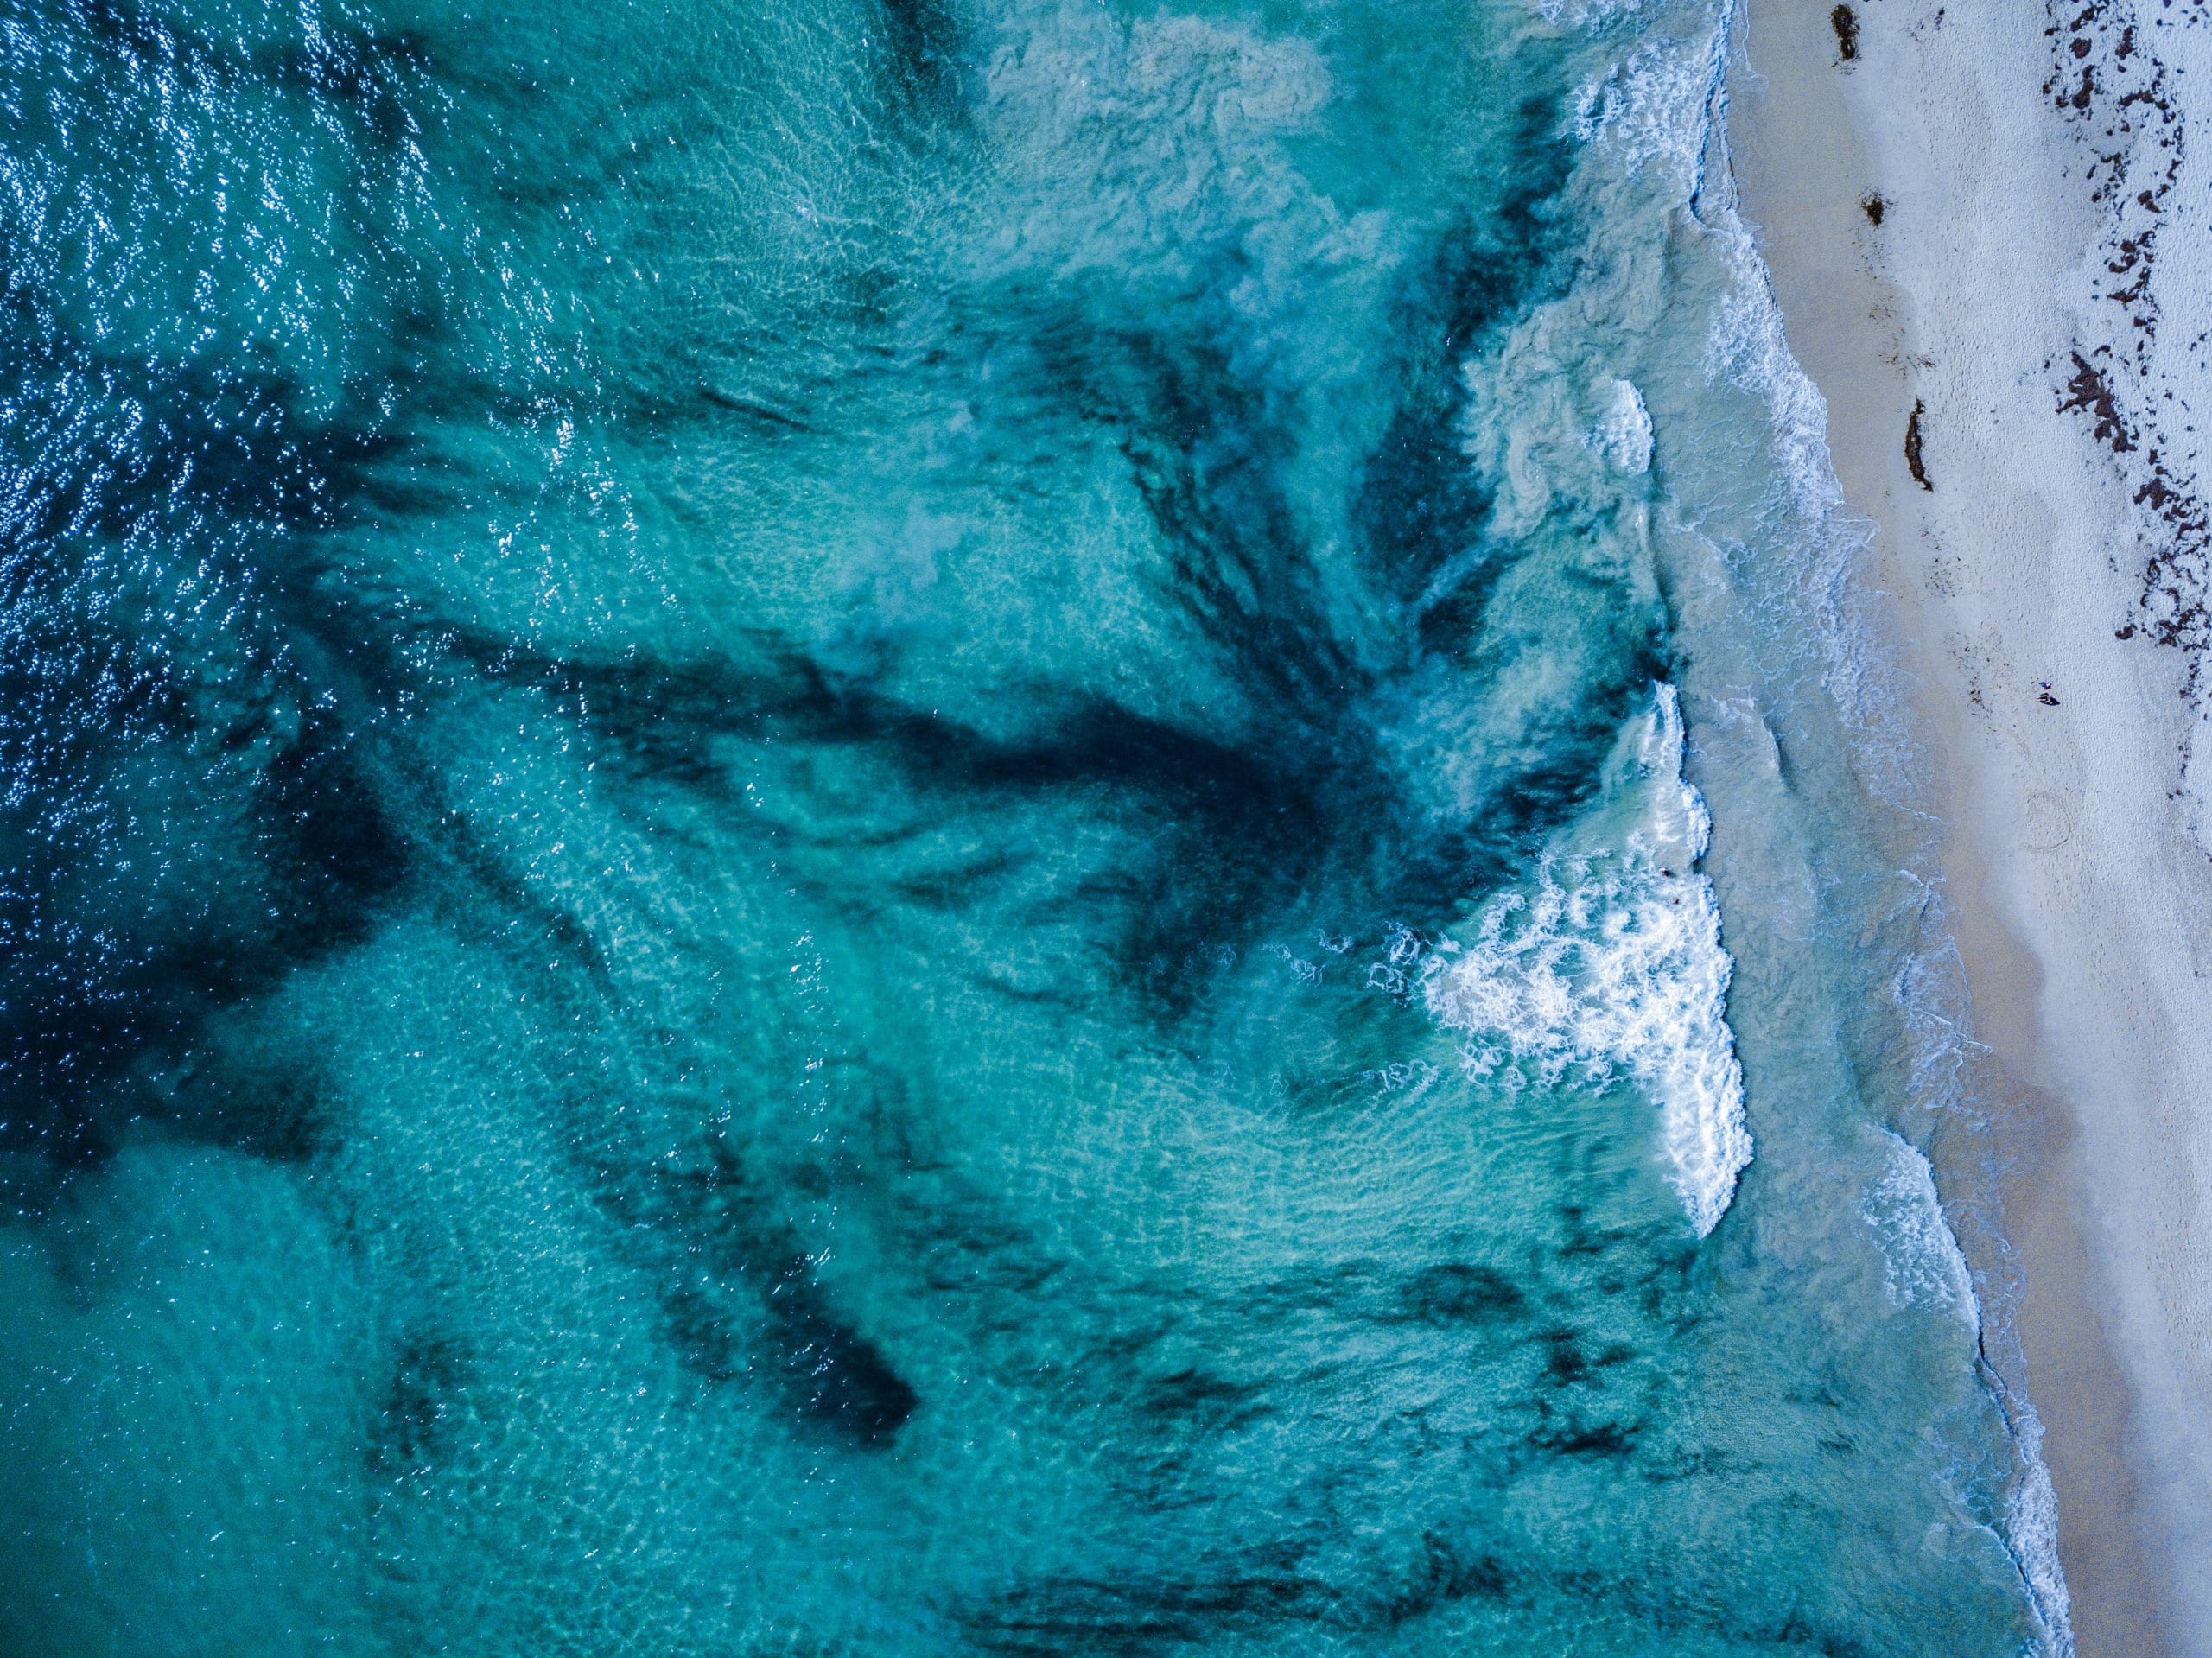
Convincing the public to use less water will be vital to avoiding water shortages in the future, but are facts, figures and meter readings really the best way of communicating that to them? Could a more graphic approach inspire a greater global responsibility around the water we use?
Why this idea fascinates me
Water is a big problem in Chile where I live, but where I grew up in Brazil, I never had to think about it. We had rains across the year. They relieved the heat at the end of the day in the summer and there was a short dry season in the winter, but everything was balanced. Arriving in Chile, I had to learn to live without that rain and saw all the problems of desertification of the land. There are many reasons behind that, but I think the biggest is that people are not educated or informed about how they should use water. It’s not easy enough for them to understand how scarce water truly is and what their usage of it means.
So what inspires me is the idea of transparent information about water status for the public and how that can influence and improve our reuse of water. If you know and value the water you use – and technology makes it really use for you to understand – I believe we will all be more prepared to save it, reuse it, and share knowledge with others.
How could it work
With sensors we can measure the change of water levels in rivers, lakes, underground, and pluviometry levels every day. All this data in numbers has meaning for only a few of us specialists, but as a powerful geological and hydrogeological model, open on the Internet, it can speak more than 1000 words. Such clear and striking graphics would help the public understand different challenges related to water.
Such models can be updated, showing the changes during a year, different seasons, where this water is coming from, and how much water we have for usage.
Every day the average person in North America uses 88 gallons (333 Litres) of water. Imagine being able to measure that using IoT, then showing it as a graphic that would generate more transparency around when we need to save water. Or, how waste water – 1.6 gallons (6 Litres) in flushing a toilet, 8 Gallons (30 Litres) for a four-minute shower – could be reused for growing forests, landscaping, irrigation of agriculture crops, and even to recharge aquifers.
What does it offer?
I believe that such a project to drive water transparency would benefit everyone, from a single person to mining, big or small industries, and agriculture. True clarity on how much natural water we have in one year would reinforce a sense that water is limited, and it’s important to think and care about.
The knowledge that when I switch on my shower, the water level is going down, or that this year we had no rain can be communicated much more powerfully through images than numbers. And it’s a solution not just for arid areas but for all environments.
The role played by connectivity
Connectivity is the key to improving communication around water. We need comparison and tracking of different scenarios to understand the changes and what should we do. Having 3D models of geology and hydrogeology, being able to track with IoT and sensors the usage of water and transforming that into data that can be visualized and understood by every member of the public could transform how we feel about our water and the personal responsibility we take for it.
To plan a sustainable future, it´s necessary to understand the yesterday and the today. Tracking the data in a platform that can share the knowledge in a comprehensive way will help to avoid different challenges in the future and make better decisions about water scarcity and water quality.

Julia Oliveira
Senior Technical Leader, Seequent


