


Introduction
Tie-back anchors are a common stabilization method for steep excavations (Figure 1). The anchors transfer the load on the wall deeper into the ground behind the wall. From a limit equilibrium perspective, the loads in the anchors are converted to forces acting on the potential sliding mass. The magnitude and application location of these loads must be determined for a stability analysis. This example demonstrates how to simulate anchors in a SLOPE/W limit equilibrium analysis and provides recommendations for good modeling practice.
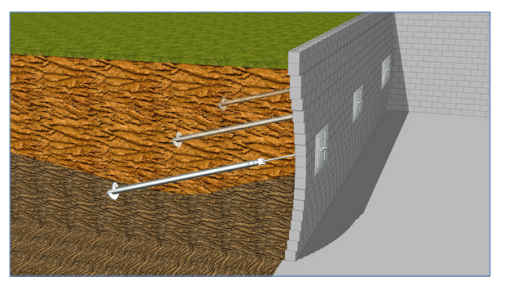
Figure 1. Illustration of a tie-back wall (public web image).
Background
Magnitude of Anchor Forces

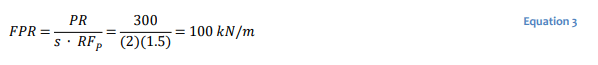
The pull-out resistance or strength of the soil-grout interface is expressed in one of two ways: (1) as a force per unit length of grout, 𝐹𝑚𝑎𝑥; or (2) as a shear strength per unit area of the soil-grout interface, 𝑓𝑚𝑎𝑥 (Briaud, 2013). SLOPE/W allows for both designations. The bond pullout resistance can be specified as a force per unit length (kN/m) by setting the borehole diameter equal to 1/π. This means that the value specified in force per unit length (kN/m) is identical to specifying it as a shear strength per unit area (kPa). For example, if the pullout resistance, 𝑃𝑅, is specified as 300 kPa (𝑓𝑚𝑎𝑥 )
with a borehole diameter of 1/π, the resulting force per unit length is 300 kN/m:

When the pullout resistance is expressed as a value per unit length of grout, it may be referred to as the load transfer capacity. If the actual borehole diameter is specified, then the pullout resistance must be in terms of shear strength per unit area. Briaud (2013) presents typical values for both forms of pull-out resistance, and the Canadian Geotechnical Society (2006) provides typical load transfer capacities. The corresponding factored pullout resistance, 𝑃, is:
In a SLOPE/W analysis, the pull-out resistance is dependent on the length of grout behind the slip surface. If the slip surface is in front of the grout, the entire grouted length contributes to pull-out resistance. Conversely, if the slip surface position is behind the grout, the anchor is within the sliding mass and is ignored. Thus, the minimum force available from pull-out resistance is 0 kN and the maximum, Pmax , is determined by:
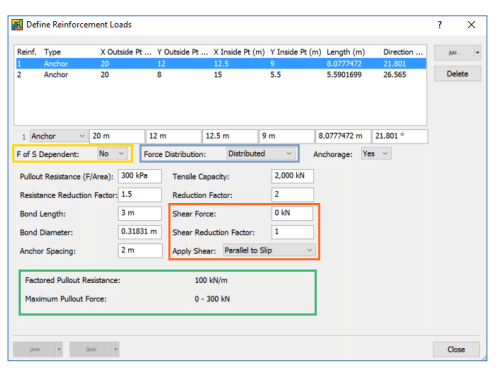
Figure 2. The reinforcement dialogue box including the anchor properties for the base case (Analysis 1), with the computed pull-out resistance values in the green box, the factor of safety dependence in yellow, force distribution option indicated by the blue box, and the application of shear forces in orange.
Shear forces mobilized within the anchor may also be incorporated in the reinforcement settings (indicated by the orange box in Figure 2). As with the pull-out resistance and tensile capacity, a reduction factor may be applied to the shear force associated with the anchor. The applied shear force, Sa, is calculated by:
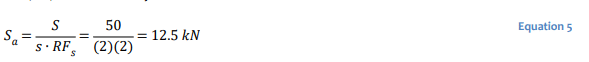
where 𝑆 is the specified shear force and is the shear reduction factor. The orientation of the 𝑅𝐹𝑠 mobilized shear force within the anchor may act parallel to the slip surface or perpendicular to the anchor.
Force Distribution
The application point of the concentrated load representing the anchor does not have a significant effect on the overall computed factor of safety. However, it does have a substantial effect on numerical convergence. Applying the entire concentrated load at a single point often leads to difficulties achieving a converged solution for the trial slip surfaces. Distributing the anchor force amongst all the slices intersected by the line of action makes it easier to obtain converged solutions. It also results in more reasonable inter-slice and slip surface stress distributions. The default setting in SLOPE/W is to distribute the anchor force; however, the option to apply a concentrated anchor force is also available.
Factor of Safety Dependence
A question that sometimes arises when analyzing tie-back walls is: does the anchor force reduce the gravitational driving force of the potential sliding mass or does the anchor force increase the resistance to sliding? Conceptually, the factor of safety, 𝐹𝑆, is the total resistance arising from the soil shear strength divided by the gravitational driving force, such that:
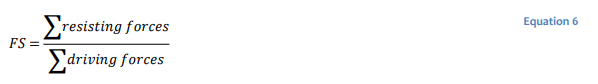
Most commonly, the anchor forces are viewed as reducing the gravitational driving forces. The factor of safety equation then is:
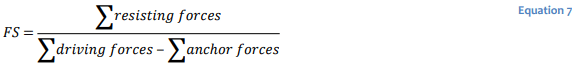
If the anchor forces are deemed to increase the resistance, the factor of safety equation becomes:
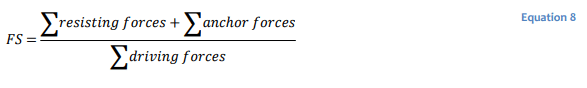
Recall from the basic definition of the factor of safety, that it is the number by which the soil strength must be reduced in order to achieve equilibrium. This means that in the SLOPE/W factor of safety equation, the soil strength must be divided by the factor of safety. This being the case, the anchor forces must also be divided by the factor of safety if the anchor forces are in the numerator (as in Equation 7). SLOPE/W has the option to modify the anchor forces based on the factor of safety (as indicated by the yellow box in Figure 2). When this option is selected, the other reduction factors should be set to 1.0. Otherwise, the specified and computed reduction factors will be compounded.
Numerical Simulation
The model domain is a 10-m high tie-back wall supported by two rows of anchors (Figure 3). The tie-back wall material has a unit weight of 20 kN/m3, a cohesion of 0 kPa, and a friction angle of 30ᵒ. There are four analyses in the project (Figure 4), which all use the Spencer limit equilibrium method. The trial slip surfaces are the same in all analyses and are defined by the Entry and Exit method. All slip surfaces exit the bottom of the wall, and have a specified axis at coordinate (23,19). There are no pore water pressure conditions defined for the four analyses.
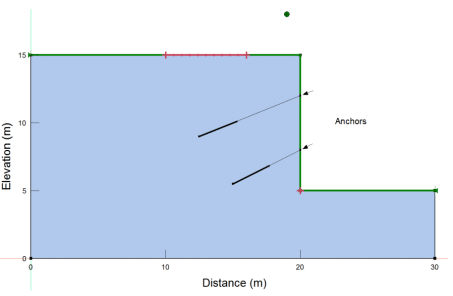
Figure 3. Tie-back wall and anchor configuration in all four SLOPE/W analyses.
The four analyses in the project file illustrate various approaches for simulating anchor loads. The base case, Analysis 1, includes distributed anchor loads that are not dependent on the factor of safety, and there are no shear forces mobilized in the anchor (Figure 2). The anchor specifications in Analysis 2 are the same as in Analysis 1, except the load is concentrated at the point where the anchor line of action intersects the slip surface (see the blue box in Figure 2). Analysis 3 is also the same as Analysis 1, but the anchor loads are dependent on the factor of safety. Note that the specified resistance reduction factor and tensile reduction factor are set to 1.0 when the factor of safety dependence option is selected (yellow box in Figure 2). Finally, Analysis 4 includes the shear forces mobilized within the anchor bar. The shear force magnitude is 50 kN acting parallel to the slip surface, with a reduction factor of 2. The general anchor characteristics applied in all four analyses are presented in Table 1.
Figure 4. Analysis Tree for the Project.
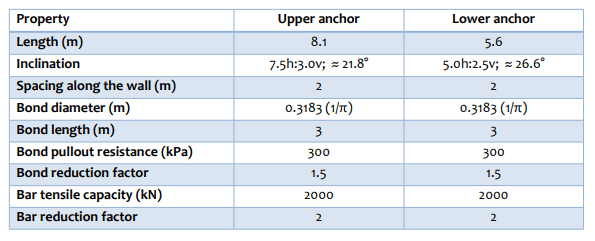
Table 1. Anchor specifications for all four analyses.
Results and Discussion
The critical factor of safety computed for the base case (Analysis 1) is 1.207 (Figure 5). The red box along the anchors indicates the grouted length providing the pull-out resistance for the given factor of safety. In this analysis, the grouted sections of the anchors are entirely behind the critical slip surface and the red boxes have a similar length as the grouted section (thick black line). Thus, the whole grouted length of each anchor contributed to pull-out resistance. In other words, the embedment depth is sufficient to provide the maximum pull-out force available (300 kN).
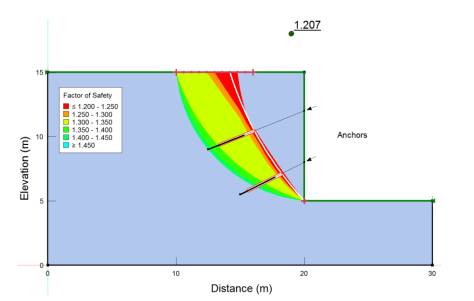
Figure 5. Result with the anchor forces distributed amongst the slices.
The free body diagram for each slice is provided in the View Slice Information command (e.g., Slices 11 and 22 illustrated in Figure 6). The line of action associated with the upper anchor cuts through 21 slices (slices 10 to 30, inclusive). Thus, the anchor load is evenly distributed across these 21 slices, which corresponds to 14.286 kN per slice (300 kN divided by 21). The vector pointing towards the base of Slice 11 with a magnitude of 14.286 kN represents the distributed load from the upper anchor. The lower anchor line of action cuts across 10 slices (Slices 21 to 30, inclusive). Thus, both anchors influence Slices 21 to 30. The total anchor load on these slices is:
which corresponds to the vector acting on the base of Slice 22 (Figure 6). In the software code, the force resolution is handled differently than the simple hand calculations portrayed here; consequently, slight numerical discrepancy appears between the hand calculations and the computed values (Figure 6).
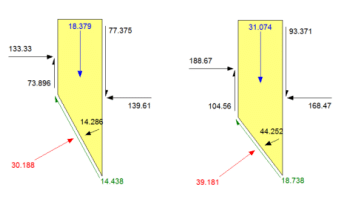
Figure 6. Free body diagrams for Slice 11 (left) and Slice 22 (right) generated in Analysis 1.
The normal stress and interslice force distributions over the critical slip surface are illustrated in Figures 7 and 8. The critical factor of safety is 1.203 when the concentrated anchor loads option is selected (Figure 9). Although the critical factor of safety is almost identical to the distributed load case (Analysis 1), the force distribution along the slip surface and between the slices are very different (Figures 7 and 8). Slices 13 and 23 now include the entire 300 kN force of the upper and lower anchors, respectively (Figure 10). Also, the interslice forces on the right side of the free body diagram now point away from these slices (Figure 10). This is not the case when the anchor loads are distributed as in Analysis 1 (Figure 6).
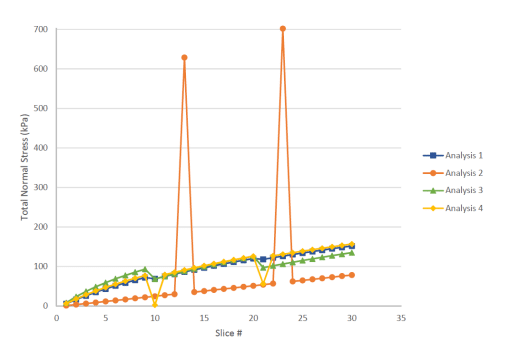
Figure 7. Comparison of the normal stress distribution along the critical slip surface for all four analyses.
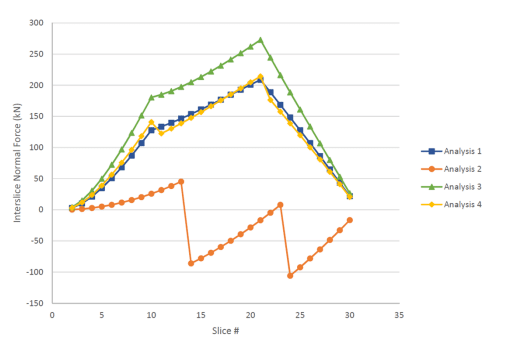
Figure 8. Comparison of the interslice normal force distribution over the critical slip surface for all four analyses.
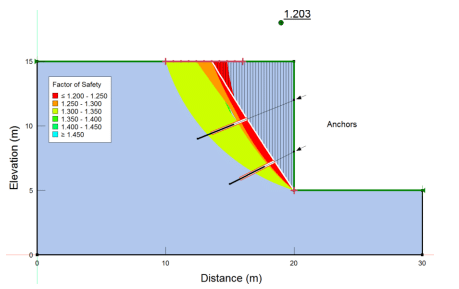
Figure 9. Stability results when the anchor forces are concentrated on the slip surface (Analysis 2).
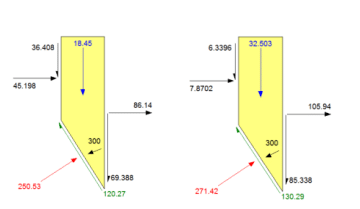
Figure 10. Free body diagrams for Slice 13 (left) and Slice 23 (right) generated in Analysis 2.
The normal stress distribution along the critical slip surface in Analysis 2 is very different from the one generated by Analysis 1 (Figure 7). When the anchor loads are concentrated, the normal stresses exhibit sharp increases at the slice where the anchor load is applied. Similarly, the interslice force distribution over the critical slip surface jumps drastically where the anchor load is applied (Figure 8). However, the overall global factors of safety are essentially the same regardless of the load distribution. This is due to the fundamental assumptions of the limit equilibrium formulation (i.e., each slice is in force equilibrium and has the same factor of safety), resulting in slice forces that are not always representative of the actual stresses in the ground. Fortunately, the computed global factor of safety is acceptable even though the stress distributions are not realistic.
Distributing the anchor forces amongst many slices is the preferred option as it generates more reasonable stress distributions and mitigates numerical convergence issues. This means that a factor of safety is available for more trial slips surfaces when the anchor forces are distributed. Conversely, the results from an analysis with concentrated anchor forces are typically easier to interpret (i.e., compare with hand calculations) so this option remains useful for understanding stability results. However, distributed anchor loading is ultimately recommended for design.
The factor of safety for the critical slip surface is similar but slightly higher than the previous two cases when the reinforcement is dependent on the factor of safety (Figure 11; Analysis 3). However, the slice forces are different (Figures 7 and 8). The total force associated with both the upper and lower anchors is 364.4 kN, computed by:
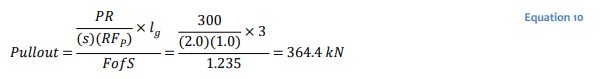
where 𝑙𝑔 is the grouted length (3 m) and the pullout reduction factor is set to 1.0 as discussed above. This force is distributed to all slices intersecting the line of action of each anchor.
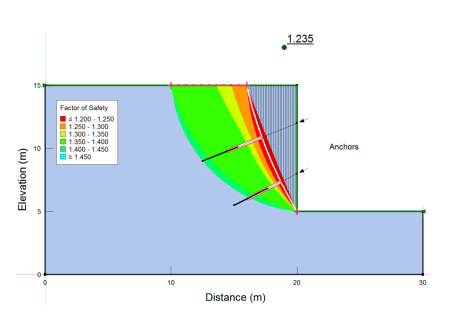
Figure 11. Stability results when the reinforcement depends on the computed factor of safety (Analysis 3).
In Analysis 3, the reduction factor or factor of safety for all components is the same. Therefore:
- The factor by which the strength of all slices must be reduced for active sliding to occur is 1.236;
- The factor by which the soil-grout bond strength is reduced is 1.236; and
- The factor by which the bar tensile capacity is reduced is 1.236.
Generally, factor of safety dependence is applied to ductile reinforcement, such as geosynthetics. However, there is no theoretical basis for selecting one method over the other, as the stability formulation fundamentally satisfies force equilibrium regardless of whether the anchor force is in the numerator or denominator of the factor of safety equation. Ultimately, the selected approach is up to the user, but multiple reduction factors can be specified for different components in the analysis when the anchor forces are in the denominator of the factor of safety equation.
The final option demonstrated in this example is the ability to include shear forces arising from the presence of the anchors (Analysis 4). The critical factor of safety in this case is 1.275, which is higher than any of the previous analyses (Figure 12). The applied shear force (12.5 kN) is evident on the free body diagram for the slice base intersecting the line of action (Figure 13). In this case, the shear force is parallel to the slice base or the slip surface. Determining an appropriate magnitude for the shear force is difficult. Thus, this potential resisting force is often omitted from a SLOPE/W analysis, unless a realistic magnitude can be estimated.
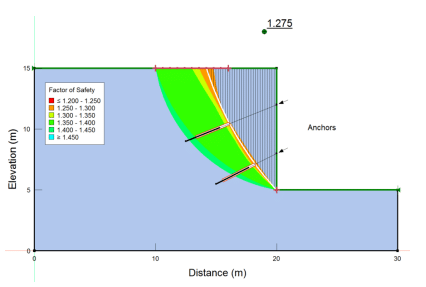
Figure 12. Stability results when anchor shear forces are included (Analysis 4).
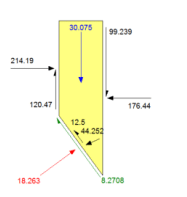
Figure 13. Free body diagram for the slice whose base is intersected by the anchor line of action when shear mobilized within the anchor is included (Slice 21, Analysis 4).
The forces in the different components of a tie-back wall are a function of the relative strains between each component or the movement required to mobilize the capacity in the different elements. Fundamentally, these analyses represent true soil-structure interaction problems and should be analyzed with SIGMA/W, as it is based on a stress-strain constitutive relationship. As SLOPE/W is based purely on satisfying the equations of statics, the formulation does not consider strains and displacements. Thus, when using SLOPE/W to investigate the stability of a soil-structure interaction problem, the concept of strains must be captured through the reduction factors. For example, high reduction factors are selected to minimize the possibility of significant displacements – a common approach in foundation design.
Summary and Conclusions
This example demonstrates how to simulate tie-back wall anchors using the reinforcement functionality in SLOPE/W. Each analysis explored a different option available for anchor reinforcement, including the force distribution, factor of safety dependence, and addition of shear mobilized within the anchor. The analyses all generated a relatively similar factor of safety for the critical slip surface; however, the computed force distributions along the critical slip surfaces varied substantially.
One of the most difficult parts of analyzing the stability of tie-back walls is establishing appropriate values for the soil-grout shear strength, as it is highly dependent on the installation procedure. Sometimes the grout is installed under gravity loading, while in other cases, the grout is injected under significant pressure, resulting in very different soil-grout bonding strengths. Estimated soil-grout bond values, as presented by Briaud (2013) and the Canadian Geotechnical Society (2006), are acceptable for preliminary designs. If field pullout tests are used to determine the actual installation soil-grout bond strength, then a lower reduction factor is required when entering the reinforcement information in SLOPE/W.
References
Briaud, Jean-Louis, 2013. Geotechnical Engineering: Unsatuarted and Saturated Soils, John Wiley & Sons.
Canadian Geotechnical Society, 2006. Canadian Foundation Engineering Manual 4th Edition, BiTech Publisher Ltd., Richmond, BC, Canada.