


Predicting water quality risks at mine closure: a study in cold weather climates
At mine closure, waste rock cover systems in the Arctic can employ freezing processes not available in more temperate climates.
An Arctic gold mine was approved to use a thermal cover system to isolate potentially acid generating and metal leaching waste rock as part of reclamation strategies. Okane optimised the cover system design by integrating historic thermal data with robust visualization of thermal, water flow, and gas flow processes in GeoStudio. The approach led to an understanding of the long-term water quality risks and successful approval of an optimised design.
Overview
Speakers
Gillian Allen
Senior Engineer – Okane Consultants
Duration
16 min
See more on demand videos
VideosFind out more about Seequent's environmental solutions
Learn moreVideo Transcript
[00:00:16.330]
<v ->Hi, thanks Aaron for the introduction.</v>
[00:00:18.660]
So as Aaron mentioned, today I’ll be presenting a case study
[00:00:21.520]
on modeling waste rock storage facilities in cold regions,
[00:00:24.840]
and I’m hoping to step a little bit away
[00:00:27.380]
from the technical aspects of the modeling
[00:00:29.330]
in this case study
[00:00:30.370]
and focus a bit more on big picture thinking.
[00:00:33.850]
And what I hope you take away from this presentation today
[00:00:36.410]
is that really understanding the conceptual model
[00:00:39.460]
is very important
[00:00:40.830]
and having a robust conceptual model
[00:00:42.660]
leads to modeling results that are better able
[00:00:46.400]
to inform on important management decisions
[00:00:48.540]
when it comes to closure of waste rock storage facilities
[00:00:51.660]
in cold regions.
[00:00:54.920]
So as I mentioned, the case study today
[00:00:57.140]
will focus on closure of waste rock storage facilities
[00:01:00.300]
in cold regions.
[00:01:01.900]
This is particularly relevant today
[00:01:03.730]
as Arctic exploration is continuing to expand
[00:01:07.040]
as industry looks for new deposits.
[00:01:10.470]
And this was going to lead to an industry-wide need
[00:01:13.250]
to have a good understanding of how to achieve
[00:01:15.670]
successful closure in cold regions.
[00:01:18.900]
And as of any site,
[00:01:19.990]
it’s important not to use a cookie cutter approach
[00:01:22.610]
when we’re talking about closure of the mine site,
[00:01:25.510]
but in particular for cold regions,
[00:01:28.200]
there are definitely different management challenges.
[00:01:31.260]
For example, the very remote nature of most of these sites
[00:01:34.720]
or the lack of typical reclamation materials
[00:01:37.200]
that you might use at more temperate sites,
[00:01:40.530]
but there’s also different opportunities
[00:01:41.890]
that present themselves in these cold regions,
[00:01:44.580]
such as the opportunity to use permafrost conditions
[00:01:47.690]
to our advantage.
[00:01:49.420]
So many of the management strategies
[00:01:51.240]
that people might be used to from working at mine sites
[00:01:53.330]
in more temperate regions,
[00:01:54.720]
just aren’t available in these cold climates
[00:01:57.340]
and we need to make sure that we’re thinking about these
[00:01:59.980]
in a site-specific way.
[00:02:03.590]
Specifically, today’s case study focuses
[00:02:05.940]
on waste rock storage facilities
[00:02:07.650]
from an open pit gold mine in the Arctic
[00:02:09.940]
that’s in the beginning stages of production.
[00:02:13.290]
They have some reactive waste rock at this site,
[00:02:15.700]
which has a potential for acid rock drainage
[00:02:17.610]
and metal leaching.
[00:02:19.020]
And so the site came to us initially
[00:02:21.660]
with a concept that they needed to flesh out a bit more.
[00:02:26.360]
So the concept for closure was that they would maintain
[00:02:30.830]
the reactive waste rock in a frozen state
[00:02:33.110]
by use of a thermal cover system.
[00:02:35.720]
So what this means is that the annual freeze-thaw layer,
[00:02:39.610]
to the layer that seasonally thaws in the summer
[00:02:42.090]
and then freezes back every winter,
[00:02:43.910]
would be maintained with a non-acid generating materials.
[00:02:47.660]
So the idea here is that the reactive waste rock
[00:02:51.440]
would remain frozen,
[00:02:53.290]
reducing the reaction rates, resulting in ARD,
[00:02:57.110]
but also limiting the liquid water
[00:02:59.260]
that would then transport any metal products or acid
[00:03:03.450]
away from the landform.
[00:03:05.490]
So the assumption behind this objective
[00:03:09.160]
that the site presented to us is that any acid generating
[00:03:12.960]
or metal leaching rock that’s available to be unfrozen
[00:03:18.760]
but available in the active layer
[00:03:21.050]
may lead to water quality issues at the toe
[00:03:26.610]
and would contribute to a loading from the lawn form.
[00:03:29.860]
So the first thing that we looked at was
[00:03:32.240]
is that really the objective is the objective
[00:03:34.730]
to maintain this waste rock in a frozen state?
[00:03:39.120]
And arguably the overarching objective here is
[00:03:41.330]
that we’re actually worried about water quality.
[00:03:44.130]
So the overarching objective
[00:03:45.590]
is to limit contaminant migration to the protect
[00:03:48.780]
so that we’re protective of surface
[00:03:50.350]
and groundwater quality.
[00:03:52.370]
So this overarching objective is actually going
[00:03:55.870]
to become the measurable
[00:03:57.400]
by which we understand if the management strategy,
[00:03:59.960]
which is this cover system is successful or not.
[00:04:06.100]
The site from this case study is located in Northern Canada
[00:04:10.830]
in the Arctic.
[00:04:12.380]
So in the Koppen Geiger climate classification system,
[00:04:15.730]
it’s listed as ET or a tender climate.
[00:04:19.050]
So this isn’t a continuous permafrost region.
[00:04:22.690]
So these are the different permafrost regions in the Arctic
[00:04:25.450]
or Northern Canada,
[00:04:27.040]
or some are continuous runner
[00:04:29.070]
in this dark blue area.
[00:04:31.100]
That means that the ground is frozen at depth year round.
[00:04:37.470]
So we were asked to flesh out
[00:04:39.520]
the proposed reclamation strategy.
[00:04:41.870]
So the 4.5 meter thermal cover system.
[00:04:45.510]
So how we do this,
[00:04:47.340]
or how we like to do this before ever turning on a model
[00:04:49.960]
is to develop a really good conceptual model
[00:04:53.300]
of what we think that management strategy,
[00:04:55.630]
how we think that management strategy will perform.
[00:04:58.420]
So we do this by looking at all the different facets
[00:05:00.610]
that affect performance.
[00:05:01.640]
So things like climate, the hydrogeologic setting,
[00:05:04.670]
the materials available for reclamation
[00:05:06.570]
and in some cases,
[00:05:07.740]
the development of vegetation.
[00:05:10.730]
So understanding how all of these things interact
[00:05:13.040]
with the waste rock storage facility in question
[00:05:15.890]
lead us to have an understanding
[00:05:17.440]
of all the different processes.
[00:05:21.560]
So things like the surface water balance
[00:05:23.810]
or the energy and thermal balance of the landform.
[00:05:27.480]
So understanding these is really important
[00:05:29.570]
to forming a robust conceptual model,
[00:05:31.720]
because it means that we understand things like
[00:05:34.350]
that the water balance is likely to be dominated
[00:05:36.490]
by spring melt in this area
[00:05:38.650]
or that because we’re at such a high latitude,
[00:05:41.930]
there’s likely going to be some fairly significant slope
[00:05:45.310]
effects due to shading.
[00:05:47.860]
So the surface energy balance may look different
[00:05:50.160]
on different areas of the landform
[00:05:52.690]
or that gas transport might be a really important mechanism
[00:05:56.580]
in freeze back of this landform,
[00:05:59.700]
because it’s the dominant feature in the lab
[00:06:02.250]
in the landscape,
[00:06:03.250]
because we’re talking about a very flat tundra,
[00:06:05.230]
and we’re talking about an 80, 90 meter
[00:06:07.470]
waste rock storage facility.
[00:06:08.830]
So there might be significant wind effects
[00:06:10.570]
that either warm up or cool down the landform.
[00:06:17.470]
So we’ve spent our time developing our conceptual models.
[00:06:20.340]
So we should be ready to turn on our numerical models
[00:06:22.760]
right now, right?
[00:06:24.450]
Not quite.
[00:06:26.100]
We still need to do a bit more thinking in order
[00:06:28.170]
to make sure that we’re capturing all the processes.
[00:06:30.470]
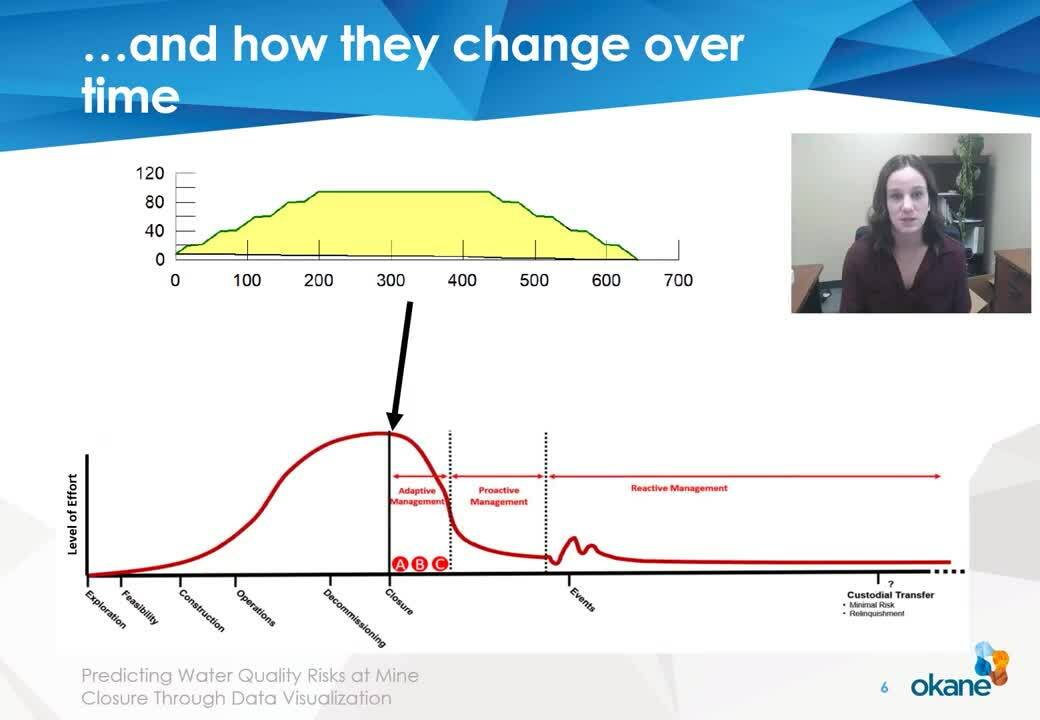
So our conceptual model
[00:06:31.730]
is probably based on one specific snapshot in time
[00:06:35.110]
in our minds.
[00:06:35.943]
And it’s probably right at closure,
[00:06:38.100]
which is shown here on this graph,
[00:06:39.550]
which was a level of effort
[00:06:41.890]
that goes towards closure over time.
[00:06:43.570]
So it peaks sort of near closure
[00:06:44.990]
and then comes back down in post closure.
[00:06:48.200]
So we may have formed a conceptual model
[00:06:51.130]
for this one particular snapshot in time,
[00:06:53.280]
but do we understand the processes
[00:06:55.460]
that have led to this specific,
[00:06:58.040]
the state of your waste rock storage facility at closure?
[00:07:01.910]
So do you understand your mine plan?
[00:07:03.340]
Do you understand what materials are coming up when,
[00:07:06.900]
and so we generally do have a pretty good idea.
[00:07:08.830]
We do have some information that can help us understand
[00:07:12.350]
or constrain what we think the waste rock storage facility
[00:07:15.930]
will look like at closure,
[00:07:17.890]
but if we haven’t considered how things will change
[00:07:20.250]
and how things will wind up
[00:07:21.430]
and the processes that will lead to this point,
[00:07:24.480]
it makes it really difficult to even make a stab or taken,
[00:07:29.050]
make an estimate of how things
[00:07:30.510]
will behave in post closure, right?
[00:07:33.010]
Because we have even more uncertainty further out in time.
[00:07:37.740]
So things like,
[00:07:39.380]
do we understand how climate change
[00:07:40.760]
will affect our conceptual model?
[00:07:42.840]
Will the materials weather?
[00:07:44.750]
Will hydrologically, will this landform
[00:07:47.903]
be sort of at a steady state?
[00:07:50.660]
So those are all things that we need to consider
[00:07:52.700]
when we look at the data.
[00:07:54.260]
And when, before we start modeling things out into longterm.
[00:08:00.630]
Luckily for us at this site, we did have some data.
[00:08:03.600]
So we’re able to improve our conceptual model
[00:08:06.410]
for that one snapshot in time at closure,
[00:08:09.230]
by using the available information to us.
[00:08:11.680]
So for us, one of those things
[00:08:13.380]
is that we have the mine plan.
[00:08:15.150]
So we can look at how this landform
[00:08:17.630]
gets built up over time.
[00:08:20.000]
And what this means is that we have information
[00:08:22.370]
on where the most reactive waste rock
[00:08:25.140]
is likely to be placed.
[00:08:26.660]
And we might know, based on the construction schedule,
[00:08:28.910]
that they’re only placing material A or B in winter.
[00:08:32.010]
So the initial temperature is going to be lower.
[00:08:35.470]
So what this leads to
[00:08:36.650]
is better understanding of what the landform
[00:08:40.033]
will actually look like when we get
[00:08:41.810]
to this one closure snapshot.
[00:08:44.590]
at the end of mine life.
[00:08:49.310]
At this site,
[00:08:50.143]
we also had a nearby waste rock storage facility
[00:08:52.640]
that was already constructed
[00:08:54.470]
that had some thermal data near our surface
[00:08:56.720]
that we could use for calibration.
[00:08:59.290]
So this is the thermal data on the left here.
[00:09:02.450]
So we see time marching along,
[00:09:04.160]
along the bottom access and temperature,
[00:09:06.660]
year over year shown in the colors
[00:09:09.660]
and the depth on the y-axis.
[00:09:11.770]
So obviously the red is means warmer
[00:09:13.560]
and the blue means cooler.
[00:09:15.590]
So it’s great that we have this data to calibrate too,
[00:09:19.040]
but it’s really important to place it in time.
[00:09:21.860]
So if we were to say that this date,
[00:09:24.540]
this is what we expect the freezing and thawing
[00:09:28.150]
to look like at that one point in time at closure,
[00:09:31.530]
that may not be a correct assumption
[00:09:33.200]
because this reflects the evolution
[00:09:36.210]
of the management strategy that’s being implemented,
[00:09:38.690]
not how it acts specifically at one point in time.
[00:09:42.520]
So making sure that we understand
[00:09:44.230]
what the hydrology during this timeframe looks like
[00:09:47.440]
can be really important to making sure
[00:09:49.200]
that we’re getting it a good calibration by framing
[00:09:52.670]
this in the right timeframe.
[00:09:56.220]
These are just two examples of how we need to frame the data
[00:09:59.790]
that we do have in the right correct context of time.
[00:10:04.240]
So what this does is allows us to have a better constraint
[00:10:08.400]
on what that waste rock storage facility will look like
[00:10:11.830]
right at that moment in closure.
[00:10:14.640]
So that we have a fuller picture of what our starting point
[00:10:18.640]
might look like.
[00:10:19.473]
Knowing that there still is going
[00:10:20.740]
to be some uncertainty there,
[00:10:22.460]
but making sure that we have constrained that
[00:10:25.310]
as much as possible
[00:10:26.360]
before we start modeling
[00:10:27.680]
these waste rock storage facilities
[00:10:29.540]
way out into the future,
[00:10:31.240]
because we’re likely going to have a lot less confidence
[00:10:34.360]
in what are our predictions are,
[00:10:35.960]
what our models show us way out in the future,
[00:10:39.470]
because there is guaranteed to be more uncertainty.
[00:10:42.460]
For example, in the Arctic,
[00:10:45.620]
we’re dealing with some fairly significant
[00:10:48.380]
climate change conditions that are possible
[00:10:50.260]
in the future and understanding what the climate
[00:10:52.890]
looks like in 150 years is a much more difficult thing
[00:10:56.830]
to predict than what the climate will look like in 10 years.
[00:11:00.810]
So it’s really important for us
[00:11:02.610]
to frame all the existing data
[00:11:05.228]
or the data that we have in the short term
[00:11:09.950]
needs to be really framed in context for us
[00:11:11.920]
to be able to model long-term things more effectively.
[00:11:16.660]
So linking it all together,
[00:11:18.120]
we finally did turn on some numerical models.
[00:11:21.140]
So we use the Geostudio suite of models
[00:11:24.790]
using air/w, temp/w, CW NC tran,
[00:11:28.530]
because there are lots of different processes
[00:11:31.170]
as you saw when I went through the conceptual model
[00:11:33.750]
that affect the thermal conditions near surface.
[00:11:37.750]
So we have here is sort of the average annual temperature
[00:11:42.650]
near surface for this waste rock storage facility
[00:11:45.150]
in the long term.
[00:11:46.920]
So we have depth along the y-axis,
[00:11:48.500]
depths from surface.
[00:11:49.830]
Along the x-axis, we have an average annual year
[00:11:53.790]
and the black dash line
[00:11:55.630]
throughout the middle is the interface
[00:11:57.000]
between the cover system and the reactive waste rock.
[00:11:59.930]
So you do see that the active layer does extend
[00:12:04.260]
into the reactive waste rock.
[00:12:06.970]
So, if we think back to what our original objective was
[00:12:11.940]
and what our original conceptual model was,
[00:12:15.732]
we, if we were going to be asked,
[00:12:18.750]
does this meet the objective
[00:12:20.200]
of maintaining the active layer within the cover system?
[00:12:23.670]
The answer would have to be no.
[00:12:27.250]
However, we are missing a few important bits,
[00:12:30.400]
as I mentioned at the beginning.
[00:12:32.450]
So if we think only of the objective
[00:12:34.100]
as to maintain the freeze-thaw layer
[00:12:36.680]
within the cover system,
[00:12:38.720]
we’re missing the larger overarching objective
[00:12:40.840]
of achieving good water quality
[00:12:45.030]
and the assumption underlying that original conceptual model
[00:12:49.770]
or that original objective
[00:12:51.670]
that any speck of acid generating rock
[00:12:55.040]
that can thaw could lead to load is what’s driving
[00:13:00.470]
that flaw that the modeling is pointing out.
[00:13:04.720]
However, we’re not considering the time aspect, right?
[00:13:12.200]
So the assumption that any,
[00:13:13.730]
any speck of waste rock that could contribute to load
[00:13:16.210]
will contribute to load might be correct at sometime
[00:13:19.850]
in the future.
[00:13:20.830]
But what we see from the modeling is that
[00:13:23.070]
that’s not a correct assumption in the timeframes
[00:13:25.100]
that we’re looking at.
[00:13:26.820]
So understanding that if our conceptual model is static
[00:13:31.970]
and we don’t understand the processes
[00:13:34.700]
that are leading to the actual impact,
[00:13:38.180]
that we won’t have a good understanding
[00:13:39.940]
of whether the management strategy that we’re looking at
[00:13:43.160]
is successful or not.
[00:13:45.170]
So basically when we don’t consider the timeframe
[00:13:48.670]
in our modeling,
[00:13:49.634]
we lose all the color of the solution.
[00:13:54.050]
So really considering our conceptual model
[00:13:56.120]
in the context of time,
[00:13:58.950]
lets us move from that 2D drawing
[00:14:02.270]
to a more colorful picture.
[00:14:05.370]
So when we go back and look at the same results
[00:14:07.610]
in the context of time and the overarching objectives.
[00:14:13.600]
We can see that the anticipated performance of this
[00:14:18.600]
can’t be measured only by understanding
[00:14:21.030]
if the cover system remains frozen,
[00:14:24.010]
you need to have a greater look at what the impact of it
[00:14:27.170]
not being totally frozen all the time has on water quality.
[00:14:31.280]
So it could be that our management strategy
[00:14:34.270]
of the cover system works perfectly, stays frozen
[00:14:38.270]
and there’s no reactive waste rock that that ever thaws,
[00:14:40.950]
but we still could have water quality issues
[00:14:43.037]
if we think about this, how it was framed originally,
[00:14:47.860]
but that wouldn’t mean
[00:14:49.150]
that the management strategy is successful
[00:14:50.760]
because you still have a water quality issues.
[00:14:56.890]
So when we thought about the modeling
[00:14:59.270]
from a different perspective
[00:15:00.450]
and really thought about the conceptual models
[00:15:02.400]
and the different processes that are occurring
[00:15:04.440]
and linked it back to water quality,
[00:15:06.820]
and didn’t look at performance on just a frozen,
[00:15:09.950]
not frozen basis,
[00:15:11.320]
we’re able to have a fuller picture
[00:15:14.160]
of what successful closure might look like at the site.
[00:15:18.244]
So really what it boils down to
[00:15:20.290]
is that these successful closure designs
[00:15:22.040]
that might happen far out in the future
[00:15:25.610]
really need to have a strong conceptual model of performance
[00:15:28.480]
to be able to make successful management decisions.
[00:15:31.340]
So to do this,
[00:15:32.173]
you need to understand the effect of time on performance,
[00:15:35.140]
not just understand what might drive performance,
[00:15:38.060]
you need to context contextualize the field data
[00:15:40.590]
that you might have to make sure
[00:15:42.810]
that you’re making the right assumptions
[00:15:44.270]
with the data you have.
[00:15:46.090]
And during all this will allow you to project future
[00:15:49.280]
conditions with a bit greater confidence
[00:15:51.540]
than you would just thinking about your conceptual models
[00:15:54.776]
in a static space.
[00:15:58.240]
So thank you all for listening to this quick talk.
[00:16:01.500]
I hope you found something of interest
[00:16:03.920]
that you can take away.
[00:16:04.753]
And if you have any more questions
[00:16:06.130]
about this particular case study
[00:16:08.140]
or any other problems that you might be facing.
[00:16:10.210]
Feel free to reach out to us at [email protected].
[00:16:14.330]
Thanks.