


Ocean scientists work in not just three but four dimensions, including time, so presenting data in a way that others can understand can be challenging. One solution is to reduce the 4D data cube to three dimensions by taking a slice of time or another dimension, such as depth.
This ability to slice and dice data is invaluable to Terry Curran’s work for the Pacific Salmon Foundation, where he is building a web site that will contain all the marine data for British Columbia.
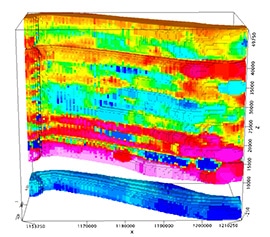
Shown beside: Dissolved oxygen in the Strait of Georgia.
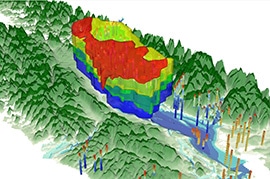
In a recent presentation at Canada’s Institute of Ocean Sciences (IOS), consultant Terry Curran explained how he uses Geosoft Oasis montaj to integrate oceanographic data and produce corresponding visuals. First he prepares the data for loading using Python, then groups the data for a particular time period, usually with a few days of scatter. The last step is to integrate other variables, such as elevation.
“The software has evolved amazingly over the past few years, so now I can easily take a vertical, horizontal or constant value slice through a 4D cube of data,” says Curran, who has used Oasis montaj to process more than 26 million oceanographic records gathered over the last fifty years.
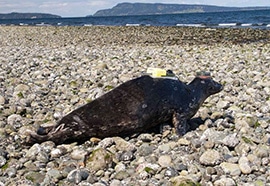
Passive Integrated Transponder (PIT) technology, similar to the chips on credit cards, is being used in the Strait of Georgia to track how many juvenile salmon are consumed by seals. Shown above a seal outfitted with a tag scanner heads back to marine waters.
Photo provided by the Pacific Salmon Foundation.
This ability to “slice and dice” data is proving invaluable to Curran’s work for the Pacific Salmon Foundation (PSF), where he is building a web site that will contain all the marine data for British Columbia. The process involves carefully documenting metadata, then creating and standardizing data layers so that anyone operating GIS can use the layers singly or in combination with other datasets.
Determining the causes of salmon loss
One of Curran’s jobs with the PSF is to manage data coming from citizen groups that contribute to the Foundation’s Salish Sea Marine Survival project. PSF launched the project in response to the dramatic decline in Chinook and Coho salmon populations in the Strait of Georgia (part of the Salish Sea) over the past 20 years. Recent catches in the Strait have been one tenth past levels, yet the causes of the decline remain somewhat of a mystery.
Using their own boats, each citizen group measures parameters such as conductivity, temperature, depth, oxygen, chlorophyll and turbidity with a secchi disk at 10 locations and on 20 separate occasions from February to October. Curran combines the wealth of citizen data to create spatial and temporal overviews of the physical differences.
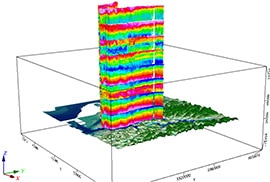
Eight Parameter stack measured by an ocean glider in the Douglas Channel.
He also makes maps from the results of nutrient sampling that can be telling. “My view is that the ocean is very like a garden. It takes bulk nutrients (N, P, K) and oxygen for free-floating plants to grow, zooplankton then graze upon the plants, and fish and marine mammals eat the zooplankton.”
Another component of the project uses Passive Integrated Transponder (PIT) technology, similar to the chips on credit cards, to track the survival rates of riverine smolts after they have hatched naturally or in a hatchery. Curran used Geosoft software to create 3D sensitivity plots of the beam patterns from antennas that detect the movement of the smolts.
The BC Conservation Foundation analysis of the results combined with complementary research being carried out at the University of British Columbia that places PIT tag scanners on the heads of seals suggests that seals in the estuaries are a main culprit behind the decline in salmon stocks. The researchers can actually see the seals eating the smolt whenever there is a pit tag detection together with a head strike.
Mapping the Douglas Channel
Another project where montaj played a role is mapping various parameters in the Douglas Channel near Kitimat, BC, where a private consortium is proposing to build a floating LNG (liquefied natural gas) terminal and storage unit, a jetty structure and mooring facilities.
This project measured temperature, salinity, chlorophyll, dissolved oxygen, turbidity and CDOM (coloured dissolved organic material) as a function of depth from a glider that navigated the channel during a two-week mission. The autonomous vehicle, supplied by the Canadian Centre for Ocean Gliders (CCOG) received GPS positions and transmitted data via satellite back to base, where Curran would generate maps and other visuals.
Surface chlorophyll sampled by ferry. This has the z-axis as datetime.
Curran says his ability to process data and provide 3D renderings of the results has advanced considerably since his previous work with gliders in the Strait of Georgia when he ran a technological group for the Canadian Hydrographic Service and acted as the industrial liason officer for the IOS.
Standardizing ocean research
As the burden of ocean research moves increasingly from government to various non-profit organizations with different protocols, it is imperative that the data generated be of academic journal quality that can stand up to peer review.
“We need to formalize the data processing so that any processing steps are defensible,” says Curran. “Regardless of the NGO or research lab, the standards would be the same.”
Curran believes the push to standardize ocean research data would benefit from Oasis montaj’s ability to integrate and clean data in one dimension, display the data in two dimensions, and provide gridding and slicing and dicing capabilities in three dimensions.