


A validação faz parte integrante do processo de modelagem geológica para garantir um modelo robusto.
Com o Leapfrog Geo e o Central, você pode criar fluxos de trabalho totalmente integrados para sua equipe. Inclua dados ou revise suas interpretações em qualquer fase do projeto, e essas mudanças serão aplicadas no final sem a necessidade de realizar nova configuração (scripting/programação) para atualizações e validações mais rápidas e tomadas de decisões eficientes.
A validação faz parte integrante do processo de modelagem geológica para garantir um modelo robusto. Com o Leapfrog Geo e o Central, você pode criar fluxos de trabalho totalmente integrados para sua equipe. Inclua dados ou revise suas interpretações em qualquer fase do projeto, e essas mudanças serão aplicadas no final sem a necessidade de realizar nova configuração (scripting/programação) para atualizações e validações mais rápidas e tomadas de decisões eficientes.
Junte-se a Jillian James (Geóloga de projetos) da Seequent para discutir:
- Validação da sua base de dados de furos de sondagem;
- Problemas de validação visual;
- Uso de ferramentas estatísticas do Leapfrog para validar seu modelo;
- Uso de filtros de consulta para testar áreas do seu modelo;
- Upload para a Central, para revisão por pares e validação final.
Visão geral
Palestrantes
Jillian James
Geólogo de projetos, Seequent
Duração
23 min
Veja mais vídeos sob demanda
VídeosSaiba mais sobre a solução da Seequent para mineração
Saiba maisTranscrição do vídeo
[00:00:03.980]<br />
<encoded_tag_open />v Jillian<encoded_tag_closed />Hi, everyone.<encoded_tag_open />/v<encoded_tag_closed /><!– wpml:html_fragment </p> –>
<p>[00:00:04.930]<br />
Thank you for taking the time to join me today</p>
<p>[00:00:07.330]<br />
for this Tip Tuesday on validating your Leapfrog Geo model.</p>
<p>[00:00:12.110]<br />
My name is Jillian James,</p>
<p>[00:00:13.680]<br />
and I’m a project geologist here in Seequent’s Perth Office.</p>
<p>[00:00:18.200]<br />
Seequent has a range of software</p>
<p>[00:00:20.090]<br />
for use throughout the exploration and mining value chain.</p>
<p>[00:00:24.600]<br />
Today, the focus will be on the functionality</p>
<p>[00:00:28.030]<br />
in Leapfrog Geo with a brief introduction</p>
<p>[00:00:31.010]<br />
to Seequent Central.</p>
<p>[00:00:35.580]<br />
The key aims of this session</p>
<p>[00:00:37.340]<br />
are to give you some tips and tricks</p>
<p>[00:00:39.630]<br />
on how to validate your Leapfrog Geo model</p>
<p>[00:00:42.500]<br />
and make validation an integral part of the modeling process</p>
<p>[00:00:46.640]<br />
rather than just an afterthought.</p>
<p>[00:00:50.121]<br />
In this session, we’ll cover:</p>
<p>[00:00:52.520]<br />
how to check the data feeding into your model is validated,</p>
<p>[00:00:57.040]<br />
tips on section by section validation,</p>
<p>[00:01:00.940]<br />
how you can use Leapfrog Geo statistical tools</p>
<p>[00:01:03.860]<br />
to validate your model,</p>
<p>[00:01:06.400]<br />
how you can use query filters to test areas of your model,</p>
<p>[00:01:10.760]<br />
for example, if you want to test where the model was barren,</p>
<p>[00:01:14.670]<br />
but the grades are above a certain value,</p>
<p>[00:01:18.200]<br />
where the model was mineralized,</p>
<p>[00:01:20.140]<br />
but the grades are below a certain value,</p>
<p>[00:01:23.750]<br />
and where the geology log does not match the model geology.</p>
<p>[00:01:29.540]<br />
Finally, we will look at how to upload your project</p>
<p>[00:01:32.480]<br />
to Central for peer review and final validation.</p>
<p>[00:01:38.800]<br />
The most important step in validating any geological model</p>
<p>[00:01:43.520]<br />
is to check that the data</p>
<p>[00:01:44.960]<br />
feeding into the model is validated.</p>
<p>[00:01:48.270]<br />
Remember, rubbish in equals rubbish out.</p>
<p>[00:01:52.980]<br />
Things you should check include looking to see</p>
<p>[00:01:57.110]<br />
that all the data is included in your project,</p>
<p>[00:02:00.710]<br />
including any unmineralized holes,</p>
<p>[00:02:05.150]<br />
understanding the impact that missing</p>
<p>[00:02:07.210]<br />
and null values may have on your model,</p>
<p>[00:02:09.640]<br />
and how the replacement rules are being implemented.</p>
<p>[00:02:15.120]<br />
Are there any extreme outliers, highs or lows,</p>
<p>[00:02:18.290]<br />
in your dataset?</p>
<p>[00:02:21.840]<br />
Does the data look to be in the correct spatial location</p>
<p>[00:02:25.970]<br />
relative to things such as development and topography?</p>
<p>[00:02:30.490]<br />
And are there any duplicate points or overlapping intervals?</p>
<p>[00:02:37.280]<br />
Leapfrog Geo automatically identifies and flags</p>
<p>[00:02:40.890]<br />
common data errors when data tables are imported.</p>
<p>[00:02:45.200]<br />
Until errors are corrected,</p>
<p>[00:02:48.150]<br />
the rows that contain those errors are excluded.</p>
<p>[00:02:51.980]<br />
For example, if the ID for a color</p>
<p>[00:02:54.510]<br />
contains an invalid coordinate,</p>
<p>[00:02:57.050]<br />
that color will not be displayed in the scene</p>
<p>[00:02:59.860]<br />
as its location is not known.</p>
<p>[00:03:03.230]<br />
This will also affect any downstream processing</p>
<p>[00:03:06.910]<br />
and it will ignore any data associated with this drillhole.</p>
<p>[00:03:12.060]<br />
We will now move into the software</p>
<p>[00:03:14.170]<br />
to look at this in more detail.</p>
<p>[00:03:18.830]<br />
This session will not cover building domains from scratch.</p>
<p>[00:03:22.850]<br />
So throughout the demonstration,</p>
<p>[00:03:24.740]<br />
I am going to make use of a project already created</p>
<p>[00:03:28.100]<br />
using the saved scenes to show the functionality.</p>
<p>[00:03:32.720]<br />
I’m going to use a dataset from a real underground goldmine</p>
<p>[00:03:36.210]<br />
that has since been mined out.</p>
<p>[00:03:38.780]<br />
Data locations and names have been changed</p>
<p>[00:03:41.330]<br />
to keep the project anonymous.</p>
<p>[00:03:44.430]<br />
Although I am demonstrating this functionality</p>
<p>[00:03:47.230]<br />
with respect to our underground narrow vein gold system,</p>
<p>[00:03:51.060]<br />
these validation tools can be useful</p>
<p>[00:03:53.370]<br />
in almost any deposit style or geological setting.</p>
<p>[00:03:58.180]<br />
If you need help with your individual project,</p>
<p>[00:04:00.900]<br />
please don’t hesitate to contact</p>
<p>[00:04:02.800]<br />
our friendly support team to assist you.</p>
<p>[00:04:07.840]<br />
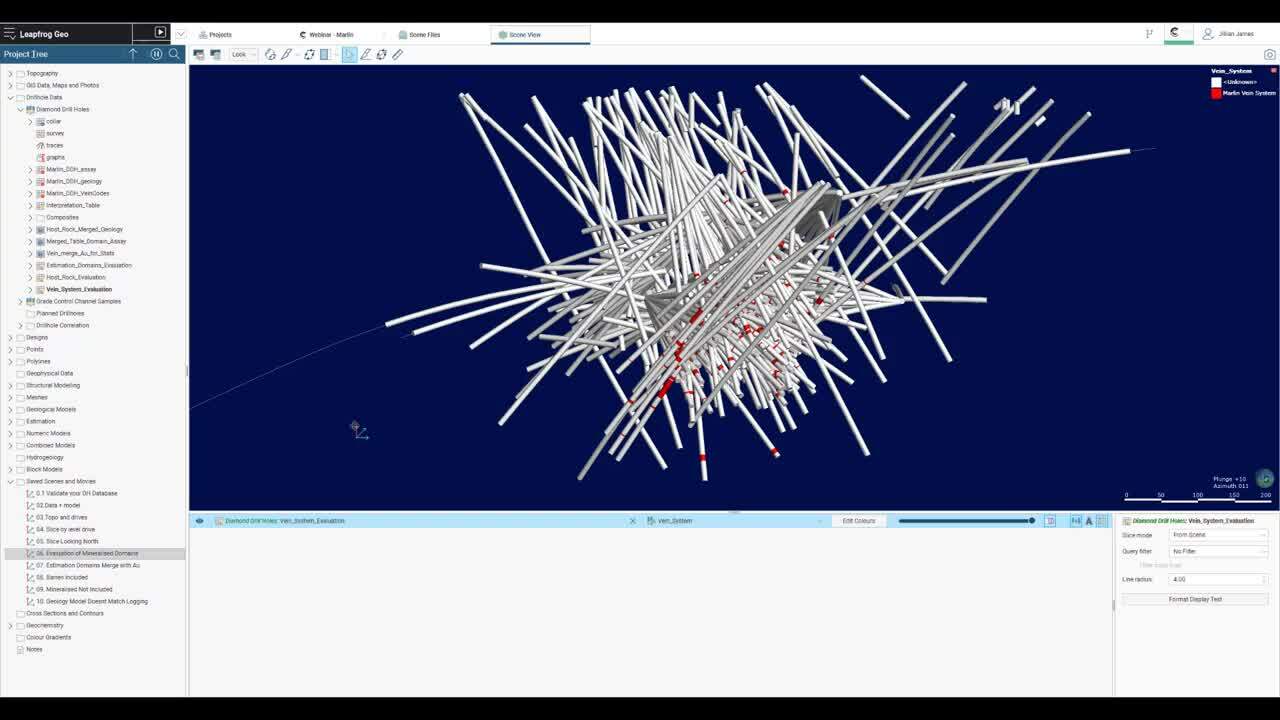
I will begin with validating the drillhole database.</p>
<p>[00:04:12.620]<br />
Over in my project tree,</p>
<p>[00:04:14.240]<br />
you can see I have a diamond drillhole database here</p>
<p>[00:04:17.930]<br />
and I’ve imported all these various table types</p>
<p>[00:04:21.890]<br />
to build my database.</p>
<p>[00:04:24.810]<br />
The red exclamation marks here on my assay, geology,</p>
<p>[00:04:28.420]<br />
and vein codes indicate that there is possibly an error.</p>
<p>[00:04:34.090]<br />
The orange exclamation mark on my survey</p>
<p>[00:04:36.880]<br />
indicates there is a warning.</p>
<p>[00:04:40.070]<br />
The blue downward pointing arrow</p>
<p>[00:04:43.500]<br />
indicates that the data has been imported correctly</p>
<p>[00:04:46.920]<br />
and there is no errors to fix.</p>
<p>[00:04:50.960]<br />
To fix an error, I right-click on one of these tables</p>
<p>[00:04:54.510]<br />
that has an error and select fix errors.</p>
<p>[00:05:00.890]<br />
This will open up a new tab</p>
<p>[00:05:04.467]<br />
and it will show me where these errors are occurring.</p>
<p>[00:05:09.720]<br />
This assay table actually has no errors,</p>
<p>[00:05:13.190]<br />
but it has some invalid values handling.</p>
<p>[00:05:18.970]<br />
If we look at this AU_PPM one,</p>
<p>[00:05:22.010]<br />
we can see that some rules have been applied</p>
<p>[00:05:25.210]<br />
to the non-positive values.</p>
<p>[00:05:28.150]<br />
So by default, it is going to replace them with 0.01.</p>
<p>[00:05:33.370]<br />
However, other rules have been applied</p>
<p>[00:05:36.870]<br />
for other values with the general rule of thumb</p>
<p>[00:05:40.980]<br />
usually replacing them with half the detection limit.</p>
<p>[00:05:50.470]<br />
Leapfrog Geo identifies a range of common errors</p>
<p>[00:05:54.580]<br />
and all errors identified are grouped by type.</p>
<p>[00:05:59.930]<br />
You can click on any error</p>
<p>[00:06:01.840]<br />
and expand it to find out more information.</p>
<p>[00:06:05.340]<br />
Some errors will involve you</p>
<p>[00:06:06.730]<br />
going back to the original database and fixing them</p>
<p>[00:06:10.360]<br />
and some errors can be ignored within Leapfrog Geo.</p>
<p>[00:06:16.660]<br />
Once the errors in the database are fixed and validated,</p>
<p>[00:06:20.530]<br />
you can be sure your model will have the most up-to-date</p>
<p>[00:06:23.730]<br />
accurate data feeding into it.</p>
<p>[00:06:30.070]<br />
Next, I can check that my drillhole data</p>
<p>[00:06:33.240]<br />
that I have imported is in the correct location</p>
<p>[00:06:36.650]<br />
to some of my features such as my topography</p>
<p>[00:06:43.000]<br />
and development drives.</p>
<p>[00:06:46.690]<br />
I can rotate in the 3D scene</p>
<p>[00:06:50.380]<br />
to check for any error in the survey data</p>
<p>[00:06:53.540]<br />
and ensure my drillholes are where I expect them to be.</p>
<p>[00:07:00.330]<br />
Using the slicer tool,</p>
<p>[00:07:01.990]<br />
I can then look at validating my model</p>
<p>[00:07:04.400]<br />
on a section by section basis.</p>
<p>[00:07:07.280]<br />
Here, I’m looking down on a Z section at the 852 RL.</p>
<p>[00:07:13.100]<br />
This shows that my mineralization model</p>
<p>[00:07:15.640]<br />
is following these development drives.</p>
<p>[00:07:20.400]<br />
If I step through a few more sections</p>
<p>[00:07:23.440]<br />
using the greater than or less than keys on my keyboard</p>
<p>[00:07:27.730]<br />
on a set step width,</p>
<p>[00:07:29.980]<br />
I can see the model changes at other RLs</p>
<p>[00:07:34.390]<br />
and how this matches my development.</p>
<p>[00:07:43.920]<br />
Alternatively, I can do this process</p>
<p>[00:07:47.050]<br />
on a vertical cross-section.</p>
<p>[00:07:49.700]<br />
Here, I am looking north through a slice of my model</p>
<p>[00:07:53.070]<br />
with development drives and drillholes.</p>
<p>[00:07:56.770]<br />
If I stepped through my model using the greater than</p>
<p>[00:07:59.990]<br />
or less than keys on my keyboard,</p>
<p>[00:08:03.950]<br />
you can visually validate that your model</p>
<p>[00:08:08.150]<br />
is matching those development drives</p>
<p>[00:08:11.610]<br />
and following any drillhole logging or assays.</p>
<p>[00:08:20.050]<br />
This method is one of the more traditional ways</p>
<p>[00:08:22.540]<br />
to validate a model and it can be quite time-consuming.</p>
<p>[00:08:27.030]<br />
Leapfrog also has some other unique tools</p>
<p>[00:08:29.680]<br />
that help you identify areas of your model</p>
<p>[00:08:32.000]<br />
that may require further investigation.</p>
<p>[00:08:35.550]<br />
The first tool I will show you</p>
<p>[00:08:37.040]<br />
is the correlation statistical tool.</p>
<p>[00:08:40.210]<br />
This shows you the correlation between the model geology</p>
<p>[00:08:43.550]<br />
and the log geology.</p>
<p>[00:08:46.170]<br />
To do this, you need to evaluate your mineralized model</p>
<p>[00:08:49.657]<br />
and your geological model onto your drillholes.</p>
<p>[00:08:54.300]<br />
You do this by right-clicking on your drillhole database</p>
<p>[00:08:59.040]<br />
and selecting new evaluation table.</p>
<p>[00:09:03.835]<br />
I have already completed this process</p>
<p>[00:09:06.660]<br />
and if I bring this evaluation of my mineralized domains</p>
<p>[00:09:10.660]<br />
into my scene and have a look,</p>
<p>[00:09:13.490]<br />
you can see it shows me</p>
<p>[00:09:16.410]<br />
where my mineralized domains are on my drillholes.</p>
<p>[00:09:25.530]<br />
Once I have a evaluation table set up,</p>
<p>[00:09:29.250]<br />
I then can come to their evaluation in my project tree,</p>
<p>[00:09:34.320]<br />
right-click and select statistics.</p>
<p>[00:09:41.030]<br />
This will bring up a correlation statistics table</p>
<p>[00:09:44.850]<br />
showing me my drilling lithology, my drilling length,</p>
<p>[00:09:50.180]<br />
my matching length, matching percent,</p>
<p>[00:09:54.870]<br />
non-matching length, and non-matching percent of my model.</p>
<p>[00:10:04.922]<br />
In this example,</p>
<p>[00:10:05.755]<br />
I’ve shown this for the mineralized vein system,</p>
<p>[00:10:08.700]<br />
but this can also be used to test an entire geological model</p>
<p>[00:10:12.620]<br />
to determine where more refinement is needed.</p>
<p>[00:10:19.970]<br />
Alternatively, you can create a merged table</p>
<p>[00:10:23.180]<br />
of your evaluated domains with your original assay data,</p>
<p>[00:10:27.790]<br />
and then look at the statistics</p>
<p>[00:10:29.770]<br />
to help validate your domains.</p>
<p>[00:10:32.920]<br />
You do this up here in the drillhole database,</p>
<p>[00:10:38.830]<br />
right-click on your drillholes and select new merged table.</p>
<p>[00:10:44.390]<br />
Again, I’ve already created this</p>
<p>[00:10:46.890]<br />
where I’ve merged my vein lithologies for my domain</p>
<p>[00:10:52.340]<br />
with my gold grades.</p>
<p>[00:10:56.420]<br />
I think can right-click on this table and select statistics.</p>
<p>[00:11:04.360]<br />
You then can choose which type of statistics</p>
<p>[00:11:06.757]<br />
you want to look at.</p>
<p>[00:11:08.380]<br />
Firstly, I’ll look at this table of statistics</p>
<p>[00:11:12.760]<br />
and this will open up a new tab showing you your domains</p>
<p>[00:11:19.000]<br />
with the mean grade, standard deviation, variance,</p>
<p>[00:11:23.630]<br />
and quantile data for each of your domain codes.</p>
<p>[00:11:34.210]<br />
You can also do this for a box plot.</p>
<p>[00:11:37.710]<br />
Again, right-click on your merged table, select statistics,</p>
<p>[00:11:44.100]<br />
choose the box plot option</p>
<p>[00:11:49.070]<br />
where you can view each of your domains as a box plot</p>
<p>[00:11:54.080]<br />
to get a visual indication of where any outliers are</p>
<p>[00:11:58.420]<br />
within your domains</p>
<p>[00:12:00.540]<br />
and the main grades of each of these domains.</p>
<p>[00:12:07.000]<br />
I’ve applied a log scale to this chart</p>
<p>[00:12:10.010]<br />
to help see this better</p>
<p>[00:12:12.840]<br />
as the status here is very negatively skewed.</p>
<p>[00:12:20.030]<br />
I can also have a look at the histogram of a single domain.</p>
<p>[00:12:24.780]<br />
This will allow me to examine the data distribution</p>
<p>[00:12:27.700]<br />
within the domain and check it’s forming a population</p>
<p>[00:12:31.130]<br />
that meets the assumptions of stationarity.</p>
<p>[00:12:34.540]<br />
This is where the mean and variance</p>
<p>[00:12:36.130]<br />
do not change across the domain</p>
<p>[00:12:38.700]<br />
and will enable it to be used in downstream estimation</p>
<p>[00:12:42.230]<br />
or numeric modeling.</p>
<p>[00:12:44.750]<br />
To do this, I come to the merged table, open it up,</p>
<p>[00:12:50.130]<br />
and come to the numeric data of interest,</p>
<p>[00:12:54.560]<br />
right-click and select statistics.</p>
<p>[00:12:59.330]<br />
This will open up a new tab</p>
<p>[00:13:03.240]<br />
showing us the histogram of the data.</p>
<p>[00:13:07.280]<br />
Here, I can apply a query filter.</p>
<p>[00:13:10.550]<br />
I’ve built one just for this 4,400 domain</p>
<p>[00:13:14.090]<br />
so I’m only looking at the data within that domain.</p>
<p>[00:13:18.650]<br />
I can then detach this</p>
<p>[00:13:25.890]<br />
and have a look at where some of the anomalous grades</p>
<p>[00:13:29.110]<br />
are occurring in my scene view.</p>
<p>[00:13:32.970]<br />
I will hide some of these estimation domains</p>
<p>[00:13:36.700]<br />
and demonstrate how you do this.</p>
<p>[00:13:39.770]<br />
So if I feel anything above this area was anomalous,</p>
<p>[00:13:44.300]<br />
I could highlight and then I could have a look in my scene</p>
<p>[00:13:49.490]<br />
to see if that is actually sporadic</p>
<p>[00:13:53.770]<br />
or is it forming another domain population.</p>
<p>[00:13:59.860]<br />
In relation to this 4,400,</p>
<p>[00:14:02.530]<br />
if I turn that on and turn down the translucency,</p>
<p>[00:14:08.570]<br />
I can see that this is pretty sporadic across my domain.</p>
<p>[00:14:16.060]<br />
I can reattach that tab</p>
<p>[00:14:20.370]<br />
and then I can also look at the histogram of the log</p>
<p>[00:14:26.116]<br />
or the cumulative histogram.</p>
<p>[00:14:35.340]<br />
Once you have a merged table</p>
<p>[00:14:37.420]<br />
of your evaluated domains with grade,</p>
<p>[00:14:40.440]<br />
you can then utilize query filters</p>
<p>[00:14:42.830]<br />
to test things in your model.</p>
<p>[00:14:45.900]<br />
Here in my scene, I have applied a query filter</p>
<p>[00:14:50.290]<br />
to show me where there are bearing grades</p>
<p>[00:14:52.780]<br />
included within my mineralized model.</p>
<p>[00:14:56.150]<br />
I’ve created this query filter</p>
<p>[00:14:58.200]<br />
by right-clicking on my merged table</p>
<p>[00:15:02.140]<br />
and selecting new query filter.</p>
<p>[00:15:05.810]<br />
I’ve previously built this so open this one up for you</p>
<p>[00:15:09.870]<br />
and you can see the syntax applied to build that query.</p>
<p>[00:15:14.530]<br />
We also have the easy build query function</p>
<p>[00:15:18.520]<br />
where you can come in and apply your query.</p>
<p>[00:15:22.020]<br />
Here, I’ve selected where my AU_PPM</p>
<p>[00:15:25.340]<br />
is less than or equal to 0.3</p>
<p>[00:15:30.890]<br />
and my estimation domains</p>
<p>[00:15:33.190]<br />
are within these four domains shown.</p>
<p>[00:15:37.210]<br />
We also have the advanced query filter builder</p>
<p>[00:15:41.030]<br />
that you can utilize for your project.</p>
<p>[00:15:47.130]<br />
Once I’ve built my query filter,</p>
<p>[00:15:49.110]<br />
I can drag and drop that in the scene</p>
<p>[00:15:51.570]<br />
and that query will be applied.</p>
<p>[00:15:54.210]<br />
You can also apply the query filter</p>
<p>[00:15:56.340]<br />
over here in your properties.</p>
<p>[00:16:00.330]<br />
If I zoom in and look around my project,</p>
<p>[00:16:03.430]<br />
I can now see areas that I need to go and investigate</p>
<p>[00:16:06.970]<br />
to understand why these barren grades have been included</p>
<p>[00:16:11.100]<br />
within my mineralized model.</p>
<p>[00:16:16.220]<br />
Next, I can use a similar process</p>
<p>[00:16:18.860]<br />
to test where I have mineralized grade</p>
<p>[00:16:21.690]<br />
that has not been included in my mineralized model.</p>
<p>[00:16:25.810]<br />
Here in the scene,</p>
<p>[00:16:26.680]<br />
you can see I have applied this query filter</p>
<p>[00:16:29.680]<br />
and I’ve built it by right-clicking again,</p>
<p>[00:16:33.380]<br />
selecting new query filter.</p>
<p>[00:16:38.670]<br />
And if I come into my prebuilt query filter, open that up,</p>
<p>[00:16:44.230]<br />
you can see I’ve done the reverse of our first one</p>
<p>[00:16:47.690]<br />
where I’ve said if it’s greater than or equal to 0.3</p>
<p>[00:16:52.140]<br />
and it’s not in our domains,</p>
<p>[00:16:55.100]<br />
then it’s considered mineralized outside of the domains.</p>
<p>[00:17:01.000]<br />
This is then being applied in my scene.</p>
<p>[00:17:04.750]<br />
And in this example,</p>
<p>[00:17:05.790]<br />
you can see there’s quite a lot outside my model.</p>
<p>[00:17:09.660]<br />
That is because there is actually quite a few</p>
<p>[00:17:13.336]<br />
unmodeled domains in this project.</p>
<p>[00:17:19.850]<br />
You can also use query filters to test areas of your model</p>
<p>[00:17:24.760]<br />
to see where geology code logged</p>
<p>[00:17:27.060]<br />
does not match geology modeled.</p>
<p>[00:17:30.870]<br />
To do this, I’ve created an evaluation of my host rock model</p>
<p>[00:17:36.300]<br />
and merged that with my geological lithology table.</p>
<p>[00:17:41.540]<br />
I’ve then built a query filter here</p>
<p>[00:17:44.260]<br />
to test where my end site is outside my model.</p>
<p>[00:17:49.660]<br />
If I have a look at my scene,</p>
<p>[00:17:51.580]<br />
I can rotate and zoom in on some of these areas,</p>
<p>[00:17:56.990]<br />
click on a hole and I can go and investigate</p>
<p>[00:17:59.930]<br />
why that is outside that geology unit.</p>
<p>[00:18:08.250]<br />
If I did want to examine a hole in more detail,</p>
<p>[00:18:11.400]<br />
I can use the drillhole correlation tool</p>
<p>[00:18:14.200]<br />
here under my drillhole database</p>
<p>[00:18:18.460]<br />
to examine in further detail.</p>
<p>[00:18:21.110]<br />
I right-click on this and select new drillhole set,</p>
<p>[00:18:25.200]<br />
which brings me out to a new drillhole set tab.</p>
<p>[00:18:28.830]<br />
I then select the pit color function,</p>
<p>[00:18:32.770]<br />
which will take me back to my scene view.</p>
<p>[00:18:35.900]<br />
I then choose my select drillhole button</p>
<p>[00:18:40.320]<br />
and choose the hole I’m interested.</p>
<p>[00:18:44.260]<br />
I then can click save</p>
<p>[00:18:46.810]<br />
and then it would appear here in my drillhole set layer</p>
<p>[00:18:52.340]<br />
where I can bring across my host rock</p>
<p>[00:18:56.630]<br />
model</p>
<p>[00:18:58.510]<br />
and my original logging.</p>
<p>[00:19:01.400]<br />
And then I can come in and identify</p>
<p>[00:19:04.700]<br />
why I have these different areas</p>
<p>[00:19:08.090]<br />
within my model versus my logging.</p>
<p>[00:19:14.120]<br />
The final validation step for any project</p>
<p>[00:19:17.290]<br />
is always to have your project peer reviewed</p>
<p>[00:19:19.920]<br />
by one of your colleagues.</p>
<p>[00:19:22.580]<br />
To do this, we are going to use Seequent Central.</p>
<p>[00:19:25.920]<br />
I will show you this briefly.</p>
<p>[00:19:28.120]<br />
However, we have another webinar on this</p>
<p>[00:19:30.560]<br />
that was completed earlier this year</p>
<p>[00:19:33.210]<br />
by one of my colleagues,</p>
<p>[00:19:34.540]<br />
so please feel free to check out this video recording</p>
<p>[00:19:37.690]<br />
on the Seequent website.</p>
<p>[00:19:40.400]<br />
To upload your project,</p>
<p>[00:19:42.140]<br />
you will need to be connected to the Central server.</p>
<p>[00:19:45.720]<br />
You can do so by connecting up here</p>
<p>[00:19:47.850]<br />
in your right-hand corner.</p>
<p>[00:19:50.210]<br />
Once you are connected, you select publish.</p>
<p>[00:19:59.010]<br />
You select which objects you would like to appear</p>
<p>[00:20:01.700]<br />
in your online web browser.</p>
<p>[00:20:06.740]<br />
Select next.</p>
<p>[00:20:09.240]<br />
Set your project workflow stage.</p>
<p>[00:20:11.780]<br />
I’m going to choose peer review for this one.</p>
<p>[00:20:14.930]<br />
Select next.</p>
<p>[00:20:17.520]<br />
Add in any revision notes for your colleagues</p>
<p>[00:20:21.390]<br />
and then select next to start the publish and upload.</p>
<p>[00:20:32.420]<br />
Once your project has finished publishing,</p>
<p>[00:20:35.350]<br />
it will say publish successful here in the dropdown menu,</p>
<p>[00:20:39.530]<br />
and it will be available for your colleagues to download</p>
<p>[00:20:43.070]<br />
if they have the right permissions and access to Central.</p>
<p>[00:20:48.110]<br />
It is also now available via the web browser</p>
<p>[00:20:53.690]<br />
for non-Leapfrog Geo users such as managers</p>
<p>[00:20:57.310]<br />
to review via Web-Verse and make comments.</p>
<p>[00:21:01.960]<br />
To do this, you can select go to portal</p>
<p>[00:21:09.040]<br />
and this will take you to the appropriate web browser</p>
<p>[00:21:13.720]<br />
where your project is stored.</p>
<p>[00:21:17.000]<br />
As you can see, it’s got the revision note</p>
<p>[00:21:20.300]<br />
saying please review this project.</p>
<p>[00:21:23.270]<br />
It’s got the stage of peer review</p>
<p>[00:21:26.240]<br />
and it’s got the user who uploaded that project.</p>
<p>[00:21:30.260]<br />
You can then select the project</p>
<p>[00:21:33.250]<br />
to view within the web browser,</p>
<p>[00:21:36.250]<br />
come to your geological model,</p>
<p>[00:21:38.900]<br />
open up your domains and have a look at these</p>
<p>[00:21:43.610]<br />
without needing access to a Leapfrog Geo license.</p>
<p>[00:21:57.260]<br />
Comments can then be made by clicking on this comment button</p>
<p>[00:22:04.040]<br />
and selecting add comments.</p>
<p>[00:22:06.670]<br />
These can be geo tagged on your domain</p>
<p>[00:22:11.200]<br />
and you can tag your colleagues here</p>
<p>[00:22:13.190]<br />
so they get an instant notification</p>
<p>[00:22:16.300]<br />
on any area to go and look at in further detail.</p>
<p>[00:22:23.400]<br />
That brings me to the conclusion of today’s webinar.</p>
<p>[00:22:27.020]<br />
If you require any further information,</p>
<p>[00:22:30.040]<br />
please refer to the Seequent website,</p>
<p>[00:22:32.280]<br />
which has many blogs, webinar recordings, and videos</p>
<p>[00:22:36.435]<br />
to help you with your learning.</p>
<p>[00:22:37.770]<br />
We also have a great series of free online courses</p>
<p>[00:22:40.950]<br />
to help up-skill which can be found</p>
<p>[00:22:44.180]<br />
under your MySeequent account.</p>
<p>[00:22:47.040]<br />
If you do need any additional help,</p>
<p>[00:22:49.520]<br />
please reach out to your local support team</p>
<p>[00:22:51.610]<br />
who will be willing to assist.</p>
<wpml_invalid_tag original=”PHA+” />[00:22:57.670]<br />
Thank you.