
Connecting data, design and people on HS2 high speed rail, UK
Mott MacDonald’s collaborative partnership with Seequent has led to their solutions becoming part of our everyday suite of tools for ground engineers.
This presentation outlines how Seequent’s 3D modelling software and interconnected management and collaboration tools have been key to the understanding, interpretation and communication of ground related data on the UK’s High-Speed Rail – Phase 1 Project. Case studies will show how these tools have supported communication of the ongoing ‘just in time’ ground investigation and enabled better cross-team collaboration and decision making.
Overview
Speakers
Pete Fair
3D Geological Modelling Specialist – Mott MacDonald
Duration
17 min
See more on demand videos
VideosFind out more about Seequent's civil solutions
Learn moreVideo Transcript
[00:00:16.830]
<v ->Good morning, good afternoon, good evening to you all.</v>
[00:00:20.170]
My name is Peter Fair,
[00:00:21.450]
I work for Mott MacDonald global engineering, management
[00:00:24.000]
and development consultancy,
[00:00:25.870]
working across a broad range of sectors across the globe.
[00:00:28.940]
I did a civil engineering degree
[00:00:30.350]
and came directly into the geotechnical world 20 years ago
[00:00:33.560]
when I joined Mott MacDonald,
[00:00:35.250]
and over the last five to 10 years,
[00:00:37.460]
I’ve migrated to all things at GE.
[00:00:41.510]
Today I’m going to present to you something
[00:00:42.790]
that is right at the heart of what we do at Mott MacDonald,
[00:00:45.370]
and that is connecting data, designs and people.
[00:00:49.770]
And specifically I’m going to be looking at this
[00:00:51.450]
from the perspective of HS2.
[00:00:55.290]
So I will run through what HS2 is.
[00:00:59.960]
We’ll probably have a look at a couple of case studies,
[00:01:03.460]
and then to wrap it up,
[00:01:04.730]
we’ll look at how we’ve done collaboration,
[00:01:07.860]
feature developments and wrap finally with some conclusions.
[00:01:15.120]
So why is this important to us?
[00:01:17.200]
Well, in the UK,
[00:01:18.190]
it is noted that over 60% of construction claims
[00:01:21.100]
are due to ground risk.
[00:01:22.830]
Furthermore, a report from the National Audit Office
[00:01:25.620]
showed that on commercial building construction projects,
[00:01:28.240]
where there were delays by more than one month,
[00:01:30.350]
1/2 of these were due to ground-related problems.
[00:01:33.820]
In this sector, we still have a lot of work to do.
[00:01:37.090]
Geotechnics has for far too long been a service provider
[00:01:39.760]
to the other disciplines.
[00:01:41.790]
It’s in a world that is pushing
[00:01:42.930]
the boundaries of height and depth
[00:01:45.210]
with the added overtones of value for money
[00:01:47.920]
and right to win.
[00:01:49.490]
We have found that geotechnical risk
[00:01:50.770]
is becoming more and more important in many of our jobs.
[00:01:54.690]
And as ground practitioners,
[00:01:57.010]
in which we include geotechnics, geologists,
[00:01:59.040]
contamination, hydrologists
[00:02:00.810]
and some aspects of the environment teams,
[00:02:03.220]
we have found that we need to be able to communicate
[00:02:06.040]
both the risks and the opportunities that we see,
[00:02:09.080]
not only on our internal project teams,
[00:02:12.210]
but also to the wider management stakeholders
[00:02:14.380]
and of course, the client.
[00:02:17.650]
The development of Seequent Central environment
[00:02:20.440]
has allowed us to accelerate into this area
[00:02:22.700]
with the right tools.
[00:02:25.230]
Primarily, Leapfrog works,
[00:02:27.520]
that not only does good 3D ground modeling,
[00:02:30.030]
but also allows us to work readily
[00:02:31.420]
within the BIM environment
[00:02:33.060]
and give us an incredible tool to talk about
[00:02:34.831]
and visualize all things
[00:02:36.880]
that are related to ground risk and opportunities
[00:02:39.420]
that our projects may face.
[00:02:41.230]
And then that sits within the Central environment
[00:02:43.270]
which gives us that model management and collaboration tool,
[00:02:46.360]
and which helps to bring everything together.
[00:02:50.350]
The visually rich environment
[00:02:51.720]
that this suite of tools gives us
[00:02:53.790]
brings everyone into the same space
[00:02:55.930]
and with the same understanding
[00:02:57.157]
and where we can start linking our
[00:02:59.340]
and our designs and our people.
[00:03:03.930]
So, welcome to HS2, the new high-speed railway that will run
[00:03:07.990]
from London north up to Manchester and to Leeds.
[00:03:11.430]
Currently the largest civils project in Europe
[00:03:14.550]
with the ideals of better connecting those in the north,
[00:03:17.770]
reducing travel times to London
[00:03:19.790]
and increasing capacity on our over-full network.
[00:03:24.160]
Phase one of HS2 is highlighted here in red
[00:03:26.810]
and runs between London and Birmingham.
[00:03:29.770]
And the northern lots of phase one
[00:03:33.050]
are known as N1N2
[00:03:35.060]
and they’ll be run by Balfour Beatty VINCI.
[00:03:38.290]
Balfour Beatty and VINCI are the contractors
[00:03:40.700]
and Mott MacDonald and SYSTRA are the designers in this,
[00:03:44.530]
known as the DJV.
[00:03:47.740]
So this is the northern part of phase one
[00:03:50.130]
and goes up into Birmingham and back out again
[00:03:53.150]
and provides links for phase two
[00:03:55.700]
to Manchester in the northwest and Leeds in the northeast.
[00:04:00.240]
Now here’s some key facts for N1N2.
[00:04:03.890]
There are over 100 mainline assets
[00:04:06.010]
across the 90 kilometers of the route.
[00:04:08.080]
And in total, there’re are a sum of 350 assets
[00:04:10.420]
within the N1N2 contract alone,
[00:04:12.730]
including 40 kilometers of embankments,
[00:04:14.840]
35 kilometers of cuttings,
[00:04:16.280]
12 kilometers of viaducts, four kilometers of bored tunnels,
[00:04:19.210]
10 kilometers of retaining walls, 100 bridges,
[00:04:21.850]
and the list goes on.
[00:04:24.100]
The contract value for N1N2 alone
[00:04:26.810]
is around 6 billion pounds.
[00:04:29.420]
Currently there are over 5,500 exploratory locations
[00:04:32.470]
already in the database,
[00:04:34.500]
and we have a further 2,000 planned over the next 18 months.
[00:04:39.330]
So there are multiple phases of ground investigation
[00:04:41.189]
that have taken place so far.
[00:04:43.080]
Currently we’re up to 24 different contracts
[00:04:45.710]
within our database.
[00:04:47.440]
These include the HS2-led GI for N1N2.
[00:04:51.240]
Early it was contracted GIs, third-party GIs
[00:04:54.090]
in addition to our own Balfour Beatty-led GI.
[00:05:00.650]
We are running a current ground investigation simultaneously
[00:05:03.101]
alongside the ongoing design
[00:05:05.030]
with assets split across different design phases,
[00:05:08.170]
e.g. scheme design and detail design.
[00:05:10.630]
And so this has coined the phrase just-in-time GI.
[00:05:15.260]
Making up the BBV JV
[00:05:17.220]
are a large number of multi-faceted teams
[00:05:19.470]
working across many offices, companies and time zones.
[00:05:25.832]
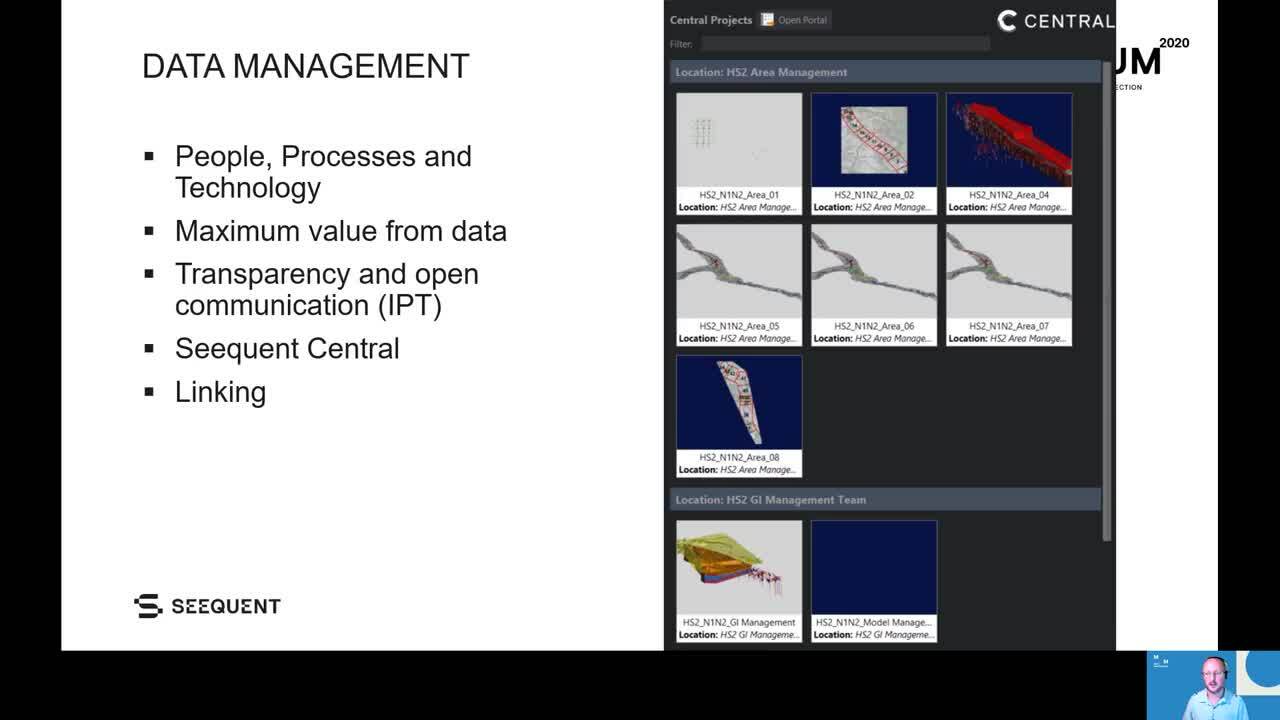
At the heart of this is good data management strategy
[00:05:28.620]
for the ground-related data.
[00:05:30.710]
On N1N2, this is centered around people,
[00:05:33.550]
processes and technology.
[00:05:35.840]
Crucially, none of these components
[00:05:37.460]
have been considered in isolation.
[00:05:40.090]
In the right balance,
[00:05:41.170]
this should avoid potential alienation, frustration,
[00:05:43.790]
or automated chaos.
[00:05:45.820]
And getting this right paves the way
[00:05:47.220]
for us to connect the data and the designs to the people
[00:05:50.250]
in a way that adds a real value to the project
[00:05:52.600]
and motivates and encourages people in their work.
[00:05:56.500]
It is crucial that ground investigation data
[00:05:58.130]
is appropriately structured
[00:05:59.580]
to obtain the maximum value of the data
[00:06:01.940]
across a full geotechnical lifecycle.
[00:06:04.310]
And this is particularly important in HS2
[00:06:06.190]
where time is of the essence and there’s overlap
[00:06:08.850]
between the just-in-time ground investigation
[00:06:10.820]
and the staggered design phases.
[00:06:14.000]
To overcome these challenges,
[00:06:15.200]
the integrated GI team have championed transparency
[00:06:18.300]
and open communication between the BBV, the DJV
[00:06:20.926]
and the GI contractors
[00:06:23.030]
and an integrated product team is in place
[00:06:26.840]
so that everyone has a collective responsibility
[00:06:29.010]
for delivering that project.
[00:06:30.920]
The emphasis of the IPT
[00:06:32.060]
is on the involvement of all the stakeholders,
[00:06:34.230]
together delivering in a collaborative form.
[00:06:39.620]
To assist our GI management strategy,
[00:06:41.660]
we have (indistinct) Seequent Central
[00:06:43.260]
and created a bespoke HS2 working environment
[00:06:46.100]
with a specific GI management model.
[00:06:48.970]
And then seven-area management models to support that
[00:06:52.120]
right at the heart of the process.
[00:06:55.470]
Central allows us to track and trace the GI data
[00:06:58.380]
and the 3D models in a 4D way.
[00:07:00.670]
And this is auditable and visible,
[00:07:03.050]
and it allows any members of any of the teams
[00:07:05.270]
to easily understand what model is the most up-to-date
[00:07:08.890]
and what data sits within that model.
[00:07:11.830]
So within the world of geotechnics,
[00:07:13.620]
we have found that with the right technology and processes,
[00:07:17.060]
we can now link our data, our designs to our people.
[00:07:24.730]
So the best ground investigations
[00:07:26.080]
are informed directly by design requirements
[00:07:28.790]
and adapt as a design
[00:07:30.430]
and the understanding of the ground conditions evolve.
[00:07:34.050]
Due to time constraints of running a just-in-time GI
[00:07:37.410]
where the ground investigation
[00:07:38.930]
is occurring in parallel with the design,
[00:07:42.290]
the ground investigation must be able to quickly adapt
[00:07:45.250]
to any changes in the design.
[00:07:48.040]
And using our monthly GI management model as shown here
[00:07:51.530]
has enabled this on N1N2
[00:07:53.880]
by bringing together the latest BIM models,
[00:07:56.380]
existing and proposed exploratory holes
[00:07:58.620]
and interpreters of ground conditions, all in one place.
[00:08:02.500]
Additionally, the user is dynamically signposted
[00:08:05.640]
to the factual reports by the URL.
[00:08:08.670]
This has better equipped the BBV GI team
[00:08:12.150]
to make more informed right decisions onsite
[00:08:14.760]
without trolling through design models,
[00:08:16.430]
long sections and factual reports,
[00:08:18.180]
or endlessly having to contact the designers.
[00:08:21.900]
So for our teams to see the data alongside the designs
[00:08:25.020]
in a 3D environment
[00:08:26.480]
has added real value to the whole process.
[00:08:32.010]
Examples of where this has directly benefited
[00:08:34.080]
the N1N2 ground investigation include an understanding
[00:08:38.020]
of where the proposed ground investigation is
[00:08:40.130]
in relation to the current available GI and the processes.
[00:08:43.300]
The purple sticks here on screen
[00:08:45.230]
show where that proposed GI is planned.
[00:08:48.860]
We’ve then been able to use it
[00:08:49.950]
to target sampling and lab testing,
[00:08:52.390]
for instance, at the proposed depth of base of piles
[00:08:54.750]
or other foundations,
[00:08:56.360]
we’ve used it to review field and laboratory data
[00:08:59.060]
on the existing locations, and to identify gaps in data
[00:09:02.940]
and then the anomalies in that data.
[00:09:05.500]
We’ve then used it to see the spatial distribution
[00:09:08.770]
of certain types of datasets needed to support the design,
[00:09:14.330]
e.g. maybe like sulfates or compaction testing, et cetera.
[00:09:21.310]
We’ve then used it as a pseudo clash detection tool.
[00:09:24.147]
And in this case, we had lost some casing down a borehole,
[00:09:27.740]
and we were able to show that in relation to the drawing,
[00:09:31.160]
it was over 13 meters away and therefore safe.
[00:09:36.130]
Now the detail and information is there
[00:09:38.320]
in the model going forward now should the design change.
[00:09:41.730]
And we’ve been able to quickly and visually compare
[00:09:44.390]
the new GI data with the previous data
[00:09:46.830]
and any interpretation.
[00:09:48.710]
The top image here is showing the design as it was.
[00:09:52.930]
And then as we’ve got new GI data in,
[00:09:56.090]
we’ve been able to see where that new GI data is
[00:09:58.580]
and the new interpretation.
[00:10:01.490]
And these changes have used the enhanced tool in Central.
[00:10:07.420]
These are all particularly important detailed design stage
[00:10:10.340]
where the new data access validation for the design
[00:10:13.770]
and where the realization of risks and opportunities
[00:10:16.280]
need to be identified
[00:10:17.750]
and acted upon quickly to avoid significant costs
[00:10:20.680]
and program delays.
[00:10:23.010]
So once again, this is all about supporting the GI delivery
[00:10:25.850]
and getting the data to the teams
[00:10:28.020]
as quickly and efficiently as possible.
[00:10:32.050]
For our second case study,
[00:10:33.340]
we are going to look at Streethay cutting.
[00:10:35.530]
It is a two-kilometer-long cutting and 20-meter deep.
[00:10:38.550]
Under scheme design,
[00:10:39.560]
it was suggested that there would be a shallow cut
[00:10:42.490]
with a deeper piled retain cut below that.
[00:10:46.980]
This was the best design at that stage
[00:10:49.330]
due to constraints around that asset
[00:10:53.010]
with particular concern around water levels
[00:10:55.380]
and local abstraction wells.
[00:10:57.890]
As more GI data became available throughout the design,
[00:11:00.730]
it was suggested that these constraints could still be met
[00:11:03.480]
even with a simpler design
[00:11:05.610]
and just with a deep open cut
[00:11:11.480]
and therefore being able to remove
[00:11:13.800]
the need for the retained deep cut.
[00:11:17.110]
They were naturally concerned about this change of design
[00:11:19.190]
and the possible risks involved.
[00:11:21.320]
And however, being able to bring all our data,
[00:11:24.050]
that’s the GI data, water abstraction wells,
[00:11:26.930]
geological interpretation, et cetera,
[00:11:28.610]
into one highly rich 3D environment,
[00:11:31.580]
we’re able to demonstrate in a clear way
[00:11:33.540]
why this piece of value engineering was feasible.
[00:11:38.170]
This change in design
[00:11:39.180]
is estimated to have saved tens of millions of pounds
[00:11:42.800]
in construction costs
[00:11:44.090]
and taken possibly up to a year of construction time.
[00:11:48.000]
So once again, we can see
[00:11:48.980]
that bringing our data, designs and places
[00:11:51.510]
into one space really works.
[00:11:56.060]
So let’s have a look at the collaboration across the teams
[00:11:58.240]
and the softwares.
[00:11:59.330]
By looking at a couple of asset-specific ground models
[00:12:02.130]
which were specifically created
[00:12:03.690]
to aid interpretation and design.
[00:12:06.820]
On one particular site
[00:12:08.630]
where we had a complex multidisciplinary design,
[00:12:11.900]
an asset-specific geological model has been created.
[00:12:15.460]
And this brought the following benefits to the team.
[00:12:18.140]
The interpretative ground model
[00:12:19.830]
was directly imported into MODFLOW
[00:12:22.040]
and helped inform groundwater control measures.
[00:12:25.140]
This will continue to help inform
[00:12:26.560]
during and post-construction.
[00:12:29.600]
Ground model facilitated coordination
[00:12:31.580]
between the geotechnical and the geoenvironmental
[00:12:33.680]
and early work contract teams
[00:12:35.401]
and was really good and helped to inform
[00:12:37.420]
the earthwork foundation designs
[00:12:39.080]
and their contamination and remediation strategy.
[00:12:42.570]
And finally, it helped to inform spacial characterization
[00:12:45.490]
of the intrinsic and state properties of the materials
[00:12:48.430]
and helped to inform the material reuse.
[00:12:52.420]
For earthwork assets,
[00:12:53.550]
we were able to connect our designs with our analysis,
[00:12:56.240]
and by taking a section out from our ground model
[00:12:59.370]
into SLOPE/W, we’re then able in SLOPE/W
[00:13:02.310]
to carry out our designs
[00:13:04.670]
before bringing it back into the Leapfrog environment,
[00:13:07.580]
and being able to see that in the same environment
[00:13:11.090]
as other SLOPE/W sections that were not lost.
[00:13:15.280]
This creates a continuous design analysis loop
[00:13:18.120]
and allows the analysis to be seen
[00:13:19.540]
within the context of the overall 3D model.
[00:13:23.810]
Then as engineering geologists and geotechnical engineers,
[00:13:26.710]
we are trained to think in geology in three dimensions,
[00:13:30.770]
but there are challenges in communicating this knowledge
[00:13:32.890]
and understanding to our stakeholders.
[00:13:35.840]
Utilizing the full package of the Central ecosystem
[00:13:38.660]
is allowing this historical barrier to be broken down.
[00:13:42.210]
And using real 3D models
[00:13:43.610]
in a highly visual and interactive way
[00:13:45.580]
in the heart of meetings, across teams and with stakeholders
[00:13:49.650]
has significantly aided the discussion
[00:13:51.900]
and ensuring there is a common understanding
[00:13:53.460]
of the ground conditions and the variations.
[00:13:57.290]
The BBV geotechnical team have found these processes
[00:14:00.530]
have enabled efficient management
[00:14:02.066]
of geotechnical information
[00:14:04.030]
and presents a significant leap forward
[00:14:06.150]
for ground data and information visualization,
[00:14:09.310]
bringing all the different parties together
[00:14:11.050]
across the table.
[00:14:14.090]
All this adds a real value to the data available
[00:14:16.500]
and puts it in the hands of those involved.
[00:14:19.710]
And as commented on by the BBV geotechnical manager,
[00:14:23.317]
“The benefits at scheme and detailed design stage
[00:14:26.030]
have been obvious,
[00:14:27.260]
we look forward to building
[00:14:28.280]
on the wealth of information captured
[00:14:30.000]
within our ground models and exploit further opportunities
[00:14:33.380]
throughout construction operation and maintenance.”
[00:14:39.404]
(indistinct) What does the future hold?
[00:14:42.490]
Some key ones for me, we are currently working
[00:14:44.570]
on include better linking of the models
[00:14:47.040]
and data within the models
[00:14:48.220]
to the wider common data environments,
[00:14:50.270]
project-wise and BIM 360.
[00:14:53.130]
Being able to better estimate the earthwork volumes,
[00:14:55.630]
including material class and the reuse outfits,
[00:14:58.920]
and being able to capture the key geotechnical testing data
[00:15:02.790]
during construction and its integration within the model.
[00:15:08.369]
Looking forward further ahead,
[00:15:10.200]
we are looking to see how we can capture face photographs
[00:15:13.290]
of open excavations alongside the onsite records
[00:15:16.370]
and in a digital format
[00:15:17.450]
that allows us to bring those directly back into the model,
[00:15:20.500]
e.g. faults and discontinuities.
[00:15:23.490]
Bringing in onsite construction information and records,
[00:15:26.890]
and then being able to close all this out
[00:15:28.650]
with being able to bring in the asset
[00:15:30.720]
as built models back into model two.
[00:15:34.600]
Alongside this, we are looking
[00:15:35.930]
to see how we can better use the Central environment
[00:15:38.310]
to more efficiently share the information
[00:15:40.330]
with our sub-contractors and the supply chain.
[00:15:45.000]
These developments would act
[00:15:46.000]
as a powerful design verification tool
[00:15:48.250]
that could be included in the health and safety pack
[00:15:50.470]
and maintained into the asset management phase.
[00:15:54.020]
All of these will be key
[00:15:54.970]
to ensuring a ground data legacy is retained
[00:15:58.710]
into the asset management phase,
[00:16:00.360]
and the benefits are felt
[00:16:01.300]
throughout the full 120-year design life and beyond.
[00:16:06.610]
Well, as I draw to a close,
[00:16:07.870]
I hope that you’ve seen in a glimpse into my world on HS2.
[00:16:12.770]
I hope that you have seen today how we’ve used
[00:16:15.080]
the 3D modeling and management software
[00:16:16.930]
developed by Seequent
[00:16:18.310]
and how it has opened up new opportunities
[00:16:20.310]
and allowed us to connect our data, our designs
[00:16:23.440]
and our people,
[00:16:24.430]
bringing benefits and savings to the N1N2 project.
[00:16:30.920]
And then I hope that I’ve been able to show
[00:16:32.760]
that we’ve been able to use it on a linear route,
[00:16:35.030]
along linear route,
[00:16:36.180]
and that the use of 3D modeling and such softwares
[00:16:39.950]
is not limited to just regular sites
[00:16:42.930]
with a good spread of GI data.
[00:16:46.080]
And then today I’ve demonstrated
[00:16:47.360]
that it is not just about 3D geological modeling,
[00:16:50.010]
but about being able to bring our data
[00:16:52.100]
and our designs together
[00:16:53.550]
to inform and strengthen our engineering.
[00:16:57.370]
And finally, I hope that you’ve seen
[00:16:59.230]
that from where I stand, the future is bright.
[00:17:03.040]
Thank you.