One of the exciting new features first launched in GeoStudio 2021 R2 is the ability to export results data from SEEP3D and TEMP3D analyses created using BUILD3D. This feature is crucial for improved interpretation of 3D analyses in hydrogeology and cold region engineering problems. Exported data can be further interpreted in external software packages, including Leapfrog Works or Python, to view the information against the original 3D geological model. This allows results interpretation and visualization in 3D space for improved understanding and decision-making.
This page will walk you through the key commands that are included in the new Export feature for SEEP3D and TEMP3D projects:
- Export Isosurfaces for further analysis.
- Export nodal results data for improved result visualization in external software packages.
- Export information along a defined grid spacing to ease comparison or calculations.
Export Isosurfaces for further analysis
The Draw Isosurfaces command in GeoStudio is used to visualize the location of a parameter of a single value on the 2D or 3D domain. This can include surfaces representing the zero pore-water pressure surface, considered the phreatic surface, or the zero-temperature isotherm, considered the phase change surface.
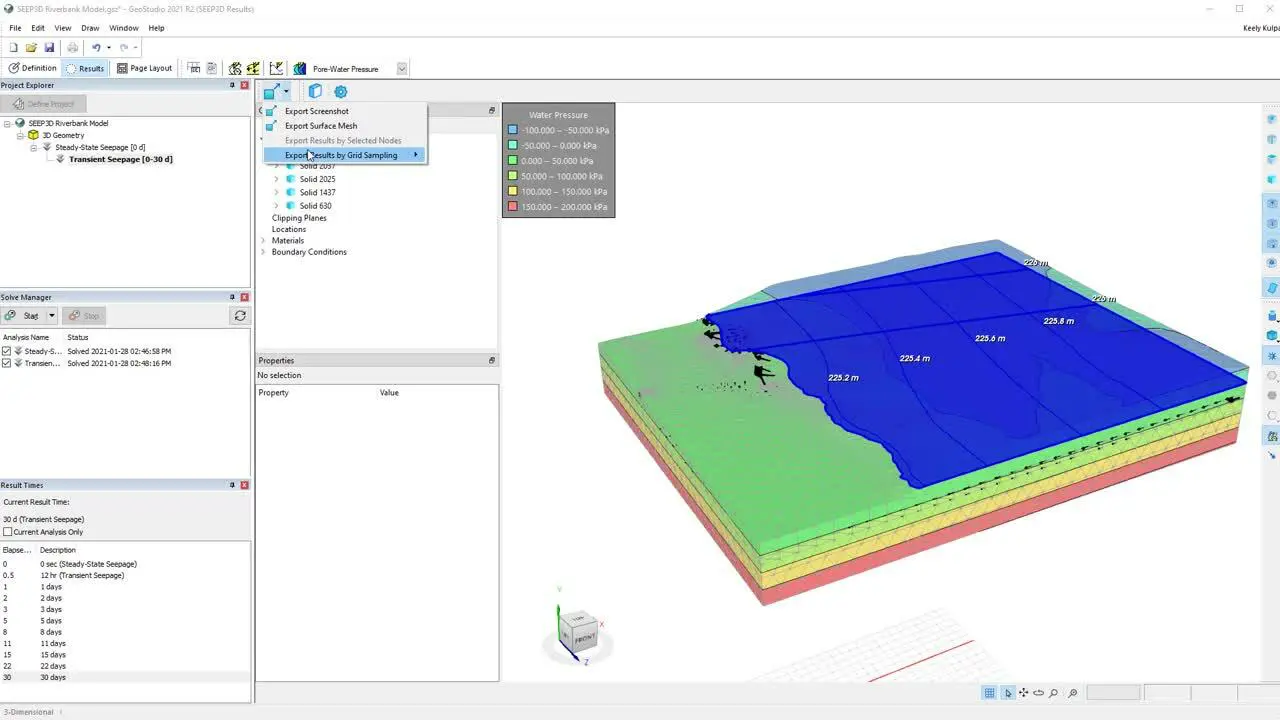
When reviewing 3D results in SEEP3D or TEMP3D, these isosurfaces can be exported for each time step from the Results View window as either a comma-delimited (CSV) or XYZ file format. The exported surface will include the elevation of the currently viewed isosurface over a prescribed grid on a horizontal plane. You have control over the exported grid spacing through the Grid Cell Size edit box of the Document Settings window for the embedded 3D viewer.
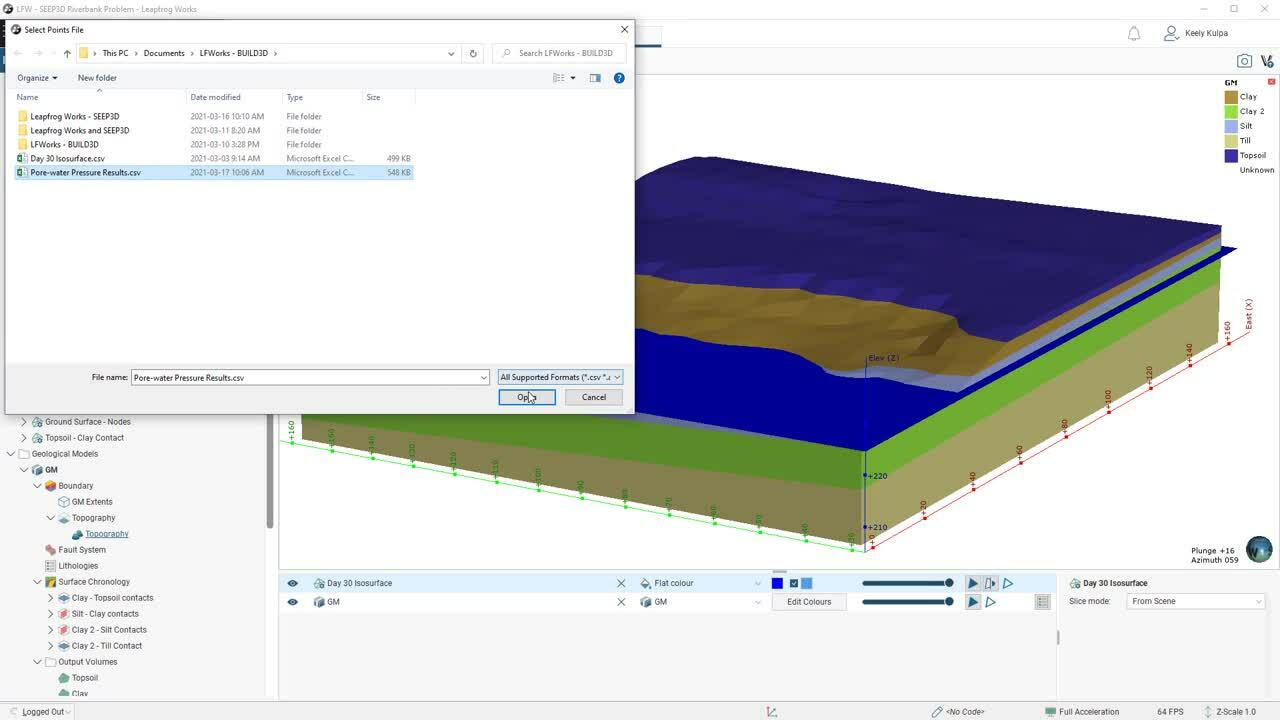
Once exported, the isosurface can be imported into external software programs, such as Leapfrog Works, to view the resulting water table or phase change surface in the context of the original geological model. The following clip illustrates how to export isosurface data from BUILD3D, as well as the steps to import the information into Leapfrog Works as a Point cloud.

Export nodal results data for improved result visualization in external software packages
Frequently, it can be helpful to visualize the range of values for a single parameter type across the entire model domain. For example, the resulting total head contours of a SEEP3D analysis. To export the result information at each node, it is important to use the comma-delimited (CSV) file type when exporting. In this case, the result information for the selected contour parameter type is exported with the x,y,z coordinates of the selected finite element mesh nodes.
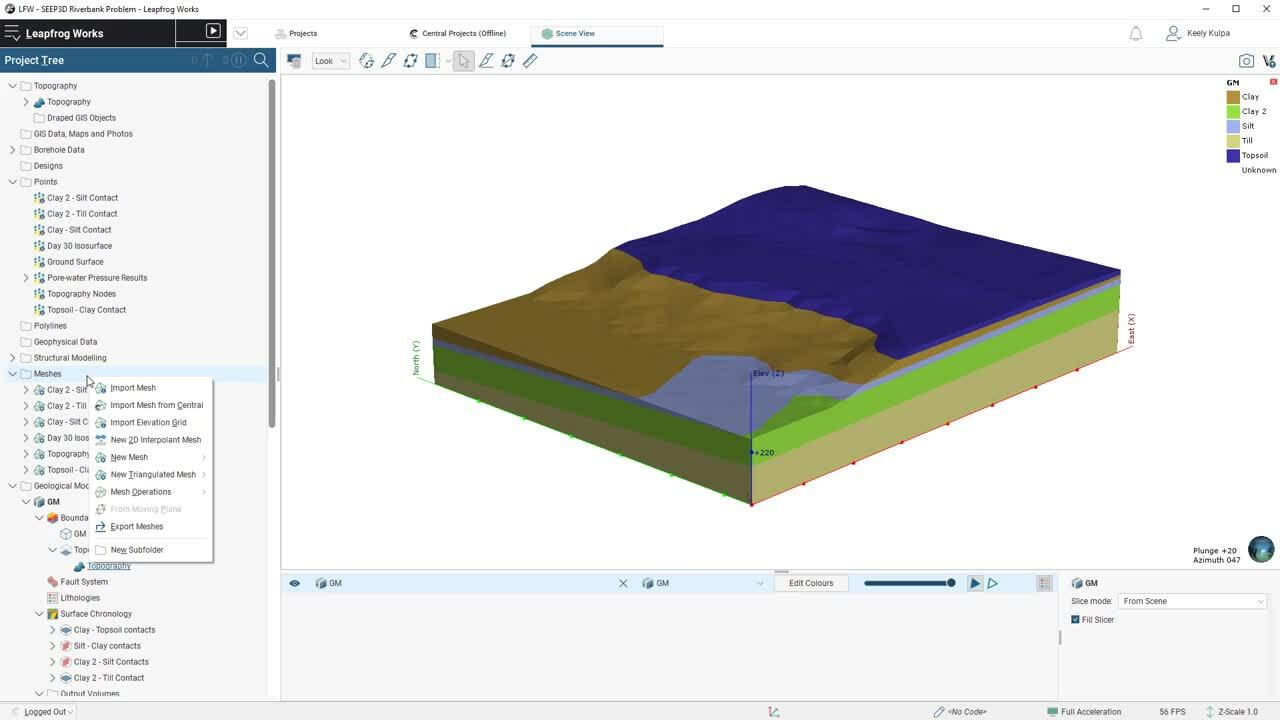
The Export Results by Selected Nodes command is helpful when you want to create a numeric model in programs such as Leapfrog Works. The following video clip illustrates how to export the nodal result information for a single parameter for the entire model domain, including all finite element mesh nodes in the geometry. These results are then imported into Leapfrog Works and used to create a Numeric Model, showing how the pore-water pressure results are visualized against the original geological domain.
Export information along a defined grid spacing to ease comparison or calculations
It is important in hydrogeological and cold region engineering projects to understand the changes in a particular parameter between two points in time. Examples include the creation of drawdown maps, which is the change in the water level due to pumping, or the depth to the freezing surface or permafrost during climate change in northern regions.
The Export Results by Grid Sampling feature in BUILD3D allows you to export the required result information for creating these types of maps or contours in external software, such as Leapfrog Works. The grid sampling is based on the same Grid Cell Size option as discussed in the Export Isosurfaces section, allowing you to have control over the x,y,z coordinate spacing of the grid in the exported file. The file formats that are exported should be the comma-delimited (CSV) file format to ensure that the contour parameter is exported with the x,y,z coordinates.
The following clip illustrates how to export the isosurface and ground surface from our SEEP3D project for creating a “Distance to” function in Leapfrog Works. This function can be used to create a contoured surface showing depth to the water table. You can use these same steps to create a depth to freezing front contoured surface using results from TEMP3D.
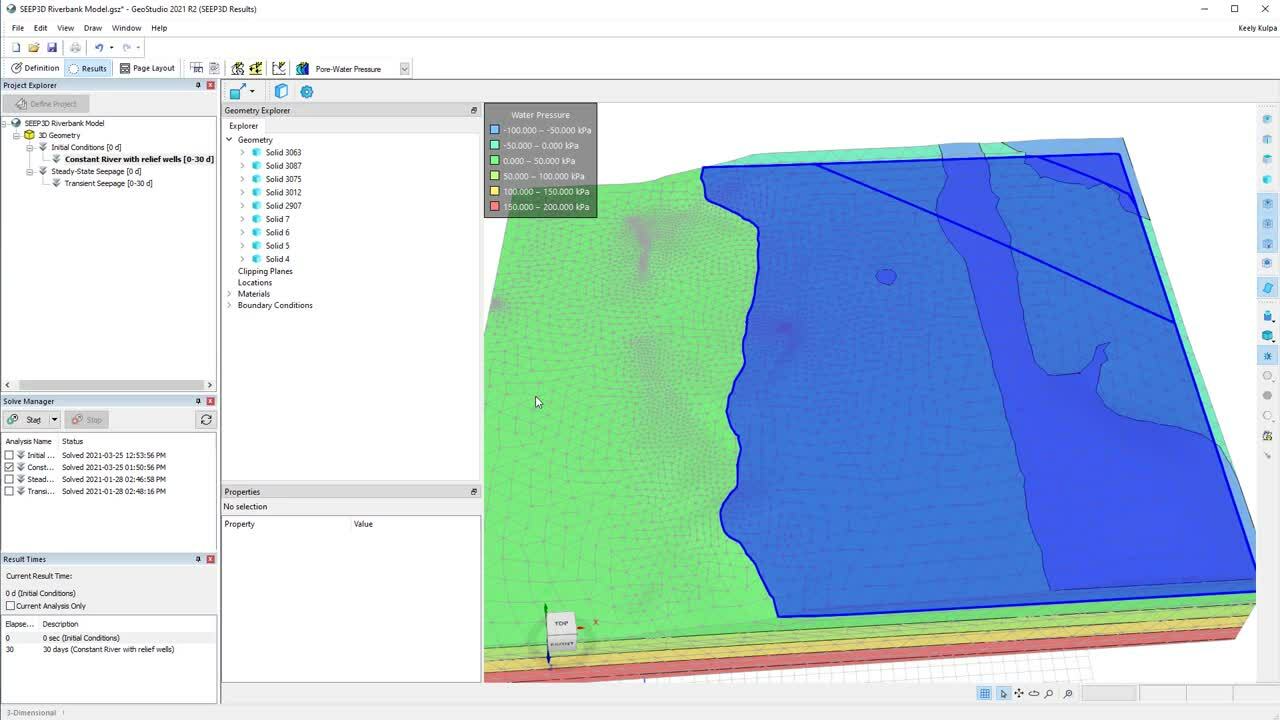
Alternatively, this information can also be used in programs such as Python to create useful images, such as drawdown maps for groundwater pumping. The following video clip shows how to create a drawdown map in Python using isosurface result information exported from SEEP3D. For this clip, we have added four relief wells along the crest of the riverbank for illustrative purposes.
We hope that the new export features available for your SEEP3D and TEMP3D projects make your result interpretation, visualisation, and reporting easier! If you’d like to try this new feature, contact us for a trial of the latest GeoStudio version. We appreciate any feedback you may have as we continue to expand on our 3D features and capabilities.